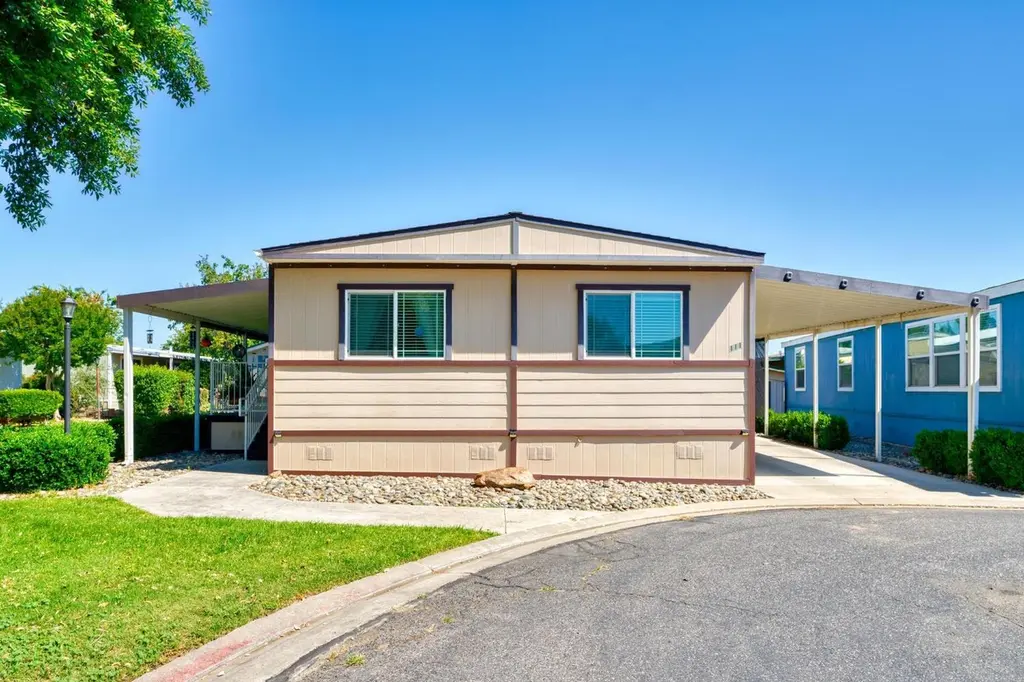
2841 Fowler Rd #111 · Ceres, CA
Flood risk 1/10 · Minimal
- FEMA flood zone
- X (unshaded)
- Chance of flooding over 30 yrs
- 0.0%
- Est. flood insurance / yr
- $507 – $1,088
Fire risk 3/10 · Minor
- Est. fire insurance / yr
- $659 – $1,223
Heat risk 6/10 · Moderate
- Hot days now (above 102°F)
- 7 days/yr
- Hot days in 30 yrs
- 13 days/yr
Wind risk 1/10 · Minimal
- Chance of severe wind over 30 yrs
- —
Air-quality risk 10/10 · Severe
- Unhealthy air days now
- 34 days/yr
- Unhealthy air days in 30 yrs
- 37 days/yr
Risk factors via First Street. Map © Google.
Why this score? — see what drove the B- grade
The composite is a weighted blend of 9 inputs, each scored 0–100. Each bar is that input's sub-score; the figure is the points it added to the 100-point composite (weight × sub-score).
- Cash flow +28.8/30.0
- DSCR +10.0/10.0
- 1% rule +8.0/10.0
- ARV discount +7.5/15.0
- Condition / age +4.0/5.0
- Schools +2.8/10.0
- Livability +2.7/5.0
- Rent growth +2.5/5.0
- Appreciation +0.0/10.0
$199,900
🖨 Deal sheet (PDF) 📄 Offer letter ✓ Due diligence
Listing remarks
Beautifully remodeled 3-bedroom, 2-bath manufactured home located on a premium space in the park with a lovely park view. This well-maintained home features a spacious primary suite with a stunning sunken tub and large freestanding shower. Enjoy peaceful mornings with coffee or relaxing evenings from the covered patio overlooking the beautiful greenbelt area. Pride of ownership shines throughout this move-in ready home. Come see all this inviting property has to offer-it may be the perfect place to call home!
Key facts
- Park view
- Remodeled
- Sunken tub
Tags
Property features AI
Finance
- Other: Located in Ceres, CA 95307; directions available to Las Casitas community
- HOA & community: No homeowners association; Not a senior community; Land lease: No (listed land lease amount noted)
Exterior
- Parking: Guest parking available
- Utilities: Gas plumbed; 220V in kitchen; 220V in laundry; Public water; Public sewer
- Home design: Manufactured in park; Double-wide; Updated/remodeled; Built in 1973; Santa Anita make; Composition roof
- Construction: Wood and other skirting
- Exterior features: Patio awning; Carport awning; Porch awning; Shed(s); Cul-de-sac location
Interior
- Kitchen: Island; Laminate counters; Free-standing gas range; Free-standing gas oven; Free-standing refrigerator; Dishwasher; Microwave
- Bedrooms: 3 bedrooms
- Flooring: Laminate flooring
- Bathrooms: 2 full bathrooms; Double sinks; Sunken tub; Tile surfaces; Shower stall(s)
- Heating & cooling: Central heating; Central cooling; Ceiling fans
- Interior features: Formal entry; Porch steps; Covered deck; Railed porch; Covered patio; Storage shed(s)
- Laundry & utility: Laundry closet with hookups (electric); Laundry sink; Washer/dryer hookups inside
Neighborhood map
What this means for you Summary
Snapshot
- This is a 3-bed/2.0-bath manufactured listed at $200k. Condition is rated good.
Deal economics
- At list price, monthly cash flow is $673 ($8k/yr) — positive.
- The deal already cash-flows at list — no discount required.
- Meets the 1% rule at list price ($3k rent vs $200k).
- Recommended offer: $197k (1.5% below list) — sets the bar for market timing.
- Cap rate 10.3% vs local median 3.8% in Ceres — top-decile yield for the area; either an underpriced asset or a hidden risk that comps aren't pricing in. Stress-test before assuming the spread holds.
Location & tenants
- Location reads 54/100 on livability (#923 in CA) — a working-class tenant base; expect higher turnover. Strengths: housing A+; Watch: employment C-, crime D+, schools D-.
- Ceres Unified (suburban): math 15% / reading 50% proficiency, ranked #303 of 517 in CA (top 59%) — families likely to look elsewhere, expect single-tenant / working-renter base with shorter leases; 69% free/reduced lunch — lower-income household profile, screen leases tightly.
- Market conditions: 87 active listings in the ZIP; 5 comparable units currently listed for rent nearby; rentals at typical pace (median 22d on market — plan ~3-4 weeks tenant-placement turnaround); solid renter incomes; 923 units permitted in Stanislaus County in 2024 (63 in 5+ unit buildings).
- This rent runs 39% of the median local income ($81k/yr) — at the standard rent-burdened threshold; future hikes will face affordability resistance.
Forward outlook
- Local home prices are declining (-3.0%/yr); year-one equity from $1k of loan paydown is wiped out by about $6k of value loss. Plan a longer hold.
- Stanislaus County population projected at +14% by 2050 — modest demand growth; plan on rents tracking national, not racing it.
- At projected returns (-3.0% appreciation + 3.0% rent growth), your $56k cash investment doubles in ~9 years — after that, you're playing with house money.
Negotiation context
- It's been on market 15 days — a 2% lower offer ($197k) is reasonable based on typical stale-listing flexibility.
Risks & watch-outs
- Climate carrying-cost: extreme-heat days projected 7→13/yr by 2055 (HVAC capex compounding) — expect insurance premiums to compound above CPI over the hold.
Questions for the listing agent
- Built in 1973 — when were the roof, HVAC, electrical panel, plumbing, and water heater last replaced?
- Is there a deadline driving the sale (1031 exchange, divorce, estate, relocation)? That informs how much negotiation room exists.
- Schools are D-rated, which usually means shorter tenancies and higher turnover. Who's the typical renter profile here, and what's been the actual vacancy rate?
- Crime grade is D in this area — have there been break-ins, vandalism, or insurance claims at this property in the last 3 years? What carrier currently insures it and at what premium?
- What's the average days-on-market for RENTAL listings here right now (not sales)? A rising rental-DOM trend means longer vacancies and softer asking-rent achievability than the comps imply.
- What's the recent tenant-quality profile in this submarket — average credit score on applications, eviction rate, late-payment / NSF rate, and stable-employment percentage? A property-management company in the area should have these aggregated.
- How much new for-sale + rental construction is in the pipeline within 1–3 miles? Heavy new supply typically softens prices + rents 12–24 months out; constrained supply supports both.
Investment metrics
- 1% rule
- 1.30% ✓
- Cap rate
- 10.34%
- Cash-on-cash
- 14.44%
- DSCR
- 1.64
- GRM
- 6.4
CMA / ARV
- ARV (median comp)
- $128,000
- List price
- $199,900
- Delta
- 56.17%
- Verdict
- OVERPRICED
- Comps
- 7 within 1.0 mi
Show comp detail 7 sales within ~0.75 mi
| Address | Dist | Beds/Ba | Sqft | Sold | Price | $/sf | Match |
|---|---|---|---|---|---|---|---|
| 2841 Fowler #141 | 0.14mi | 3/2.0 | 1,620 (+6%) | 12mo | $185,000 | $114 | 74 |
| 2841 Fowler #37 | 0.14mi | 2/2.0 (-1) | 1,440 (-6%) | 9mo | $105,000 | $73 | 71 |
| 2845 E Hatch Rd #84 | 0.42mi | 3/2.0 | 1,440 (-6%) | 1mo | $128,000 | $89 | 69 |
| 2845 E Hatch Rd #87 | 0.47mi | 4/2.0 (+1) | 1,536 (+0%) | 8mo | $130,000 | $85 | 66 |
| 2845 E Hatch Rd #78 | 0.47mi | 2/2.0 (-1) | 1,440 (-6%) | 3mo | $67,500 | $47 | 61 |
| 2845 E Hatch Rd #71 | 0.47mi | 3/2.0 | 1,440 (-6%) | 22mo | $110,000 | $76 | 50 |
| 2845 E Hatch Rd #44 | 0.49mi | 3/2.0 | 1,400 (-9%) | 23mo | $160,000 | $114 | 44 |
Match score weights: distance 35% · size 25% · config 20% · recency 20%. Top-matched comps best support the ARV.
Projected returns pro-forma
-3.0% appreciation · 3.0% rent growth · sell at horizon
- IRR
- 4.9%
- Equity multiple
- 1.19×
- Total profit
- $10,542
- Equity at exit
- $29,806
- IRR
- 14.3%
- Equity multiple
- 2.15×
- Total profit
- $64,573
- Equity at exit
- $17,284
Cash invested: $55,972 (down + closing). Projections, not guarantees.
Landlord ↔ Tenant lean methodology
- Overall (STATE)
- 18 Strongly Tenant-Friendly
- State California
- 18 Strongly Tenant-Friendly · D+13
- County
- — inherits STATE
- City
- — inherits STATE
ZIP-level market 95307
- Active inventory
- 87
- Price-to-rent
- 6.4×
Monthly cashflow live
- Estimated rent
- $2,601 medium interval (Pro) →
- Mortgage (P&I)
- −$1,048
- Tax est. 1.5%
- −$250 /mo · $2,998/yr
- Insurance
- −$83
- HOA
- −$0
- Vacancy / Maint / Mgmt
- −$546
- Net cashflow
- $673
Break-even live
Sensitivity live
| Price | -10% $812 | -5% $743 | +0% $673 | +5% $604 | +10% $535 |
|---|---|---|---|---|---|
| Rent | -10% $468 | -5% $571 | +0% $673 | +5% $776 | +10% $879 |
| Rate | -1.0pp $774 | -0.5pp $724 | base $673 | +0.5pp $622 | +1.0pp $569 |
UW: 25.0% down · 7.5% · 30yr · 1.5% tax · 5.0% vac · 8.0% maint · 8.0% mgmt
Financing live
Cash to close
- Down payment
- $49,975
- Closing costs
- $5,997
- Reserves months
- —
- Total cash needed
- —
Loan-product check · same deal, 3 products live
Conventional
25% down · 7.5% · 30yr
- Down + closing
- —
- Monthly P&I
- —
- Monthly cashflow
- —
- DSCR
- —
- Eligible?
- —
Personal DTI + credit; lowest rate.
DSCR
20% down · 8.5% · 30yr
- Down + closing
- —
- Monthly P&I
- —
- Monthly cashflow
- —
- DSCR
- —
- Eligible?
- —
No personal income docs; deal must DSCR.
Hard money
10% down · 12.0% · 12mo
- Down + closing
- —
- Monthly P&I
- —
- Monthly cashflow
- —
- DSCR
- —
- Eligible?
- —
Short-term bridge; refi at stabilization.
Rent comps 5 comps
| Address | Beds | Baths | Sqft | Rent | $/sqft | DOM | Units | Dist |
|---|---|---|---|---|---|---|---|---|
| 2685 Parkway Ceres, CA | 2.0 | 2.0 | 1150 | $795 | $0.69 | 44d | 1 | 0.28mi |
| 2029 Venus Dr Ceres, CA | 3.0 | 2.0 | 1336 | $2,500 | $1.87 | 24d | 1 | 0.41mi |
| 2808 Canyon Dr Modesto, CA | 3.0 | 2.0 | 1366 | $2,495 | $1.83 | 22d | 1 | 0.63mi |
| 2232 Ridgeway Dr Ceres, CA | 3.0 | 2.0 | 1432 | $2,295 | $1.60 | 14d | 1 | 0.74mi |
| 1120 Landreth Ct Modesto, CA | 3.0 | 2.0 | 1559 | $3,395 | $2.18 | 14d | 1 | 0.84mi |
Climate risk First Street
- Flood 1/10 Low FEMA zone X (unshaded) · 0% chance over 30 yrs
- Wildfire 3/10 Moderate
- Heat 6/10 Major 7 d/yr ≥102°F today · 13 d/yr by 30 yrs out
- Wind 1/10 Low
- Air quality 10/10 Extreme 34 unhealthy d/yr today · 37 by 30 yrs out
Nearby sold comps map
Loading sold comps map…
Walkable amenities ~0.75 mi
Loading nearby amenities…
Taxation est. · year 1
- Rental income
- $31,215
- − Mortgage interest
- −$11,198
- − Property taxes
- −$2,998
- − Insurance
- −$1,000
- − Repairs & maintenance
- −$2,497
- − Management
- −$2,497
- − Depreciation
- −$5,815
- Taxable income
- $5,209
- Est. tax owed @ 24.0%
- −$1,250
- After-tax cash flow
- $6,832/yr
For passive investors: Depreciation is non-cash, so a rental often shows a tax loss while cash-flowing — sheltering income. Rental losses are passive: they offset passive income freely, and up to $25,000/yr can offset ordinary (W-2) income if you actively participate and your MAGI is under $100k (phasing out to $0 by $150k); unused losses carry forward. On sale, claimed depreciation is recaptured at up to 25%, and gains may owe capital-gains tax (a 1031 exchange can defer both). Figures are a year-1 estimate at your 24.0% rate — not tax advice; consult a CPA.
Condition & rehab AI · 12 photos
This move-in ready manufactured home is in good condition with modern amenities and a great location. Minor updates could further enhance its curb appeal and value.
Value-add opportunities
- Both Paint exterior — Enhances curb appeal and value
- Both Replace ceiling fans — Modernizes and improves airflow
- Both Replace HVAC units — Improves comfort and energy efficiency
Renovation cost estimate screening
Value-add ROI direction
- Both Paint exterior — Enhances curb appeal and value ↑
- Both Replace ceiling fans — Modernizes and improves airflow ↑
- Both Replace HVAC units — Improves comfort and energy efficiency ↑
ⓘ Cost ranges are severity-bucket heuristics (US national rule-of-thumb). Get contractor quotes + a written scope before underwriting a rehab budget.
Schools (NCES district)
- District
- Ceres Unified
- NCES district ID
- 0608130
- Math proficiency
- 15% ▼ -9.00%
- Reading proficiency
- 50% ▲ 12.00%
- Median HH income
- $48,178
- Composite
- 27.96/100
- National rank
- #6858
- State rank
- #303 of 517 in CA
Livability — Ceres
- Score
- 54/100
- State rank
- #923
- US rank
- #24224
Category grades
Schools grade is shown separately in the Schools card above.
Census & demographics
- Census place
- Ceres, CA
- County
- Stanislaus County · 445,786 people
- City population
- 46,310
- Metro
- Modesto, CA
- Population (ZIP)
- 46,310
- Household income
- $80,627
- Rent vs Own
- Severe rent burden
- 1102.0
Population outlook (Stanislaus County) Hauer SSP2
- Today (2025)
- 579,493 people
- By 2030
- 598,000 · +3.2%
- By 2040
- 630,930 · +8.9%
- By 2050
- 658,300 · +13.6%
- By 2075
- 712,363 · +22.9%
- By 2100
- 719,805 · +24.2%
Race, ethnicity, and origin ACS 2023
- Neighborhood character
- Majority Hispanic (64%)
- Race & ethnicity
- Hispanic / Latino 64% Two or more races 34% White 23% Asian 8% Black 1%
- Hispanic origin (detail)
- Mexican 61%
- Common ancestry
- Russian 3% Lithuanian 1% Italian 1%
- Foreign-born
- 27% · Canada, China
- Languages at home
- 41% English-only · Spanish 49% Other Indo-European 7% Arabic 1%
Political lean MEDSL · Stanislaus
- 2024 margin
- R (+11.0) · D 43.2% · R 54.2% · Other 2.6%
- 2008→2024 swing
- -12.7pp toward R · 2008: 1.7pp · 2024: -11.0pp
- All cycles
- 2024: R+11.0 2020: D+0.8 2016: D+0.6 2012: D+0.7 2008: D+1.7
Not yet ingested
- Civics
- —
Market trends
- HPI YoY
- ▼ -362.75%
- Current HPI
- 307.5192
- Rent YoY
- —
- Metro
- Modesto, CA
- State GDP YoY
- ▲ 3.21%
- F500 in state
- 116
Industry mix (Fortune 500 HQ in CA)
| Industry | F500 HQs | Revenue |
|---|---|---|
| Technology | 27 | $1,492B |
|
||
| Financial Services | 3 | $174B |
|
||
| Retail | 3 | $44B |
|
||
| Insurance | 3 | $26B |
|
||
| Media / Entertainment | 2 | $115B |
|
||
| Pharmaceuticals / Biotech | 2 | $62B |
|
||
Cash-flow waterfall
monthlySold comps — $/sqft
last 12 mo · ≤1 miLoading sold comps…