 Triplex
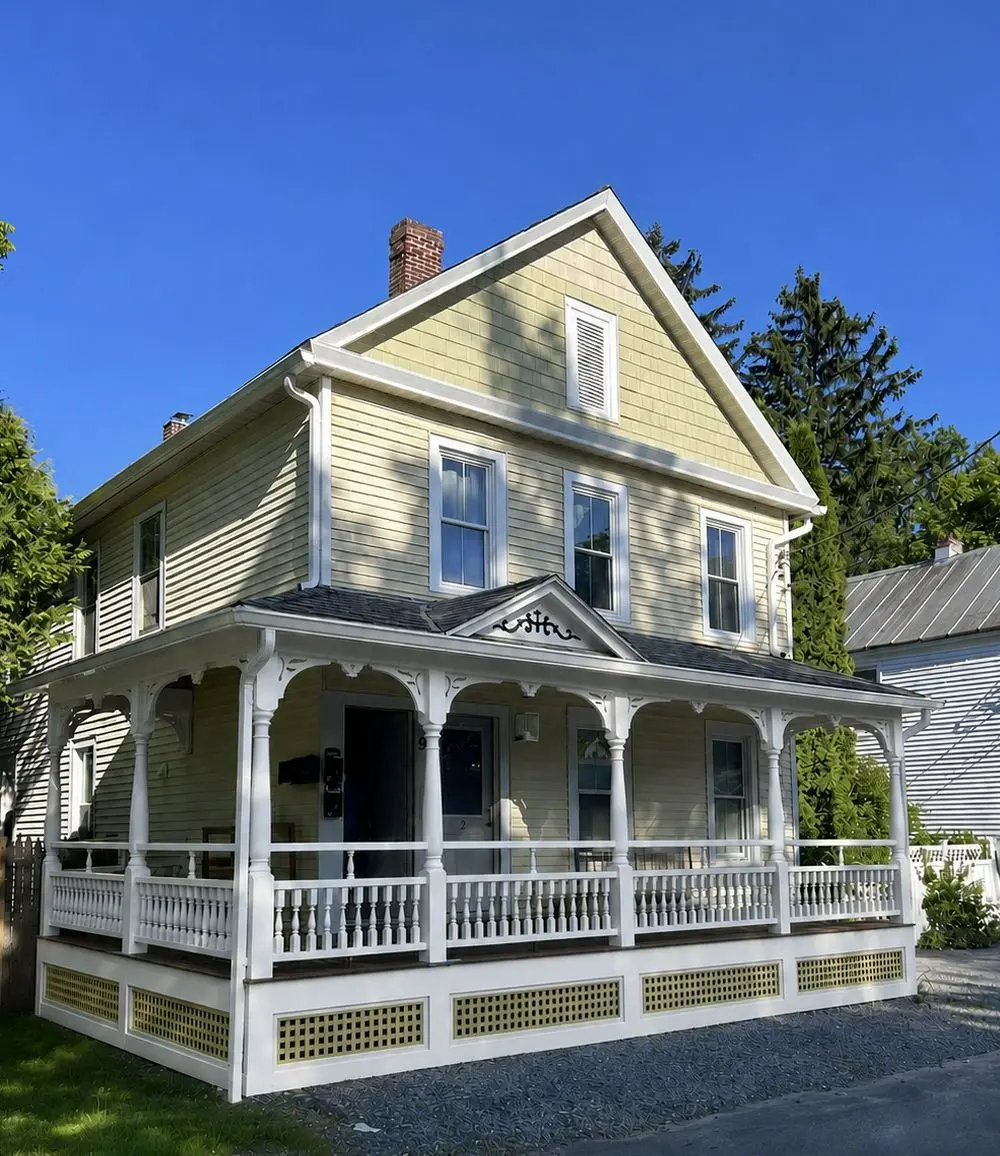
98 Walworth St · Saratoga Springs, NY
Flood risk No data
- FEMA flood zone
- —
- Chance of flooding over 30 yrs
- —
- Est. flood insurance / yr
- —
Fire risk No data
- Est. fire insurance / yr
- —
Heat risk No data
- Hot days now (above threshold)
- —
- Hot days in 30 yrs
- —
Wind risk No data
- Chance of severe wind over 30 yrs
- —
Air-quality risk No data
- Unhealthy air days now
- —
- Unhealthy air days in 30 yrs
- —
Risk factors via First Street. Map © Google.
Why this score? — see what drove the B grade
The composite is a weighted blend of 9 inputs, each scored 0–100. Each bar is that input's sub-score; the figure is the points it added to the 100-point composite (weight × sub-score).
- Cash flow +30.0/30.0
- DSCR +10.0/10.0
- ARV discount +9.1/15.0
- 1% rule +7.6/10.0
- Schools +6.1/10.0
- Rent growth +4.8/5.0
- Livability +4.1/5.0
- Condition / age +2.5/5.0
- Appreciation +0.0/10.0
$749,000
🖨 Deal sheet (PDF) 📄 Offer letter ✓ Due diligence
Multi-family units
County records classify this as Multi-Family (2-4 Unit). Listing-text estimate: 3 units. confirmed
Listing remarks MLS
RANCH HOME NEAR HOSPITAL WITH SOME FIXING UP COULD BE A GREAT HOME. GOOD SIZE YARD COULD USE COSMETIC WORK A RARE FIND AND PRICED TO SELL AS IS RIGHT AWAY. Good Condition
Key facts
- Private garden
- Second-story deck
- Wrap-around porch
Tags
Property features AI
Exterior
- Home design: Multi-family property
- Construction: Total living area approximately 2,640 square feet
- Exterior features: Property sits on a 4,356 sq ft lot
Neighborhood map
What this means for you Summary
Snapshot
- This is a 3 × 5-bed/3.0-bath units multifamily listed at $749k.
Deal economics
- At list price, monthly cash flow is $3k ($37k/yr) — positive. Per door: $1k/mo.
- The deal already cash-flows at list — no discount required.
- Meets the 1% rule at list price ($9k rent vs $749k).
- Cap rate 11.2% vs local median 2.0% in Saratoga Springs — top-decile yield for the area; either an underpriced asset or a hidden risk that comps aren't pricing in. Stress-test before assuming the spread holds.
Location & tenants
- Location reads 82/100 on livability (#83 in NY, #1,284 nationally) — a professional / high-income tenant draw. Strengths: employment A+, housing A+, schools A; Watch: amenities D+, cost of living F.
- Saratoga Springs City SD (suburban): math 67% / reading 72% proficiency, ranked #138 of 590 in NY (top 23%) — acceptable for families but not a draw, mixed tenant base, ~2y average lease; only 15% free/reduced lunch — higher-income household profile.
- Market conditions: Rents rising fast (+9.2%/yr); 474 active listings in the ZIP; 6 comparable units currently listed for rent nearby; rentals at typical pace (median 25d on market — plan ~3-4 weeks tenant-placement turnaround); solid renter incomes; 1,132 units permitted in Saratoga County in 2024 (378 in 5+ unit buildings).
- At $9,455/mo this rent would consume 111% of the median local household income ($102k/yr) (locally 1424% of renters already pay >50% of income on rent) — very limited rent-growth headroom before tenants either downsize or default.
Forward outlook
- Local home prices are declining (-3.0%/yr); year-one equity from $5k of loan paydown is wiped out by about $22k of value loss. Plan a longer hold.
- Saratoga County population projected at +4% by 2050 — modest demand growth; plan on rents tracking national, not racing it.
- At projected returns (-3.0% appreciation + 8.0% rent growth), your $210k cash investment doubles in ~6 years — after that, you're playing with house money.
Negotiation context
- Only 10 days on market — expect competitive offers; lowballing is unlikely to land.
- 2 sale attempts since 25y ago with the ask held roughly flat each time — persistent listings suggest the price (not the market) is what's stuck; bring a comps-based counter.
- Current owner paid $152k; list at $749k implies a 394% gain — meaningful room to come down on a strong offer.
Risks & watch-outs
- Watch-outs: built in 1900 — expect roof / HVAC / electrical / plumbing capex.
Questions for the listing agent
- Can we see the unit-by-unit rent roll, current vacancy, and any below-market leases? What's the average tenancy length?
- What capital expenditures (roof, boiler, parking lot, exteriors) have been made in the last 5 years, and what's planned in the next 2?
- Built in 1900 — when were the roof, HVAC, electrical panel, plumbing, and water heater last replaced?
- Is there a deadline driving the sale (1031 exchange, divorce, estate, relocation)? That informs how much negotiation room exists.
- Schools are A-rated — typically a magnet for longer-tenancy family renters. What's the average tenant stay here, and is there a school-zone premium baked into asking?
- What's the average days-on-market for RENTAL listings here right now (not sales)? A rising rental-DOM trend means longer vacancies and softer asking-rent achievability than the comps imply.
- What's the recent tenant-quality profile in this submarket — average credit score on applications, eviction rate, late-payment / NSF rate, and stable-employment percentage? A property-management company in the area should have these aggregated.
- How much new apartment / multifamily construction is in the pipeline within 1–3 miles? Heavy new supply (>2% of stock underway) typically softens rents 12–24 months out; light construction supports rent growth.
Investment metrics
- 1% rule
- 1.26% ✓
- Cap rate
- 11.22%
- Cash-on-cash
- 17.58%
- DSCR
- 1.78
- GRM
- 6.6
CMA / ARV
- ARV (on-the-fly)
- $776,160
- Comps found
- 9
Show comp detail 9 sales within ~0.75 mi
| Address | Dist | Beds/Ba | Sqft | Sold | Price | $/sf | Match |
|---|---|---|---|---|---|---|---|
| 138-140 Church St | 0.02mi | 5/4.0 | 2,501 (-5%) | 0mo | $975,000 | $390 | 86 |
| 38 State St | 0.37mi | 5/4.0 | 2,540 (-4%) | 9mo | $660,000 | $260 | 65 |
| 28 Waterbury St | 0.21mi | 6/3.0 (+1) | 2,294 (-13%) | 1mo | $675,000 | $294 | 63 |
| 74 Walnut St | 0.43mi | 6/3.0 (+1) | 2,908 (+10%) | 2mo | $739,900 | $254 | 57 |
| 17 York Ave | 0.69mi | 4/3.0 (-1) | 2,620 (-1%) | 8mo | $895,000 | $342 | 55 |
| 159 Grand Ave | 0.32mi | 4/3.5 (-1) | 2,896 (+10%) | 9mo | $790,000 | $273 | 54 |
| 25 Clinton St | 0.18mi | 6/4.0 (+1) | 2,955 (+12%) | 17mo | $1,175,000 | $398 | 49 |
| 212 Circular St | 0.72mi | 6/3.0 (+1) | 2,544 (-4%) | 15mo | $650,000 | $256 | 43 |
| 135 Maple Ave | 0.64mi | 4/5.0 (-1) | 2,952 (+12%) | 3mo | $950,000 | $322 | 35 |
Match score weights: distance 35% · size 25% · config 20% · recency 20%. Top-matched comps best support the ARV.
Projected returns pro-forma
-3.0% appreciation · 8.0% rent growth · sell at horizon
- IRR
- 14.0%
- Equity multiple
- 1.59×
- Total profit
- $123,975
- Equity at exit
- $111,678
- IRR
- 26.1%
- Equity multiple
- 3.79×
- Total profit
- $586,025
- Equity at exit
- $64,760
Cash invested: $209,720 (down + closing). Projections, not guarantees.
Landlord ↔ Tenant lean methodology
- Overall (STATE)
- 15 Strongly Tenant-Friendly
- State New York
- 15 Strongly Tenant-Friendly · D+10
- County
- — inherits STATE
- City
- — inherits STATE
ZIP-level market 12866
- Home prices YoY
- -31.8%
- Rents YoY
- 9.2%
- Active inventory
- 474
- Price-to-rent
- 19.8×
Monthly cashflow live
- Estimated rent
- $9,455 medium interval (Pro) →
- Mortgage (P&I)
- −$3,928
- Tax from tax record
- −$157 /mo · $1,880/yr
- Insurance
- −$312
- HOA
- −$0
- Vacancy / Maint / Mgmt
- −$1,986
- Net cashflow
- $3,073
Break-even live
Sensitivity live
| Price | -10% $3,497 | -5% $3,285 | +0% $3,073 | +5% $2,861 | +10% $2,649 |
|---|---|---|---|---|---|
| Rent | -10% $2,326 | -5% $2,699 | +0% $3,073 | +5% $3,446 | +10% $3,820 |
| Rate | -1.0pp $3,450 | -0.5pp $3,263 | base $3,073 | +0.5pp $2,879 | +1.0pp $2,681 |
3-unit breakdown (identical units grouped — click to expand)
| Units | Beds | Baths | Est. rent |
|---|---|---|---|
| 3× units | 5 | 3 | $9,456 |
| #1 | 5 | 3 | $3,152 |
| #2 | 5 | 3 | $3,152 |
| #3 | 5 | 3 | $3,152 |
| Total (3 units) | $9,455 | ||
UW: 25.0% down · 7.5% · 30yr · 1.5% tax · 5.0% vac · 8.0% maint · 8.0% mgmt
Financing live
Cash to close
- Down payment
- $187,250
- Closing costs
- $22,470
- Reserves months
- —
- Total cash needed
- —
Loan-product check · same deal, 3 products live
Conventional
25% down · 7.5% · 30yr
- Down + closing
- —
- Monthly P&I
- —
- Monthly cashflow
- —
- DSCR
- —
- Eligible?
- —
Personal DTI + credit; lowest rate.
DSCR
20% down · 8.5% · 30yr
- Down + closing
- —
- Monthly P&I
- —
- Monthly cashflow
- —
- DSCR
- —
- Eligible?
- —
No personal income docs; deal must DSCR.
Hard money
10% down · 12.0% · 12mo
- Down + closing
- —
- Monthly P&I
- —
- Monthly cashflow
- —
- DSCR
- —
- Eligible?
- —
Short-term bridge; refi at stabilization.
Rent comps 6 comps
| Address | Beds | Baths | Sqft | Rent | $/sqft | DOM | Units | Dist |
|---|---|---|---|---|---|---|---|---|
| 194 Grand Ave Saratoga Springs, NY | 4.0 | 2.5 | 2200 | $28,000 | $12.73 | 45d | 1 | 0.38mi |
| 55 State St Saratoga Springs, NY | 4.0 | 3.0 | 2216 | $20,000 | $9.03 | 15d | 1 | 0.40mi |
| 10 Marion Pl Saratoga Springs, NY | 4.0 | 2.0 | 1800 | $4,500 | $2.50 | 24d | 1 | 0.75mi |
| 162 Lake Ave Saratoga Springs, NY | 4.0 | 1.5 | 2525 | $3,500 | $1.39 | 24d | 1 | 0.83mi |
| 77 White St Saratoga Springs, NY | 4.0 | 2.5 | 2088 | $4,950 | $2.37 | 24d | 1 | 0.86mi |
| 64 Second St Saratoga Springs, NY | 4.0 | 2.0 | 1838 | $3,400 | $1.85 | 24d | 1 | 0.86mi |
Listing history 8 events
-
2026-06-21days on market $749,000 Active 10 DOM
-
2026-06-18days on market $749,000 Active 7 DOM
-
2026-06-17days on market $749,000 Active 6 DOM
-
2026-06-16days on market $749,000 Active 5 DOM
-
2026-06-15days on market $749,000 Active 4 DOM
-
2026-06-14days on market $749,000 Active 2 DOM
-
2026-06-13remarks 695-char remark
-
2026-06-13$749,000 Active 1 DOM
ⓘ Source: listings_history table (triggers on properties + properties_extension) + one-shot
backfill from property_details.listing_events for pre-trigger history.
Tax reassessment forecast NY · Partial reset (capped growth)
- Current annual tax
- $1,880 · $157/mo
- Projected year-2 tax
- $7,269 · $606/mo
- Expected delta
- +$5,389/yr (+$449/mo · 286.7%)
ⓘ Screening estimate from a state-policy table — verify with the county assessor before closing.
Nearby sold comps map
Loading sold comps map…
Walkable amenities ~0.75 mi
Loading nearby amenities…
Taxation est. · year 1
- Rental income
- $113,460
- − Mortgage interest
- −$41,956
- − Property taxes
- −$1,880
- − Insurance
- −$3,745
- − Repairs & maintenance
- −$9,077
- − Management
- −$9,077
- − Depreciation
- −$21,789
- Taxable income
- $25,937
- Est. tax owed @ 24.0%
- −$6,225
- After-tax cash flow
- $30,650/yr
For passive investors: Depreciation is non-cash, so a rental often shows a tax loss while cash-flowing — sheltering income. Rental losses are passive: they offset passive income freely, and up to $25,000/yr can offset ordinary (W-2) income if you actively participate and your MAGI is under $100k (phasing out to $0 by $150k); unused losses carry forward. On sale, claimed depreciation is recaptured at up to 25%, and gains may owe capital-gains tax (a 1031 exchange can defer both). Figures are a year-1 estimate at your 24.0% rate — not tax advice; consult a CPA.
Schools (NCES district)
- District
- Saratoga Springs City SD
- NCES district ID
- 3625770
- Math proficiency
- 67% ▼ -10.00%
- Reading proficiency
- 72% ▲ 6.00%
- Median HH income
- $69,864
- Composite
- 60.83/100
- National rank
- #818
- State rank
- #138 of 590 in NY
Livability — Saratoga Springs
- Score
- 82/100
- State rank
- #83
- US rank
- #1284
Category grades
Schools grade is shown separately in the Schools card above.
Census & demographics
- Census place
- Saratoga Springs, NY
- County
- Saratoga County · 166,192 people
- City population
- 40,057
- Metro
- Albany-Schenectady-Troy, NY
- Population (ZIP)
- 40,057
- Household income
- $101,901
- Rent vs Own
- Severe rent burden
- 1424.0
Population outlook (Saratoga County) Hauer SSP2
- Today (2025)
- 238,889 people
- By 2030
- 243,681 · +2.0%
- By 2040
- 249,118 · +4.3%
- By 2050
- 248,638 · +4.1%
- By 2075
- 241,675 · +1.2%
- By 2100
- 213,150 · -10.8%
Race, ethnicity, and origin ACS 2023
- Neighborhood character
- Predominantly White (87%)
- Race & ethnicity
- White 87% Two or more races 5% Hispanic / Latino 4% Asian 2% Black 2%
- Common ancestry
- Romanian 6% Lithuanian 5% Slovak 2%
- Foreign-born
- 6% · Canada, South Korea, China
- Languages at home
- 92% English-only · Spanish 2% German/W. Germanic 1% Korean 1%
Political lean MEDSL · Saratoga
- 2024 margin
- Toss-up / Even · D 50.9% · R 49.1%
- 2008→2024 swing
- -1.6pp toward R · 2008: 3.4pp · 2024: 1.8pp
- All cycles
- 2024: D+1.8 2020: D+5.4 2016: R+4.4 2012: D+2.1 2008: D+3.4
Not yet ingested
- Civics
- —
Market trends
- HPI YoY
- ▼ -178.78%
- Current HPI
- 382.7429
- Rent YoY
- ▲ 9.15%
- Metro
- Albany-Schenectady-Troy, NY
- State GDP YoY
- ▲ 2.60%
- F500 in state
- 92
Industry mix (Fortune 500 HQ in NY)
| Industry | F500 HQs | Revenue |
|---|---|---|
| Financial Services | 10 | $950B |
|
||
| Consumer Goods | 9 | $162B |
|
||
| Insurance | 4 | $225B |
|
||
| Telecommunications | 2 | $144B |
|
||
| Pharmaceuticals | 2 | $112B |
|
||
| Media / Entertainment | 2 | $69B |
|
||
Price history
+508.9% since first listed5 events — show timeline
- 2026-06-11 Listed $749,000 ForSaleByOwner.com
- 2002-07-10 Sold (Public Records) $151,580 Public Records
- 2002-02-01 Sold (MLS) $70,000 Global MLS
- 2001-09-25 Listed $74,900 Global MLS
- 1995-12-18 Sold (Public Records) $123,000 Public Records
Property tax history
-5.0%/yrLatest (2025): $1,880 · -61.6% YoY. Source: county tax records.
Cash-flow waterfall
monthlySold comps — $/sqft
last 12 mo · ≤1 miLoading sold comps…