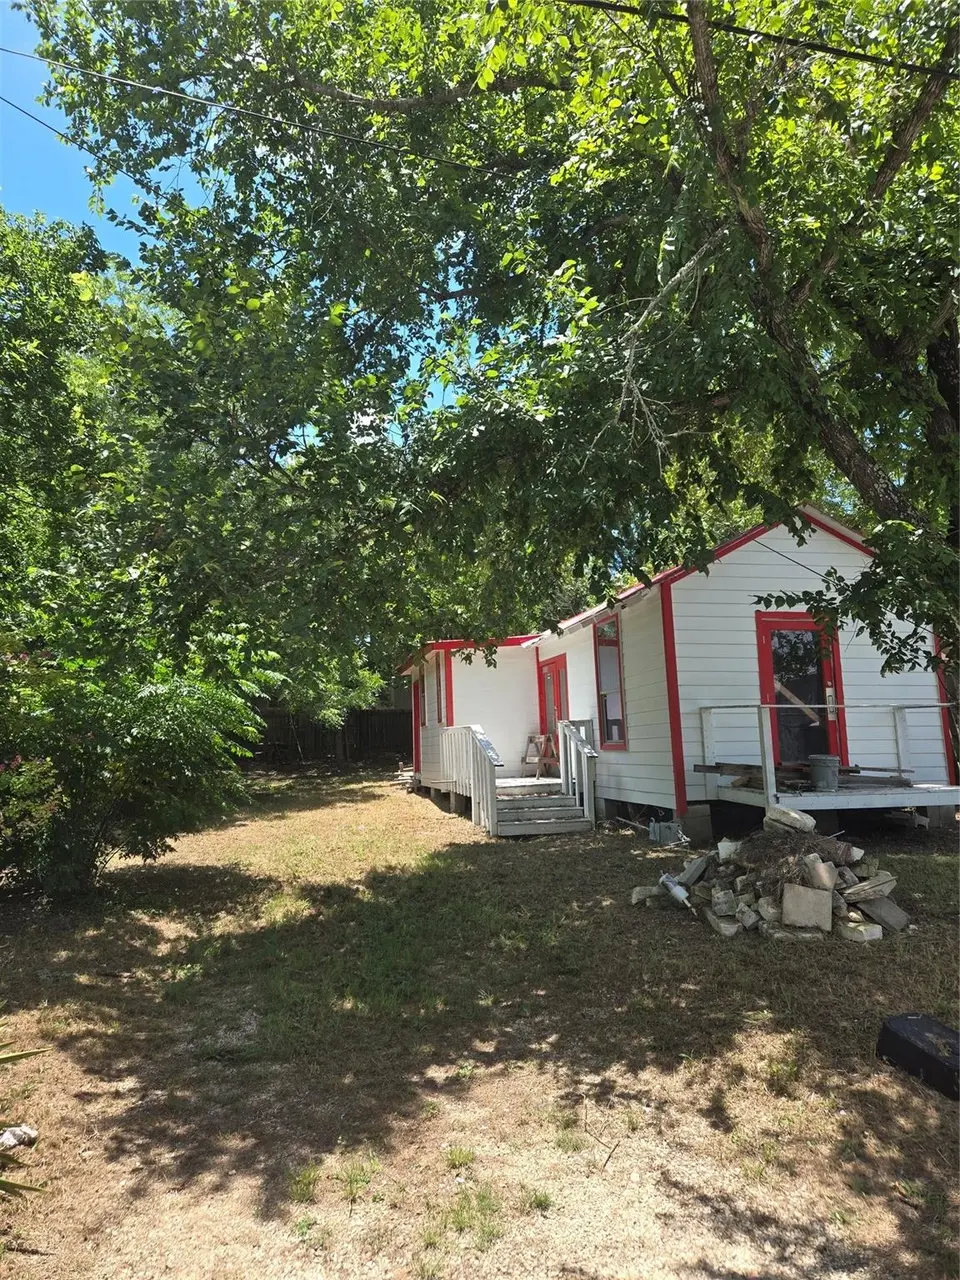
729 Chihuahua St · Lockhart, TX
Flood risk 1/10 · Minimal
- FEMA flood zone
- X (unshaded)
- Chance of flooding over 30 yrs
- 0.0%
- Est. flood insurance / yr
- $507 – $1,088
Fire risk 6/10 · Moderate
- Est. fire insurance / yr
- $1,222 – $2,270
Heat risk 8/10 · Major
- Hot days now (above 108°F)
- 7 days/yr
- Hot days in 30 yrs
- 21 days/yr
Wind risk 8/10 · Major
- Chance of severe wind over 30 yrs
- 80.0%
Air-quality risk 1/10 · Minimal
- Unhealthy air days now
- 0 days/yr
- Unhealthy air days in 30 yrs
- 0 days/yr
Risk factors via First Street. Map © Google.
Why this score? — see what drove the B+ grade
The composite is a weighted blend of 9 inputs, each scored 0–100. Each bar is that input's sub-score; the figure is the points it added to the 100-point composite (weight × sub-score).
- Cash flow +30.0/30.0
- ARV discount +15.0/15.0
- 1% rule +10.0/10.0
- DSCR +10.0/10.0
- Livability +3.4/5.0
- Rent growth +2.5/5.0
- Condition / age +2.5/5.0
- Schools +2.4/10.0
- Appreciation +0.0/10.0
$70,000
🖨 Deal sheet 📄 Offer letter ✓ Due diligence
Listing remarks MLS
Affordable Fixer-Upper Opportunity in Lockhart Priced to sell. This is a rare chance to own and personalize a starter home or investment property in the heart of Lockhart. This single-family home offers 1 bedroom and 1 full bathroom in approximately 400+ square feet of interior space on a generous 4,600 square foot lot. The owner has begun remodeling, so this property is ideal for a buyer with vision looking to complete the project and add value. Bring your design ideas and take advantage of the affordable price point — perfect for first-time buyers, investors, or anyone looking for a manageable rehab project in a market with strong demand. Conveniently located near local amenities and within easy reach of downtown Lockhart, this home delivers endless potential.
Key facts
- Generous lot
- Investment property
- Local amenities
Tags
Neighborhood map
What this means for you Summary
Snapshot
- This is a 1-bed/1.0-bath single-family listed at $70k.
Deal economics
- At list price, monthly cash flow is $329 ($4k/yr) — positive.
- The deal already cash-flows at list — no discount required.
- Meets the 1% rule at list price ($1k rent vs $70k).
- Recommended offer: $62k (12.0% below list) — sets the bar for market timing.
- Cap rate 11.9% vs local median 3.0% in Lockhart — top-decile yield for the area; either an underpriced asset or a hidden risk that comps aren't pricing in. Stress-test before assuming the spread holds.
Location & tenants
- Location reads 67/100 on livability (#535 in TX) — a middle-class / working-renter tenant base. Strengths: cost of living A+, housing A+, crime B+; Watch: schools D-, amenities F, commute F.
- Lockhart ISD (town): math 27% / reading 29% proficiency, ranked #657 of 826 in TX (top 80%) — low school quality limits family demand, transient renter base, plan for 1-2y turnover; 62% free/reduced lunch — lower-income household profile, screen leases tightly.
- Market conditions: 452 active listings in the ZIP; 529 units permitted in Caldwell County in 2024 (6 in 5+ unit buildings).
- This rent is only 18% of the median local income ($75k/yr) — well below the 30% rent-burden line; pricing power to push rent on renewal without tenant pushback.
Forward outlook
- Local home prices are declining (-3.0%/yr); year-one equity from $484 of loan paydown is wiped out by about $2k of value loss. Plan a longer hold.
- Caldwell County population projected at +33% by 2050 — long-run rental-demand tailwind backs the buy-and-hold thesis.
- At projected returns (-3.0% appreciation + 3.0% rent growth), your $20k cash investment doubles in ~6 years — after that, you're playing with house money.
Negotiation context
- It's been on market 132 days — a 12% lower offer ($62k) is reasonable based on typical stale-listing flexibility.
- 4 sale attempts since 2y ago with the ask held roughly flat each time — persistent listings suggest the price (not the market) is what's stuck; bring a comps-based counter.
Risks & watch-outs
- Watch-outs: built in 1935 — expect roof / HVAC / electrical / plumbing capex.
- Climate carrying-cost: severe wind risk, 80% chance of damaging wind over 30y; major wildfire risk; extreme-heat days projected 7→21/yr by 2055 (HVAC capex compounding) — expect insurance premiums to compound above CPI over the hold.
Questions for the listing agent
- It's been on market 132 days. Have you received any prior offers? Is the seller open to a 12% concession, seller financing, or rate buy-down credit?
- Built in 1935 — when were the roof, HVAC, electrical panel, plumbing, and water heater last replaced?
- Why hasn't it sold? Are there any deal-killer items the seller is aware of (foundation, flood, title, zoning, code violations)?
- Is there a deadline driving the sale (1031 exchange, divorce, estate, relocation)? That informs how much negotiation room exists.
- Schools are D-rated, which usually means shorter tenancies and higher turnover. Who's the typical renter profile here, and what's been the actual vacancy rate?
- What's the average days-on-market for RENTAL listings here right now (not sales)? A rising rental-DOM trend means longer vacancies and softer asking-rent achievability than the comps imply.
- What's the recent tenant-quality profile in this submarket — average credit score on applications, eviction rate, late-payment / NSF rate, and stable-employment percentage? A property-management company in the area should have these aggregated.
- How much new for-sale + rental construction is in the pipeline within 1–3 miles? Heavy new supply typically softens prices + rents 12–24 months out; constrained supply supports both.
Investment metrics
- 1% rule
- 1.56% ✓
- Cap rate
- 11.94%
- Cash-on-cash
- 20.15%
- DSCR
- 1.90
- GRM
- 5.3
CMA / ARV
- ARV (median comp)
- $127,376
- List price
- $70,000
- Delta
- -45.04%
- Verdict
- UNDERPRICED
- Comps
- 2 within 1.0 mi
Projected returns pro-forma
-3.0% appreciation · 3.0% rent growth · sell at horizon
- IRR
- 12.4%
- Equity multiple
- 1.49×
- Total profit
- $9,669
- Equity at exit
- $10,437
- IRR
- 21.4%
- Equity multiple
- 2.82×
- Total profit
- $35,607
- Equity at exit
- $6,052
Cash invested: $19,600 (down + closing). Projections, not guarantees.
Landlord ↔ Tenant lean methodology
- Overall (STATE)
- 87 Strongly Landlord-Friendly
- State Texas
- 87 Strongly Landlord-Friendly · R+5
- County
- — inherits STATE
- City
- — inherits STATE
ZIP-level market 78644
- Home prices YoY
- -29.4%
- Active inventory
- 452
- Price-to-rent
- 5.3×
Monthly cashflow live
- Estimated rent
- $1,092 medium interval (Pro) →
- Mortgage (P&I)
- −$367
- Tax from tax record
- −$137 /mo · $1,649/yr
- Insurance
- −$29
- HOA
- −$0
- Vacancy / Maint / Mgmt
- −$229
- Net cashflow
- $329
Break-even live
UW: 25.0% down · 7.5% · 30yr · 1.5% tax · 5.0% vac · 8.0% maint · 8.0% mgmt
Financing live
Cash to close
- Down payment
- $17,500
- Closing costs
- $2,100
- Reserves months
- —
- Total cash needed
- —
Loan-product check · same deal, 3 products live
Conventional
25% down · 7.5% · 30yr
- Down + closing
- —
- Monthly P&I
- —
- Monthly cashflow
- —
- DSCR
- —
- Eligible?
- —
Personal DTI + credit; lowest rate.
DSCR
20% down · 8.5% · 30yr
- Down + closing
- —
- Monthly P&I
- —
- Monthly cashflow
- —
- DSCR
- —
- Eligible?
- —
No personal income docs; deal must DSCR.
Hard money
10% down · 12.0% · 12mo
- Down + closing
- —
- Monthly P&I
- —
- Monthly cashflow
- —
- DSCR
- —
- Eligible?
- —
Short-term bridge; refi at stabilization.
Listing history 21 events
-
2026-06-18days on market $70,000 Active 132 DOM
-
2026-06-17days on market $70,000 Active 131 DOM
-
2026-06-16days on market $70,000 Active 130 DOM
-
2026-06-15days on market $70,000 Active 129 DOM
-
2026-06-13days on market $70,000 Active 127 DOM
-
2026-06-09days on market $70,000 Active 123 DOM
-
2026-06-08days on market $70,000 Active 122 DOM
-
2026-06-07days on market $70,000 Active 121 DOM
-
2026-06-04days on market $70,000 Active 118 DOM
-
2026-06-03days on market $70,000 Active 117 DOM
-
2026-06-02days on market $70,000 Active 116 DOM
-
2026-06-01days on market $70,000 Active 115 DOM
-
2026-05-31days on market $70,000 Active 114 DOM
-
2026-02-06$70,000 Active 778-char remark
Show marketing remark (778 chars)
Affordable Fixer-Upper Opportunity in Lockhart Priced to sell. This is a rare chance to own and personalize a starter home or investment property in the heart of Lockhart. This single-family home offers 1 bedroom and 1 full bathroom in approximately 400+ square feet of interior space on a generous 4,600 square foot lot. The owner has begun remodeling, so this property is ideal for a buyer with vision looking to complete the project and add value. Bring your design ideas and take advantage of the affordable price point — perfect for first-time buyers, investors, or anyone looking for a manageable rehab project in a market with strong demand. Conveniently located near local amenities and within easy reach of downtown Lockhart, this home delivers endless potential.
-
2025-06-16status Active
-
2025-04-24soldstatus
-
2024-07-17status Pending
-
2024-07-17status Pending
-
2024-07-03historical
-
2024-06-28Active
-
2024-06-28$85,000 Active
ⓘ Source: listings_history table (triggers on properties + properties_extension) + one-shot
backfill from property_details.listing_events for pre-trigger history.
Tax reassessment forecast TX · Resets to sale price
- Current annual tax
- $1,649 · $137/mo
- Projected year-2 tax
- $1,649 · $137/mo
- Expected delta
- $0/yr ($0/mo · -0.0%)
ⓘ Screening estimate from a state-policy table — verify with the county assessor before closing.
Climate risk First Street
- Flood 1/10 Low FEMA zone X (unshaded) · 0% chance over 30 yrs
- Wildfire 6/10 Major
- Heat 8/10 Severe 7 d/yr ≥108°F today · 21 d/yr by 30 yrs out
- Wind 8/10 Severe 80% chance of damaging wind over 30 yrs
- Air quality 1/10 Low 0 unhealthy d/yr today · 0 by 30 yrs out
Nearby sold comps map
Loading sold comps map…
Walkable amenities ~0.75 mi
Loading nearby amenities…
Taxation est. · year 1
- Rental income
- $13,106
- − Mortgage interest
- −$3,921
- − Property taxes
- −$1,649
- − Insurance
- −$350
- − Repairs & maintenance
- −$1,048
- − Management
- −$1,048
- − Depreciation
- −$2,036
- Taxable income
- $3,053
- Est. tax owed @ 24.0%
- −$733
- After-tax cash flow
- $3,217/yr
For passive investors: Depreciation is non-cash, so a rental often shows a tax loss while cash-flowing — sheltering income. Rental losses are passive: they offset passive income freely, and up to $25,000/yr can offset ordinary (W-2) income if you actively participate and your MAGI is under $100k (phasing out to $0 by $150k); unused losses carry forward. On sale, claimed depreciation is recaptured at up to 25%, and gains may owe capital-gains tax (a 1031 exchange can defer both). Figures are a year-1 estimate at your 24.0% rate — not tax advice; consult a CPA.
Schools (NCES district)
- District
- Lockhart ISD
- NCES district ID
- 4827870
- Math proficiency
- 27% ▼ -12.00%
- Reading proficiency
- 29% ▼ -2.00%
- Median HH income
- $48,868
- Composite
- 24.44/100
- National rank
- #7674
- State rank
- #657 of 826 in TX
Livability — Lockhart
- Score
- 67/100
- State rank
- #535
- US rank
- #10453
Category grades
Schools grade is shown separately in the Schools card above.
Census & demographics
- Census place
- Lockhart, TX
- County
- Caldwell County · 25,195 people
- City population
- 22,348
- Metro
- Austin-Round Rock-Georgetown, TX
- Population (ZIP)
- 22,348
- Household income
- $74,709
- Rent vs Own
- Severe rent burden
- 324.0
Population outlook (Caldwell County) Hauer SSP2
- Today (2025)
- 46,557 people
- By 2030
- 49,673 · +6.7%
- By 2040
- 55,827 · +19.9%
- By 2050
- 61,832 · +32.8%
- By 2075
- 77,212 · +65.8%
- By 2100
- 89,225 · +91.6%
Race, ethnicity, and origin ACS 2023
- Neighborhood character
- Diverse neighborhood (Simpson 0.57)
- Race & ethnicity
- Hispanic / Latino 52% White 39% Two or more races 23% Black 4% Asian 1%
- Hispanic origin (detail)
- Mexican 45% Puerto Rican 2%
- Common ancestry
- Italian 1% Lithuanian 1% Serbian 1%
- Foreign-born
- 9% · Canada
- Languages at home
- 67% English-only · Spanish 32%
Political lean MEDSL · Caldwell
- 2024 margin
- R (+14.4) · D 42.2% · R 56.6% · Other 1.2%
- 2008→2024 swing
- -8.4pp toward R · 2008: -6.0pp · 2024: -14.4pp
- All cycles
- 2024: R+14.4 2020: R+9.1 2016: R+15.8 2012: R+11.1 2008: R+6.0
Not yet ingested
- Civics
- —
Market trends
- HPI YoY
- ▼ -99.62%
- Current HPI
- 239.7906
- Rent YoY
- —
- Metro
- Austin-Round Rock-Georgetown, TX
- State GDP YoY
- ▲ 3.95%
- F500 in state
- 110
Industry mix (Fortune 500 HQ in TX)
| Industry | F500 HQs | Revenue |
|---|---|---|
| Energy | 16 | $1,198B |
|
||
| Technology | 5 | $198B |
|
||
| Engineering / Construction | 4 | $72B |
|
||
| Energy Services | 3 | $60B |
|
||
| Utilities | 3 | $41B |
|
||
| Healthcare | 2 | $330B |
|
||
Price history
-17.6% since first listed8 events — show timeline
- 2026-02-06 Listed $70,000 Unlock MLS
- 2025-06-16 Relisted — Unlock MLS
- 2025-04-24 Sold (Public Records) — Public Records
- 2024-07-17 Pending — CTXMLS
- 2024-07-17 Pending — Unlock MLS
- 2024-07-03 Listing Removed — CTXMLS
- 2024-06-28 Listed $85,000 CTXMLS
- 2024-06-28 Listed — Unlock MLS
Property tax history
+9.9%/yrLatest (2025): $1,649 · +12.0% YoY. Source: county tax records.
Cash-flow waterfall
monthlySold comps — $/sqft
last 12 mo · ≤1 miLoading sold comps…