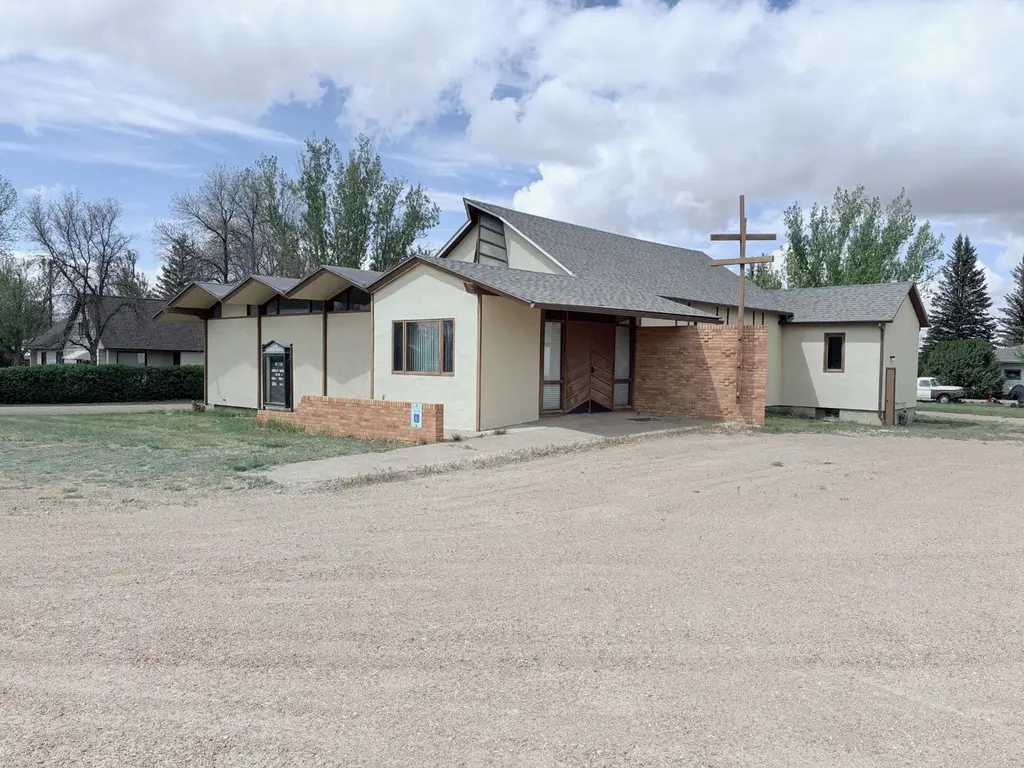
209 1st St · Hingham, MT
Flood risk 1/10 · Minimal
- FEMA flood zone
- —
- Chance of flooding over 30 yrs
- 0.0%
- Est. flood insurance / yr
- —
Fire risk 1/10 · Minimal
- Est. fire insurance / yr
- $918 – $1,706
Heat risk 2/10 · Minimal
- Hot days now (above 93°F)
- 7 days/yr
- Hot days in 30 yrs
- 13 days/yr
Wind risk 1/10 · Minimal
- Chance of severe wind over 30 yrs
- —
Air-quality risk 5/10 · Moderate
- Unhealthy air days now
- 8 days/yr
- Unhealthy air days in 30 yrs
- 8 days/yr
Risk factors via First Street. Map © Google.
Why this score? — see what drove the C grade
The composite is a weighted blend of 9 inputs, each scored 0–100. Each bar is that input's sub-score; the figure is the points it added to the 100-point composite (weight × sub-score).
- Cash flow +20.7/30.0
- ARV discount +7.5/15.0
- DSCR +6.6/10.0
- 1% rule +5.5/10.0
- Appreciation +5.0/10.0
- Schools +3.8/10.0
- Livability +3.1/5.0
- Condition / age +2.8/5.0
- Rent growth +2.5/5.0
$125,000
🖨 Deal sheet 📄 Offer letter ✓ Due diligence
Key facts
- Half acre lot
- Large lobby area
- Assembly hall
Tags
Property features AI
Exterior
- Home design: Single-family residence; Residential property
- Construction: Partially finished basement (concrete)
- Exterior features: Asphalt roof; Lot dimensions approximately 150' x 140'
Interior
- Kitchen: Range; Refrigerator
- Bathrooms: Three half bathrooms
- Heating & cooling: Forced air heating
- Interior features: Range; Refrigerator; Partially finished concrete basement; Forced air heating
Neighborhood map
What this means for you Summary
Snapshot
- This is a 3-bed/1.5-bath single-family listed at $125k. Condition is rated average.
Deal economics
- At list price, monthly cash flow is $170 ($2k/yr) — positive.
- The deal already cash-flows at list — no discount required.
- Meets the 1% rule at list price ($1k rent vs $125k).
- Recommended offer: $123k (1.5% below list) — sets the bar for market timing.
Location & tenants
- Location reads 61/100 on livability (#202 in MT) — a middle-class / working-renter tenant base. Strengths: cost of living A+, housing A+; Watch: health & safety C-, employment D, schools F.
- North Star Elementary (rural): math 40% / reading 45% proficiency, ranked #126 of 339 in MT (top 37%) — families likely to look elsewhere, expect single-tenant / working-renter base with shorter leases.
- Market conditions: 3 active listings in the ZIP; 1 units permitted in Hill County in 2024 (0 in 5+ unit buildings).
Forward outlook
- In year one you build about $5k of equity ($864 loan paydown + $4k appreciation (3.0% local appreciation)).
- At projected returns (3.0% appreciation + 3.0% rent growth), your $35k cash investment doubles in ~5 years — after that, you're playing with house money.
- By year 8, paydown + projected appreciation supports a ~$34k cash-out refi (75% LTV) — recoverable capital for the next deal without selling this one.
Negotiation context
- It's been on market 22 days — a 2% lower offer ($123k) is reasonable based on typical stale-listing flexibility.
Risks & watch-outs
- Watch-outs: built in 1917 — expect roof / HVAC / electrical / plumbing capex.
Questions for the listing agent
- Built in 1917 — when were the roof, HVAC, electrical panel, plumbing, and water heater last replaced?
- Is there a deadline driving the sale (1031 exchange, divorce, estate, relocation)? That informs how much negotiation room exists.
- Schools are F-rated, which usually means shorter tenancies and higher turnover. Who's the typical renter profile here, and what's been the actual vacancy rate?
- Crime grade is F in this area — have there been break-ins, vandalism, or insurance claims at this property in the last 3 years? What carrier currently insures it and at what premium?
- What's the average days-on-market for RENTAL listings here right now (not sales)? A rising rental-DOM trend means longer vacancies and softer asking-rent achievability than the comps imply.
- What's the recent tenant-quality profile in this submarket — average credit score on applications, eviction rate, late-payment / NSF rate, and stable-employment percentage? A property-management company in the area should have these aggregated.
- How much new for-sale + rental construction is in the pipeline within 1–3 miles? Heavy new supply typically softens prices + rents 12–24 months out; constrained supply supports both.
Investment metrics
- 1% rule
- 1.05% ✓
- Cap rate
- 7.93%
- Cash-on-cash
- 5.84%
- DSCR
- 1.26
- GRM
- 8.0
CMA / ARV
No comps found within radius.
Projected returns pro-forma
3.0% appreciation · 3.0% rent growth · sell at horizon
- IRR
- 13.0%
- Equity multiple
- 1.74×
- Total profit
- $25,923
- Equity at exit
- $56,205
- IRR
- 14.9%
- Equity multiple
- 3.20×
- Total profit
- $77,132
- Equity at exit
- $86,619
Cash invested: $35,000 (down + closing). Projections, not guarantees.
Landlord ↔ Tenant lean methodology
- Overall (STATE)
- 82 Strongly Landlord-Friendly
- State Montana
- 82 Strongly Landlord-Friendly · R+11
- County
- — inherits STATE
- City
- — inherits STATE
ZIP-level market 59528
- Active inventory
- 3
- Price-to-rent
- 8.0×
Monthly cashflow live
- Estimated rent
- $1,309 medium interval (Pro) →
- Mortgage (P&I)
- −$656
- Tax est. 1.5%
- −$156 /mo · $1,875/yr
- Insurance
- −$52
- HOA
- −$0
- Vacancy / Maint / Mgmt
- −$275
- Net cashflow
- $170
Break-even live
UW: 25.0% down · 7.5% · 30yr · 1.5% tax · 5.0% vac · 8.0% maint · 8.0% mgmt
Financing live
Cash to close
- Down payment
- $31,250
- Closing costs
- $3,750
- Reserves months
- —
- Total cash needed
- —
Loan-product check · same deal, 3 products live
Conventional
25% down · 7.5% · 30yr
- Down + closing
- —
- Monthly P&I
- —
- Monthly cashflow
- —
- DSCR
- —
- Eligible?
- —
Personal DTI + credit; lowest rate.
DSCR
20% down · 8.5% · 30yr
- Down + closing
- —
- Monthly P&I
- —
- Monthly cashflow
- —
- DSCR
- —
- Eligible?
- —
No personal income docs; deal must DSCR.
Hard money
10% down · 12.0% · 12mo
- Down + closing
- —
- Monthly P&I
- —
- Monthly cashflow
- —
- DSCR
- —
- Eligible?
- —
Short-term bridge; refi at stabilization.
Listing history 12 events
-
2026-06-13statusdays on market $125,000 Pending 22 DOM
-
2026-06-10days on market $125,000 Active 20 DOM
-
2026-06-09days on market $125,000 Active 19 DOM
-
2026-06-08days on market $125,000 Active 18 DOM
-
2026-06-07days on market $125,000 Active 17 DOM
-
2026-06-05days on market $125,000 Active 14 DOM
-
2026-06-03days on market $125,000 Active 13 DOM
-
2026-06-02days on market $125,000 Active 12 DOM
-
2026-06-01days on market $125,000 Active 11 DOM
-
2026-05-31days on market $125,000 Active 10 DOM
-
2026-05-31days on market $125,000 Active 9 DOM
-
2026-05-21$125,000 Active
ⓘ Source: listings_history table (triggers on properties + properties_extension) + one-shot
backfill from property_details.listing_events for pre-trigger history.
Climate risk First Street
- Flood 1/10 Low 0% chance over 30 yrs
- Wildfire 1/10 Low
- Heat 2/10 Low 7 d/yr ≥93°F today · 13 d/yr by 30 yrs out
- Wind 1/10 Low
- Air quality 5/10 Major 8 unhealthy d/yr today · 8 by 30 yrs out
Nearby sold comps map
Loading sold comps map…
Walkable amenities ~0.75 mi
Loading nearby amenities…
Taxation est. · year 1
- Rental income
- $15,708
- − Mortgage interest
- −$7,002
- − Property taxes
- −$1,875
- − Insurance
- −$625
- − Repairs & maintenance
- −$1,257
- − Management
- −$1,257
- − Depreciation
- −$3,636
- Taxable income
- $57
- Est. tax owed @ 24.0%
- −$14
- After-tax cash flow
- $2,030/yr
For passive investors: Depreciation is non-cash, so a rental often shows a tax loss while cash-flowing — sheltering income. Rental losses are passive: they offset passive income freely, and up to $25,000/yr can offset ordinary (W-2) income if you actively participate and your MAGI is under $100k (phasing out to $0 by $150k); unused losses carry forward. On sale, claimed depreciation is recaptured at up to 25%, and gains may owe capital-gains tax (a 1031 exchange can defer both). Figures are a year-1 estimate at your 24.0% rate — not tax advice; consult a CPA.
Condition & rehab AI · 13 photos
The property shows average condition with minor repairs needed, primarily in the form of painting and flooring. Fresh paint and new flooring can significantly enhance its resale value.
Repairs flagged
- Minor Paint — Paint appears faded in some areas
- Minor Flooring — Flooring shows some wear
Value-add opportunities
- Resale Paint — Fresh paint can enhance curb appeal and interior aesthetics
- Resale Flooring — New flooring can improve the home's appearance and functionality
Renovation cost estimate screening
| Repair item | Severity | Est. cost |
|---|---|---|
| Paint · Paint appears faded in some areas | Minor | $500–3,000 |
| Flooring · Flooring shows some wear | Minor | $500–3,000 |
| Total estimated repair cost · 2 items | $1,000–6,000 |
Value-add ROI direction
- Resale Paint — Fresh paint can enhance curb appeal and interior aesthetics ↑
- Resale Flooring — New flooring can improve the home's appearance and functionality ↑
ⓘ Cost ranges are severity-bucket heuristics (US national rule-of-thumb). Get contractor quotes + a written scope before underwriting a rehab budget.
Schools (NCES district)
- District
- North Star Elementary
- NCES district ID
- 3000096
- Math proficiency
- 40% ▬ 0.00%
- Reading proficiency
- 45% ▼ -5.00%
- Median HH income
- $43,473
- Composite
- 38.26/100
- National rank
- #8558
- State rank
- #126 of 339 in MT
Livability — Hingham
- Score
- 61/100
- State rank
- #202
- US rank
- #18120
Category grades
Schools grade is shown separately in the Schools card above.
Census & demographics
- Census place
- Hingham, MT
- Population (ZIP)
- 232
Population outlook (Hill County) Hauer SSP2
- Today (2025)
- 16,841 people
- By 2030
- 16,954 · +0.7%
- By 2040
- 17,063 · +1.3%
- By 2050
- 17,130 · +1.7%
- By 2075
- 17,273 · +2.6%
- By 2100
- 16,542 · -1.8%
Race, ethnicity, and origin ACS 2023
- Neighborhood character
- Predominantly White (96%)
- Race & ethnicity
- White 96% Two or more races 3% Native American 1%
- Common ancestry
- Iranian 23% Portuguese 9% German 2%
- Foreign-born
- 2%
Political lean MEDSL · Hill
- 2024 margin
- R (+18.2) · D 38.7% · R 56.9% · Other 4.4%
- 2008→2024 swing
- -30.4pp toward R · 2008: 12.2pp · 2024: -18.2pp
- All cycles
- 2024: R+18.2 2020: R+13.6 2016: R+17.3 2012: D+3.5 2008: D+12.2
Not yet ingested
- Civics
- —
Market trends
- HPI YoY
- —
- Current HPI
- —
- Rent YoY
- —
- Metro
- —
- State GDP YoY
- ▲ 3.41%
- F500 in state
- 2
Industry mix (Fortune 500 HQ in MT)
| Industry | F500 HQs | Revenue |
|---|---|---|
| Technology / Analytics | 1 | $2B |
|
||
Price history
1 event — show timeline
- 2026-05-21 Listed $125,000 MRMLS
Cash-flow waterfall
monthlySold comps — $/sqft
last 12 mo · ≤1 miLoading sold comps…