 Duplex
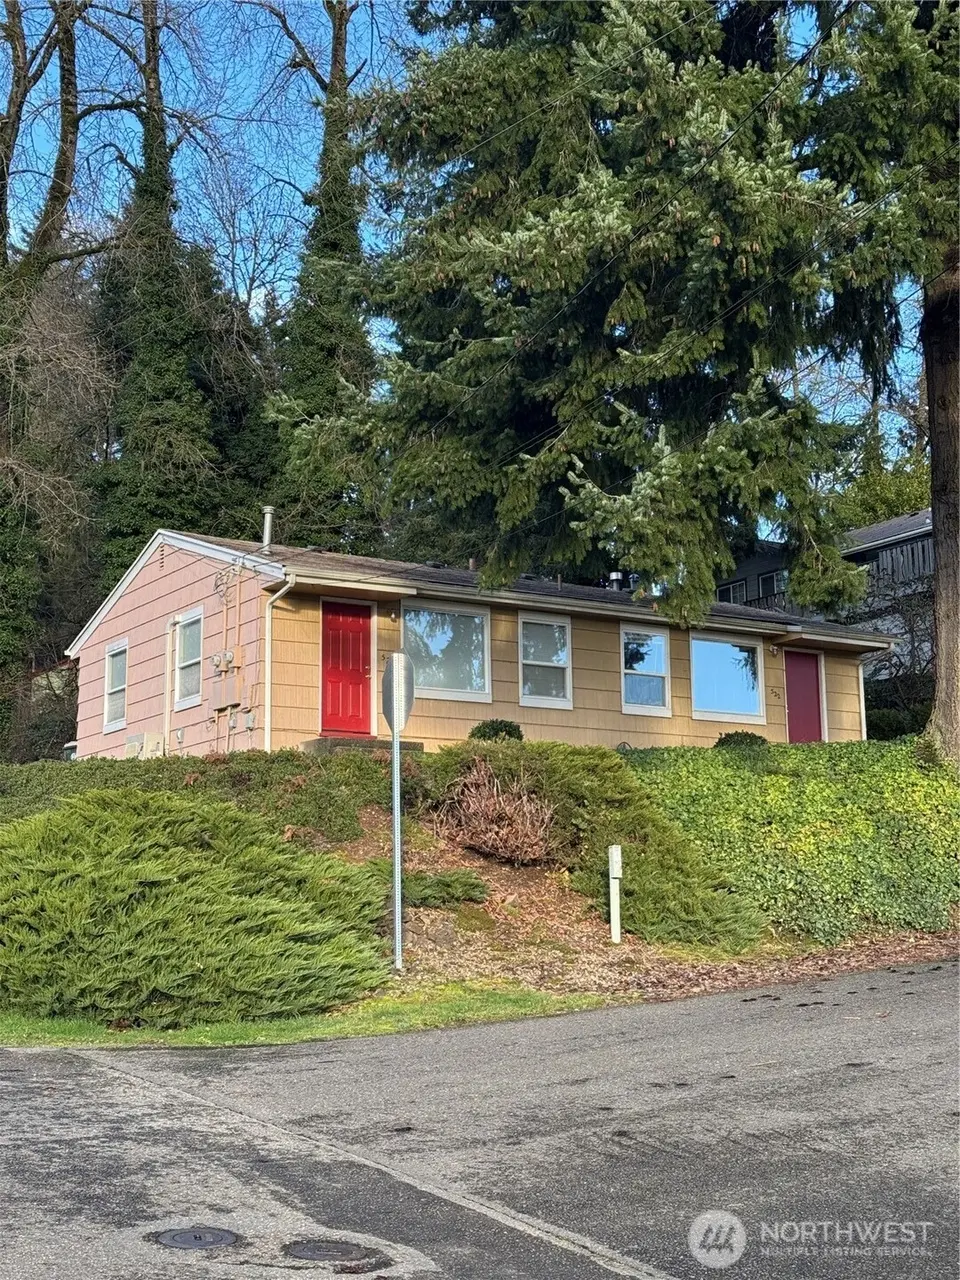
522 H St SW · Tumwater, WA
Flood risk No data
- FEMA flood zone
- —
- Chance of flooding over 30 yrs
- —
- Est. flood insurance / yr
- —
Fire risk No data
- Est. fire insurance / yr
- —
Heat risk No data
- Hot days now (above threshold)
- —
- Hot days in 30 yrs
- —
Wind risk No data
- Chance of severe wind over 30 yrs
- —
Air-quality risk No data
- Unhealthy air days now
- —
- Unhealthy air days in 30 yrs
- —
Risk factors via First Street. Map © Google.
Why this score? — see what drove the C- grade
The composite is a weighted blend of 9 inputs, each scored 0–100. Each bar is that input's sub-score; the figure is the points it added to the 100-point composite (weight × sub-score).
- Cash flow +15.1/30.0
- ARV discount +13.4/15.0
- Schools +5.6/10.0
- DSCR +4.6/10.0
- Livability +4.2/5.0
- 1% rule +3.6/10.0
- Rent growth +3.1/5.0
- Condition / age +2.5/5.0
- Appreciation +0.0/10.0
$409,900
🖨 Deal sheet 📄 Offer letter ✓ Due diligence
Multi-family units
County records classify this as Multi-Family (2-4 Unit). Listing-text estimate: 2 units. confirmed
Listing remarks
Great investment opportunity from a well maintained duplex with additional assigned parking (6 total). Big 7500 sqft corner lot with potential for additional units and spectacular city and territorial views. Low maintenance yards for easy upkeep. Hardwood flooring in both units keeping maintenance and repair cost down. Newer Mini ductless split in vacant unit providing AC & Heat for better rent. Unit 524 is vacant for a great owner occupied opportunity and comfort. Common area utility room with washer & dryer. Cap rate based on 2024 tax return, current cap rate potential much higher. Conveniently located on Tumwater Hill with quick access to I-5, HWY 101, JBLM, schools, shopping
Key facts
- City views
- Assigned parking
- Corner lot
Tags
Neighborhood map
What this means for you Summary
Snapshot
- This is a 2 × 2-bed/1.0-bath units multifamily listed at $410k.
Deal economics
- At list price, monthly cash flow is $138 ($2k/yr) — positive. Per door: $69/mo.
- The deal already cash-flows at list — no discount required.
- To meet the 1% rule (rent ≥ 1% of price), the offer needs to be $352k (14.1% below list).
- Recommended offer: $352k (14.1% below list) — sets the bar for 1% rule.
- Cap rate 6.7% vs local median 2.7% in Tumwater — top-decile yield for the area; either an underpriced asset or a hidden risk that comps aren't pricing in. Stress-test before assuming the spread holds.
Location & tenants
- Location reads 84/100 on livability (#39 in WA, #700 nationally) — a professional / high-income tenant draw. Strengths: commute A+, housing A+, health & safety A+; Watch: amenities D, cost of living D-.
- Tumwater School District (urban): math 57% / reading 69% proficiency, ranked #37 of 291 in WA (top 13%) — acceptable for families but not a draw, mixed tenant base, ~2y average lease.
- Market conditions: Rents rising (+2.3%/yr); 233 active listings in the ZIP; 28 comparable units currently listed for rent nearby; rentals at typical pace (median 21d on market — plan ~3-4 weeks tenant-placement turnaround); solid renter incomes; 1,222 units permitted in Thurston County in 2024 (508 in 5+ unit buildings).
- This rent runs 42% of the median local income ($102k/yr) — at the standard rent-burdened threshold; future hikes will face affordability resistance.
Forward outlook
- Local home prices are declining (-3.0%/yr); year-one equity from $3k of loan paydown is wiped out by about $12k of value loss. Plan a longer hold.
- Thurston County population projected at +27% by 2050 — long-run rental-demand tailwind backs the buy-and-hold thesis.
Negotiation context
- It's been on market 150 days — a 12% lower offer ($361k) is reasonable based on typical stale-listing flexibility.
- 2 sale attempts with the ask held roughly flat each time — persistent listings suggest the price (not the market) is what's stuck; bring a comps-based counter.
- Current owner paid $180k; list at $410k implies a 128% gain — meaningful room to come down on a strong offer.
Risks & watch-outs
- Watch-outs: built in 1950 — expect roof / HVAC / electrical / plumbing capex.
Questions for the listing agent
- It's been on market 150 days. Have you received any prior offers? Is the seller open to a 14% concession, seller financing, or rate buy-down credit?
- Can we see the unit-by-unit rent roll, current vacancy, and any below-market leases? What's the average tenancy length?
- What capital expenditures (roof, boiler, parking lot, exteriors) have been made in the last 5 years, and what's planned in the next 2?
- Built in 1950 — when were the roof, HVAC, electrical panel, plumbing, and water heater last replaced?
- Why hasn't it sold? Are there any deal-killer items the seller is aware of (foundation, flood, title, zoning, code violations)?
- Is there a deadline driving the sale (1031 exchange, divorce, estate, relocation)? That informs how much negotiation room exists.
- Schools are A-rated — typically a magnet for longer-tenancy family renters. What's the average tenant stay here, and is there a school-zone premium baked into asking?
- What's the average days-on-market for RENTAL listings here right now (not sales)? A rising rental-DOM trend means longer vacancies and softer asking-rent achievability than the comps imply.
- What's the recent tenant-quality profile in this submarket — average credit score on applications, eviction rate, late-payment / NSF rate, and stable-employment percentage? A property-management company in the area should have these aggregated.
- How much new apartment / multifamily construction is in the pipeline within 1–3 miles? Heavy new supply (>2% of stock underway) typically softens rents 12–24 months out; light construction supports rent growth.
Investment metrics
- 1% rule
- 0.86% ✗
- Cap rate
- 6.70%
- Cash-on-cash
- 1.45%
- DSCR
- 1.06
- GRM
- 9.7
CMA / ARV
- ARV (median comp)
- $471,703
- List price
- $409,900
- Delta
- -13.10%
- Verdict
- UNDERPRICED
- Comps
- 3 within 2.0 mi
Projected returns pro-forma
-3.0% appreciation · 2.26% rent growth · sell at horizon
- IRR
- -14.8%
- Equity multiple
- 0.47×
- Total profit
- $-60,267
- Equity at exit
- $61,117
- IRR
- -7.4%
- Equity multiple
- 0.55×
- Total profit
- $-51,902
- Equity at exit
- $35,441
Cash invested: $114,772 (down + closing). Projections, not guarantees.
Landlord ↔ Tenant lean methodology
- Overall (STATE)
- 28 Tenant-Leaning
- State Washington
- 28 Tenant-Leaning · D+8
- County
- — inherits STATE
- City
- — inherits STATE
ZIP-level market 98512
- Rents YoY
- 2.3%
- Active inventory
- 233
- Price-to-rent
- 19.4×
Monthly cashflow live
- Estimated rent
- $3,522 high interval (Pro) →
- Mortgage (P&I)
- −$2,150
- Tax from tax record
- −$324 /mo · $3,882/yr
- Insurance
- −$171
- HOA
- −$0
- Vacancy / Maint / Mgmt
- −$740
- Net cashflow
- $138
Break-even live
2-unit breakdown (identical units grouped — click to expand)
| Units | Beds | Baths | Est. rent |
|---|---|---|---|
| 2× units | 2 | 1 | $3,522 |
| #1 | 2 | 1 | $1,761 |
| #2 | 2 | 1 | $1,761 |
| Total (2 units) | $3,522 | ||
UW: 25.0% down · 7.5% · 30yr · 1.5% tax · 5.0% vac · 8.0% maint · 8.0% mgmt
Financing live
Cash to close
- Down payment
- $102,475
- Closing costs
- $12,297
- Reserves months
- —
- Total cash needed
- —
Loan-product check · same deal, 3 products live
Conventional
25% down · 7.5% · 30yr
- Down + closing
- —
- Monthly P&I
- —
- Monthly cashflow
- —
- DSCR
- —
- Eligible?
- —
Personal DTI + credit; lowest rate.
DSCR
20% down · 8.5% · 30yr
- Down + closing
- —
- Monthly P&I
- —
- Monthly cashflow
- —
- DSCR
- —
- Eligible?
- —
No personal income docs; deal must DSCR.
Hard money
10% down · 12.0% · 12mo
- Down + closing
- —
- Monthly P&I
- —
- Monthly cashflow
- —
- DSCR
- —
- Eligible?
- —
Short-term bridge; refi at stabilization.
Rent comps 28 comps
| Address | Beds | Baths | Sqft | Rent | $/sqft | DOM | Units | Dist |
|---|---|---|---|---|---|---|---|---|
| 811 S 3rd Ave SW Unit B Tumwater, WA | 3.0 | 2.0 | 1336 | $2,300 | $1.72 | 43d | 1 | 0.12mi |
| 1500 Lake Park Dr SW #29 Tumwater, WA | 2.0 | 1.5 | 1428 | $1,850 | $1.30 | 21d | 1 | 0.57mi |
| 1704 Barnes Blvd SW Tumwater, WA | 1.0–3.0 | 1.0–2.5 | 920 | $2,004 | $2.18 | 13d | 35 | 0.65mi |
| 512 N 4th Ave SW Tumwater, WA | 3.0 | 2.0 | 1232 | $2,095 | $1.70 | 43d | 1 | 0.72mi |
| 4822 Rural Rd SW Tumwater, WA | 2.0 | 2.0 | 1025 | $1,995 | $1.95 | 21d | 1 | 0.78mi |
| 1992 Ridgeview Loop SW Unit 204 Tumwater, WA | 2.0 | 1.0 | 804 | $1,700 | $2.11 | 21d | 1 | 0.80mi |
| 520 Primrose Ln SE Tumwater, WA | 3.0 | 1.5 | 1050 | $2,200 | $2.10 | 43d | 1 | 0.81mi |
| 1255 Bay Loop SW Tumwater, WA | 2.0 | 1.0 | 975 | $2,400 | $2.46 | 43d | 1 | 0.86mi |
| 1619 Trosper Rd SW Tumwater, WA | 3.0 | 2.5 | 1295 | $2,495 | $1.93 | 21d | 1 | 0.88mi |
| 301 T St SW Tumwater, WA | 2.0 | 1.0 | 589 | $1,635 | $2.78 | 13d | 5 | 0.89mi |
| 1978 Trosper Rd SW Tumwater, WA | 1.0–3.0 | 1.0–2.0 | 1106 | $2,246 | $2.03 | 13d | 4 | 0.91mi |
| 1978 Trosper Rd SW Tumwater, WA | 1.0–3.0 | 1.0–2.0 | 1050 | $2,428 | $2.31 | 43d | 3 | 0.91mi |
| 215 Pinehurst Dr SW Tumwater, WA | 2.0 | 1.0–2.5 | 759 | $1,950 | $2.57 | 13d | 4 | 0.94mi |
| 2820 Tuscany Ln SW Unit 714 Tumwater, WA | 2.0 | 2.0 | 1030 | $1,725 | $1.67 | 21d | 1 | 1.05mi |
| 2820 Tuscany Ln SW Tumwater, WA | 1.0–2.0 | 1.0–2.0 | 915 | $1,775 | $1.94 | 13d | 8 | 1.05mi |
| 2820 Tuscany Ln SW Unit 411 Tumwater, WA | 2.0 | 1.0 | 915 | $1,635 | $1.79 | 43d | 1 | 1.05mi |
| 1221 Mottman Rd SW Olympia, WA | 1.0–3.0 | 1.0–2.0 | 1011 | $1,948 | $1.93 | 21d | 4 | 1.10mi |
| 151 Cherry Ln SE Tumwater, WA | 3.0 | 1.0 | 874 | $2,195 | $2.51 | 21d | 1 | 1.10mi |
| 214 65th Way SW Tumwater, WA | 2.0 | 1.0 | 1000 | $1,850 | $1.85 | 21d | 1 | 1.26mi |
| 6504 Capitol Blvd SE Tumwater, WA | 1.0 | 1.0 | 974 | $2,125 | $2.18 | 13d | 1 | 1.30mi |
| 4523 Briggs Dr SE Olympia, WA | 1.0–2.0 | 1.0–2.0 | 935 | $2,127 | $2.27 | 13d | 7 | 1.32mi |
| 2121 Evergreen Park Dr SW Unit 48 Olympia, WA | 2.0 | 1.0 | 850 | $1,525 | $1.79 | 44d | 1 | 1.35mi |
| 4530 Briggs Dr SE Olympia, WA | 1.0–3.0 | 1.0–2.0 | 966 | $2,012 | $2.08 | 13d | 5 | 1.36mi |
| 1415 Evergreen Park Dr SW Olympia, WA | 2.0 | 2.0 | 1050 | $1,735 | $1.65 | 13d | 1 | 1.38mi |
| 1517 Bishop Rd SW Tumwater, WA | 2.0 | 1.0–2.0 | 669 | $1,930 | $2.88 | 13d | 1 | 1.46mi |
| 2008 Evergreen Park Dr SW Olympia, WA | 1.0–2.0 | 1.0 | 750 | $1,799 | $2.40 | 43d | 3 | 1.48mi |
| 6705 Linderson Way SW Tumwater, WA | 1.0–3.0 | 1.0–2.0 | 900 | $2,038 | $2.26 | 13d | 6 | 1.48mi |
| 1221 Evergreen Park Dr SW Olympia, WA | 2.0 | 1.0 | 880 | $1,749 | $1.99 | 13d | 2 | 1.49mi |
Listing history 16 events
-
2026-06-13statusdays on market $409,900 Pending 150 DOM
-
2026-06-10days on market $409,900 Active 148 DOM
-
2026-06-09days on market $409,900 Active 147 DOM
-
2026-06-08days on market $409,900 Active 146 DOM
-
2026-06-07days on market $409,900 Active 145 DOM
-
2026-06-05days on market $409,900 Active 142 DOM
-
2026-06-02days on market $409,900 Active 140 DOM
-
2026-06-01days on market $409,900 Active 139 DOM
-
2026-05-31days on market $409,900 Active 138 DOM
-
2026-05-30days on market $409,900 Active 137 DOM
-
2026-02-06status Active
-
2026-01-31status Pending
-
2026-01-07$409,900 Active
-
2006-11-15soldstatus $180,000
-
1998-09-09soldstatus $79,333
-
1990-07-09soldstatus $47,500
ⓘ Source: listings_history table (triggers on properties + properties_extension) + one-shot
backfill from property_details.listing_events for pre-trigger history.
Tax reassessment forecast WA · Resets to sale price
- Current annual tax
- $3,882 · $324/mo
- Projected year-2 tax
- $4,017 · $335/mo
- Expected delta
- +$135/yr (+$11/mo · 3.5%)
ⓘ Screening estimate from a state-policy table — verify with the county assessor before closing.
Nearby sold comps map
Loading sold comps map…
Walkable amenities ~0.75 mi
Loading nearby amenities…
Taxation est. · year 1
- Rental income
- $42,264
- − Mortgage interest
- −$22,961
- − Property taxes
- −$3,882
- − Insurance
- −$2,050
- − Repairs & maintenance
- −$3,381
- − Management
- −$3,381
- − Depreciation
- −$11,924
- Taxable loss
- −$5,315
- Est. tax savings @ 24.0%
- +$1,276
- After-tax cash flow
- $2,938/yr
For passive investors: Depreciation is non-cash, so a rental often shows a tax loss while cash-flowing — sheltering income. Rental losses are passive: they offset passive income freely, and up to $25,000/yr can offset ordinary (W-2) income if you actively participate and your MAGI is under $100k (phasing out to $0 by $150k); unused losses carry forward. On sale, claimed depreciation is recaptured at up to 25%, and gains may owe capital-gains tax (a 1031 exchange can defer both). Figures are a year-1 estimate at your 24.0% rate — not tax advice; consult a CPA.
Schools (NCES district)
- District
- Tumwater School District
- NCES district ID
- 5309100
- Math proficiency
- 57% ▬ 0.00%
- Reading proficiency
- 69% ▼ -1.00%
- Median HH income
- $64,209
- Composite
- 56.38/100
- National rank
- #2477
- State rank
- #37 of 291 in WA
Livability — Tumwater
- Score
- 84/100
- State rank
- #39
- US rank
- #700
Category grades
Schools grade is shown separately in the Schools card above.
Census & demographics
- Census place
- Tumwater, WA
- County
- Thurston County · 269,345 people
- City population
- 46,937
- Metro
- Olympia-Lacey-Tumwater, WA
- Population (ZIP)
- 31,864
- Household income
- $101,530
- Rent vs Own
- Severe rent burden
- 784.0
Population outlook (Thurston County) Hauer SSP2
- Today (2025)
- 308,239 people
- By 2030
- 326,483 · +5.9%
- By 2040
- 359,890 · +16.8%
- By 2050
- 391,800 · +27.1%
- By 2075
- 468,024 · +51.8%
- By 2100
- 519,890 · +68.7%
Race, ethnicity, and origin ACS 2023
- Neighborhood character
- Predominantly White (72%)
- Race & ethnicity
- White 72% Two or more races 13% Hispanic / Latino 9% Asian 4% Black 3% Native American 1%
- Hispanic origin (detail)
- Mexican 5%
- Common ancestry
- Portuguese 4% Italian 4% Slovak 4%
- Foreign-born
- 6% · Canada, Vietnam, China
- Languages at home
- 92% English-only · Spanish 3% Vietnamese 1% German/W. Germanic 1%
Political lean MEDSL · Thurston
- 2024 margin
- Strong D (+20.4) · D 58.5% · R 38.1% · Other 3.5%
- 2008→2024 swing
- -1.3pp toward R · 2008: 21.7pp · 2024: 20.4pp
- All cycles
- 2024: D+20.4 2020: D+18.6 2016: D+15.4 2012: D+19.0 2008: D+21.7
Not yet ingested
- Civics
- —
Market trends
- HPI YoY
- ▼ -348.18%
- Current HPI
- 347.121
- Rent YoY
- ▲ 2.26%
- Metro
- Olympia-Lacey-Tumwater, WA
- State GDP YoY
- ▲ 4.65%
- F500 in state
- 22
Industry mix (Fortune 500 HQ in WA)
| Industry | F500 HQs | Revenue |
|---|---|---|
| Retail | 2 | $269B |
|
||
| Technology / Retail | 1 | $638B |
|
||
| Technology | 1 | $245B |
|
||
| Telecommunications | 1 | $38B |
|
||
| Food / Beverage | 1 | $36B |
|
||
| Automotive / Trucks | 1 | $34B |
|
||
Price history
+762.9% since first listed6 events — show timeline
- 2026-02-06 Relisted — NWMLS as Distributed by MLS Grid
- 2026-01-31 Pending — NWMLS as Distributed by MLS Grid
- 2026-01-07 Listed $409,900 NWMLS as Distributed by MLS Grid
- 2006-11-15 Sold (Public Records) $180,000 Public Records
- 1998-09-09 Sold (Public Records) $79,333 Public Records
- 1990-07-09 Sold (Public Records) $47,500 Public Records
Property tax history
+5.9%/yrLatest (2026): $3,882 · +7.4% YoY. Source: county tax records.
Cash-flow waterfall
monthlySold comps — $/sqft
last 12 mo · ≤1 miLoading sold comps…