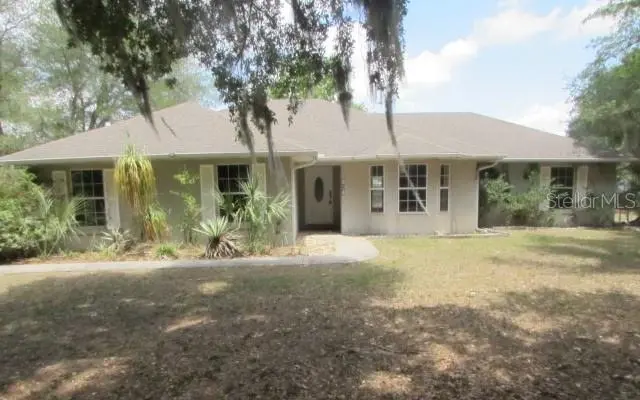
824 Berryhill Cir · Fruitland Park, FL
Flood risk 1/10 · Minimal
- FEMA flood zone
- X (unshaded)
- Chance of flooding over 30 yrs
- 0.0%
- Est. flood insurance / yr
- $507 – $1,088
Fire risk 3/10 · Minor
- Est. fire insurance / yr
- $947 – $1,759
Heat risk 8/10 · Major
- Hot days now (above 108°F)
- 7 days/yr
- Hot days in 30 yrs
- 22 days/yr
Wind risk 9/10 · Severe
- Chance of severe wind over 30 yrs
- 99.0%
Air-quality risk 3/10 · Minor
- Unhealthy air days now
- 2 days/yr
- Unhealthy air days in 30 yrs
- 4 days/yr
Risk factors via First Street. Map © Google.
Why this score? — see what drove the D grade
The composite is a weighted blend of 9 inputs, each scored 0–100. Each bar is that input's sub-score; the figure is the points it added to the 100-point composite (weight × sub-score).
- Cash flow +12.5/30.0
- ARV discount +8.9/15.0
- Schools +4.2/10.0
- DSCR +3.7/10.0
- Livability +3.5/5.0
- 1% rule +2.7/10.0
- Rent growth +2.5/5.0
- Condition / age +2.5/5.0
- Appreciation +0.0/10.0
$270,000
🖨 Deal sheet 📄 Offer letter ✓ Due diligence
Listing remarks
Lots of potential here! Great location; close to shopping, medical, restaurants, and The Villages. Nice quiet neighborhood. Home features open floorplan, eat in kitchen with breakfast bar, pantry and an abundance of cabinet and counter space. Spacious primary bedroom and bathroom with garden tub, walk-in shower and double sinks. Large back yard with privacy fence. No HOA. Needs TLC, but priced accordingly. With great potential and an excellent location, this home won't last long!
Key facts
- Pantry
- Great location
- Open floorplan
Tags
Property features AI
Finance
- Other: Zoned R-1; Lot approximately 0.36 acre (116 x 134); One lot; Living area 1,514 (public records); Building area total 2,388; Direction faces north; No homestead; no CDD
- HOA & community: No association indicated; Pets allowed
Exterior
- Parking: Attached 2-car garage (20 x 23)
- Utilities: Public water; Public sewer; Cable available; Electricity connected; Water connected
- Home design: Single family residence; Residential property; One-story; North-facing; Completed condition
- Construction: Block and stucco construction; Shingle roof; Slab foundation; Built with conventional materials
- Exterior features: French doors; Wood fencing; Cleared and paved lot; Paved road access
Interior
- Kitchen: Dishwasher; Range; Refrigerator
- Bedrooms: 3 bedrooms
- Flooring: Carpet; Tile
- Bathrooms: 2 full bathrooms
- Heating & cooling: Electric heating; Central air conditioning
- Interior features: Ceiling fans; Eat-in kitchen; Living room / dining room combo; Split bedroom floor plan; Walk-in closet(s)
- Laundry & utility: Laundry area in garage
Neighborhood map
What this means for you Summary
Snapshot
- This is a 3-bed/2.0-bath single-family listed at $270k.
Deal economics
- At list price, monthly cash flow is $-40 ($-477/yr) — negative.
- To cash-flow at today's rent, offer at most $263k (2.6% below list).
- To meet the 1% rule (rent ≥ 1% of price), the offer needs to be $208k (23.1% below list).
- Recommended offer: $208k (23.1% below list) — sets the bar for 1% rule.
- Cap rate 6.1% vs local median 4.0% in Fruitland Park — top-decile yield for the area; either an underpriced asset or a hidden risk that comps aren't pricing in. Stress-test before assuming the spread holds.
Location & tenants
- Location reads 70/100 on livability (#447 in FL) — a middle-class / working-renter tenant base. Strengths: housing A+, crime A, health & safety A-; Watch: schools D, amenities F, commute F.
- Lake (suburban): math 49% / reading 50% proficiency, ranked #37 of 73 in FL (top 51%) — families likely to look elsewhere, expect single-tenant / working-renter base with shorter leases.
- Market conditions: 165 active listings in the ZIP; 7 comparable units currently listed for rent nearby; rentals leasing fast (median 5d on market — plan ~1-2 weeks tenant-placement turnaround); 4,799 units permitted in Lake County in 2024 (814 in 5+ unit buildings).
- This rent runs 38% of the median local income ($66k/yr) — at the standard rent-burdened threshold; future hikes will face affordability resistance.
Forward outlook
- Local home prices are declining (-3.0%/yr); year-one equity from $2k of loan paydown is wiped out by about $8k of value loss. Plan a longer hold.
- Lake County population projected at +37% by 2050 — long-run rental-demand tailwind backs the buy-and-hold thesis.
Negotiation context
- It's been on market 27 days — a 2% lower offer ($266k) is reasonable based on typical stale-listing flexibility.
- 8 sale attempts since 21y ago with the ask held roughly flat each time — persistent listings suggest the price (not the market) is what's stuck; bring a comps-based counter.
- Current owner paid $179k; list at $270k implies a 51% gain — meaningful room to come down on a strong offer.
Risks & watch-outs
- Climate carrying-cost: severe wind risk, 99% chance of damaging wind over 30y; extreme-heat days projected 7→22/yr by 2055 (HVAC capex compounding) — expect insurance premiums to compound above CPI over the hold.
Questions for the listing agent
- What do current leases actually rent for vs. the listed asking? Can we see a recent rent roll and the last 12 months of T-12 income?
- Is there a deadline driving the sale (1031 exchange, divorce, estate, relocation)? That informs how much negotiation room exists.
- Schools are D-rated, which usually means shorter tenancies and higher turnover. Who's the typical renter profile here, and what's been the actual vacancy rate?
- The area grade is low — what's the realistic commute time and amenity access for the typical tenant pool here? Any planned neighborhood developments (good or bad) we should know about?
- What's the average days-on-market for RENTAL listings here right now (not sales)? A rising rental-DOM trend means longer vacancies and softer asking-rent achievability than the comps imply.
- What's the recent tenant-quality profile in this submarket — average credit score on applications, eviction rate, late-payment / NSF rate, and stable-employment percentage? A property-management company in the area should have these aggregated.
- How much new for-sale + rental construction is in the pipeline within 1–3 miles? Heavy new supply typically softens prices + rents 12–24 months out; constrained supply supports both.
Investment metrics
- 1% rule
- 0.77% ✗
- Cap rate
- 6.12%
- Cash-on-cash
- -0.63%
- DSCR
- 0.97
- GRM
- 10.8
CMA / ARV
- ARV (on-the-fly)
- $278,576
- Comps found
- 6
Show comp detail 6 sales within ~0.75 mi
| Address | Dist | Beds/Ba | Sqft | Sold | Price | $/sf | Match |
|---|---|---|---|---|---|---|---|
| 2050 Live Oak Dr | 0.40mi | 3/2.0 | 1,606 (+6%) | 8mo | $250,000 | $156 | 65 |
| 504 Shiloh St | 0.42mi | 3/1.5 | 1,446 (-4%) | 16mo | $246,000 | $170 | 58 |
| 308 N Valley Rd | 0.47mi | 2/2.0 (-1) | 1,624 (+7%) | 9mo | $255,300 | $157 | 53 |
| 907 Elm Ave | 0.51mi | 4/2.5 (+1) | 1,576 (+4%) | 22mo | $289,900 | $184 | 44 |
| 1436 Spring Lake Rd | 0.72mi | 3/2.0 | 1,368 (-10%) | 10mo | $419,900 | $307 | 41 |
| 2416 Spring Lake Rd | 0.71mi | 3/2.5 | 1,360 (-10%) | 14mo | $316,500 | $233 | 36 |
Match score weights: distance 35% · size 25% · config 20% · recency 20%. Top-matched comps best support the ARV.
Projected returns pro-forma
-3.0% appreciation · 3.0% rent growth · sell at horizon
- IRR
- -17.4%
- Equity multiple
- 0.39×
- Total profit
- $-46,363
- Equity at exit
- $40,258
- IRR
- -9.5%
- Equity multiple
- 0.42×
- Total profit
- $-43,963
- Equity at exit
- $23,345
Cash invested: $75,600 (down + closing). Projections, not guarantees.
Landlord ↔ Tenant lean methodology
- Overall (STATE)
- 87 Strongly Landlord-Friendly
- State Florida
- 87 Strongly Landlord-Friendly · R+3
- County
- — inherits STATE
- City
- — inherits STATE
ZIP-level market 34731
- Home prices YoY
- -10.1%
- Active inventory
- 165
- Price-to-rent
- 10.8×
Monthly cashflow live
- Estimated rent
- $2,078 high interval (Pro) →
- Mortgage (P&I)
- −$1,416
- Tax from tax record
- −$153 /mo · $1,831/yr
- Insurance
- −$112
- HOA
- −$0
- Vacancy / Maint / Mgmt
- −$436
- Net cashflow
- $-40
Break-even live
UW: 25.0% down · 7.5% · 30yr · 1.5% tax · 5.0% vac · 8.0% maint · 8.0% mgmt
Financing live
Cash to close
- Down payment
- $67,500
- Closing costs
- $8,100
- Reserves months
- —
- Total cash needed
- —
Loan-product check · same deal, 3 products live
Conventional
25% down · 7.5% · 30yr
- Down + closing
- —
- Monthly P&I
- —
- Monthly cashflow
- —
- DSCR
- —
- Eligible?
- —
Personal DTI + credit; lowest rate.
DSCR
20% down · 8.5% · 30yr
- Down + closing
- —
- Monthly P&I
- —
- Monthly cashflow
- —
- DSCR
- —
- Eligible?
- —
No personal income docs; deal must DSCR.
Hard money
10% down · 12.0% · 12mo
- Down + closing
- —
- Monthly P&I
- —
- Monthly cashflow
- —
- DSCR
- —
- Eligible?
- —
Short-term bridge; refi at stabilization.
Rent comps 7 comps
| Address | Beds | Baths | Sqft | Rent | $/sqft | DOM | Units | Dist |
|---|---|---|---|---|---|---|---|---|
| 36338 W Spring Lake Blvd Fruitland Park, FL | 3.0 | 2.5 | 1539 | $2,100 | $1.36 | 24d | 1 | 0.68mi |
| 1508 Spring Lake Cove Ln Fruitland Park, FL | 2.0–3.0 | 1.0–2.0 | 971 | $1,509 | $1.55 | 2d | 9 | 0.70mi |
| 1639 Spring Lake Rd Fruitland Park, FL | 3.0 | 2.0 | 1455 | $1,995 | $1.37 | 5d | 1 | 0.85mi |
| 307 Willard Ave Fruitland Park, FL | 3.0 | 2.0 | 1796 | $1,881 | $1.05 | 12d | 1 | 0.90mi |
| 1609 Hoofprint Ct Fruitland Park, FL | 4.0 | 2.0 | 2128 | $2,191 | $1.03 | 5d | 1 | 1.29mi |
| 1241 Atlantic Ave Fruitland Park, FL | 3.0 | 2.0 | 1344 | $2,100 | $1.56 | 24d | 1 | 1.37mi |
| 1252 Vanderway Ln Lady Lake, FL | 3.0–4.0 | 2.0 | 1698 | $2,050 | $1.21 | 5d | 1 | 1.46mi |
Listing history 35 events
-
2026-06-18days on market $270,000 Active 27 DOM
-
2026-06-17days on market $270,000 Active 26 DOM
-
2026-06-16days on market $270,000 Active 25 DOM
-
2026-06-15days on market $270,000 Active 24 DOM
-
2026-06-13days on market $270,000 Active 22 DOM
-
2026-06-09days on market $270,000 Active 18 DOM
-
2026-06-08days on market $270,000 Active 17 DOM
-
2026-06-07days on market $270,000 Active 16 DOM
-
2026-06-04days on market $270,000 Active 13 DOM
-
2026-06-03days on market $270,000 Active 12 DOM
-
2026-06-02days on market $270,000 Active 11 DOM
-
2026-06-01days on market $270,000 Active 10 DOM
-
2026-05-31days on market $270,000 Active 9 DOM
-
2026-05-22$270,000 Active
-
2025-07-10status Pending
-
2025-07-09historical
-
2025-06-20$250,000 Active
-
2025-01-31historical
-
2025-01-12price $279,999
-
2024-12-05price $282,799
-
2024-11-13price $286,950
-
2024-11-06price $290,688
-
2024-10-20$295,000 Active
-
2024-06-05status Active
-
2024-06-03historical
-
2024-05-28status Active
-
2024-05-28price $279,000
-
2024-04-18price $296,000
-
2024-04-13$304,900 Active
-
2015-04-15historical
-
2015-02-05$135,000 Active
-
2005-08-04soldstatus $179,000
-
2005-08-01soldstatus $179,900
-
2005-04-20$179,900
-
1997-10-03soldstatus $14,700
ⓘ Source: listings_history table (triggers on properties + properties_extension) + one-shot
backfill from property_details.listing_events for pre-trigger history.
Tax reassessment forecast FL · Resets to sale price
- Current annual tax
- $1,831 · $153/mo
- Projected year-2 tax
- $2,241 · $187/mo
- Expected delta
- +$410/yr (+$34/mo · 22.4%)
ⓘ Screening estimate from a state-policy table — verify with the county assessor before closing.
Climate risk First Street
- Flood 1/10 Low FEMA zone X (unshaded) · 0% chance over 30 yrs
- Wildfire 3/10 Moderate
- Heat 8/10 Severe 7 d/yr ≥108°F today · 22 d/yr by 30 yrs out
- Wind 9/10 Extreme 99% chance of damaging wind over 30 yrs
- Air quality 3/10 Moderate 2 unhealthy d/yr today · 4 by 30 yrs out
Nearby sold comps map
Loading sold comps map…
Walkable amenities ~0.75 mi
Loading nearby amenities…
Taxation est. · year 1
- Rental income
- $24,931
- − Mortgage interest
- −$15,124
- − Property taxes
- −$1,831
- − Insurance
- −$1,350
- − Repairs & maintenance
- −$1,995
- − Management
- −$1,995
- − Depreciation
- −$7,855
- Taxable loss
- −$5,218
- Est. tax savings @ 24.0%
- +$1,252
- After-tax cash flow
- $776/yr
For passive investors: Depreciation is non-cash, so a rental often shows a tax loss while cash-flowing — sheltering income. Rental losses are passive: they offset passive income freely, and up to $25,000/yr can offset ordinary (W-2) income if you actively participate and your MAGI is under $100k (phasing out to $0 by $150k); unused losses carry forward. On sale, claimed depreciation is recaptured at up to 25%, and gains may owe capital-gains tax (a 1031 exchange can defer both). Figures are a year-1 estimate at your 24.0% rate — not tax advice; consult a CPA.
Schools (NCES district)
- District
- Lake
- NCES district ID
- 1201050
- Math proficiency
- 49% ▼ -7.00%
- Reading proficiency
- 50% ▼ -4.00%
- Median HH income
- $46,632
- Composite
- 42.05/100
- National rank
- #3327
- State rank
- #37 of 73 in FL
Livability — Fruitland Park
- Score
- 70/100
- State rank
- #447
- US rank
- #8098
Category grades
Schools grade is shown separately in the Schools card above.
Census & demographics
- Census place
- Fruitland Park, FL
- County
- Lake County · 364,602 people
- City population
- 12,196
- Metro
- Orlando-Kissimmee-Sanford, FL
- Population (ZIP)
- 12,196
- Household income
- $66,300
- Rent vs Own
- Severe rent burden
- 269.0
Population outlook (Lake County) Hauer SSP2
- Today (2025)
- 386,640 people
- By 2030
- 417,107 · +7.9%
- By 2040
- 476,676 · +23.3%
- By 2050
- 531,296 · +37.4%
- By 2075
- 648,303 · +67.7%
- By 2100
- 698,530 · +80.7%
Race, ethnicity, and origin ACS 2023
- Neighborhood character
- Predominantly White (76%)
- Race & ethnicity
- White 76% Black 11% Two or more races 11% Hispanic / Latino 3%
- Common ancestry
- Romanian 3% Serbian 2% Iranian 2%
- Foreign-born
- 5% · Canada
- Languages at home
- 98% English-only · Spanish 1% German/W. Germanic 1%
Political lean MEDSL · Lake
- 2024 margin
- Strong R (+24.7) · D 37.3% · R 62.0%
- 2008→2024 swing
- -11.2pp toward R · 2008: -13.5pp · 2024: -24.7pp
- All cycles
- 2024: R+24.7 2020: R+20.0 2016: R+23.1 2012: R+17.1 2008: R+13.5
Not yet ingested
- Civics
- —
Market trends
- HPI YoY
- ▼ -35.91%
- Current HPI
- 318.8206
- Rent YoY
- —
- Metro
- Orlando-Kissimmee-Sanford, FL
- State GDP YoY
- ▲ 3.28%
- F500 in state
- 36
Industry mix (Fortune 500 HQ in FL)
| Industry | F500 HQs | Revenue |
|---|---|---|
| Industrial Technology | 2 | $29B |
|
||
| Insurance | 2 | $17B |
|
||
| Retail | 1 | $60B |
|
||
| Technology Distribution | 1 | $58B |
|
||
| Homebuilding | 1 | $35B |
|
||
| Technology Manufacturing | 1 | $35B |
|
||
Price history
+1736.7% since first listed22 events — show timeline
- 2026-05-22 Listed $270,000 Stellar MLS as Distributed by MLS Grid
- 2025-07-10 Pending — Stellar MLS as Distributed by MLS Grid
- 2025-07-09 Listing Removed — Stellar MLS as Distributed by MLS Grid
- 2025-06-20 Listed $250,000 Stellar MLS as Distributed by MLS Grid
- 2025-01-31 Listing Removed — Stellar MLS as Distributed by MLS Grid
- 2025-01-12 Price Changed $279,999 Stellar MLS as Distributed by MLS Grid
- 2024-12-05 Price Changed $282,799 Stellar MLS as Distributed by MLS Grid
- 2024-11-13 Price Changed $286,950 Stellar MLS as Distributed by MLS Grid
- 2024-11-06 Price Changed $290,688 Stellar MLS as Distributed by MLS Grid
- 2024-10-20 Listed $295,000 Stellar MLS as Distributed by MLS Grid
- 2024-06-05 Relisted — Stellar MLS as Distributed by MLS Grid
- 2024-06-03 Listing Removed — Stellar MLS as Distributed by MLS Grid
- 2024-05-28 Relisted — Stellar MLS as Distributed by MLS Grid
- 2024-05-28 Price Changed $279,000 Stellar MLS as Distributed by MLS Grid
- 2024-04-18 Price Changed $296,000 Stellar MLS as Distributed by MLS Grid
- 2024-04-13 Listed $304,900 Stellar MLS as Distributed by MLS Grid
- 2015-04-15 Listing Removed — Stellar MLS as Distributed by MLS Grid
- 2015-02-05 Listed $135,000 Stellar MLS as Distributed by MLS Grid
- 2005-08-04 Sold (Public Records) $179,000 Public Records
- 2005-08-01 Sold (MLS) $179,900 Stellar MLS as Distributed by MLS Grid
- 2005-04-20 Listed $179,900 Stellar MLS as Distributed by MLS Grid
- 1997-10-03 Sold (Public Records) $14,700 Public Records
Property tax history
+4.3%/yrLatest (2025): $1,831 · +2.3% YoY. Source: county tax records.
Cash-flow waterfall
monthlySold comps — $/sqft
last 12 mo · ≤1 miLoading sold comps…