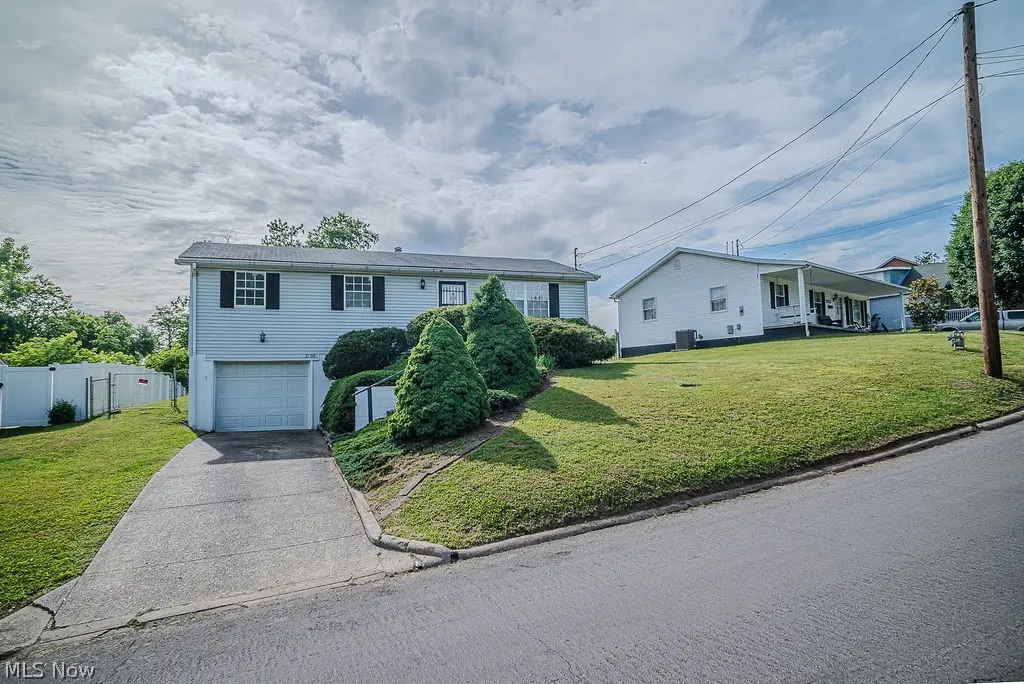
2100 Division Street Ext St · Parkersburg, WV
Flood risk 1/10 · Minimal
- FEMA flood zone
- X (unshaded)
- Chance of flooding over 30 yrs
- 0.0%
- Est. flood insurance / yr
- $473 – $860
Fire risk 4/10 · Minor
- Est. fire insurance / yr
- $787 – $1,461
Heat risk 5/10 · Moderate
- Hot days now (above 102°F)
- 7 days/yr
- Hot days in 30 yrs
- 18 days/yr
Wind risk 2/10 · Minimal
- Chance of severe wind over 30 yrs
- 1.0%
Air-quality risk 2/10 · Minimal
- Unhealthy air days now
- 1 days/yr
- Unhealthy air days in 30 yrs
- 2 days/yr
Risk factors via First Street. Map © Google.
Why this score? — see what drove the C- grade
The composite is a weighted blend of 9 inputs, each scored 0–100. Each bar is that input's sub-score; the figure is the points it added to the 100-point composite (weight × sub-score).
- Cash flow +15.0/30.0
- ARV discount +15.0/15.0
- DSCR +4.6/10.0
- Schools +3.6/10.0
- Livability +3.6/5.0
- 1% rule +3.5/10.0
- Rent growth +2.5/5.0
- Condition / age +2.5/5.0
- Appreciation +0.0/10.0
$125,000
🖨 Deal sheet (PDF) 📄 Offer letter ✓ Due diligence
Listing remarks
Bring your ideas, your vision, and a little imagination. This home offers the kind of opportunity that's becoming harder to find: a chance to create a space that reflects your own style while building value along the way. A few steps from the front entry lead into the living room, which flows into the dining area and kitchen. Just beyond, a spacious sunroom wrapped in windows overlooks the backyard and offers an inviting space for morning coffee, game nights, hobbies, or simply enjoying the changing seasons. Three bedrooms and a full bath are located on the main level, providing a practical layout for everyday living. The kitchen also connects to the lower level, where you'll find a finishe
Key facts
- 9,783 sq ft lot
- Garage
- Built 1979
Property features AI
Exterior
- Parking: Attached garage (1 car); Built-in garage; Driveway access; Garage faces front
- Utilities: Public water; Public sewer
- Home design: Single-story home; Fixer condition; Above-grade finished area: reported by assessor
- Construction: Vinyl siding; Shingle roof; Block foundation; Year built: source - Assessor
- Exterior features: Lighting; Rear enclosed porch; Patio; Porch
Interior
- Kitchen: Dishwasher; Range; Refrigerator
- Bedrooms: 3 main-level bedrooms
- Bathrooms: 1 full bathroom (main level)
- Interior features: Double-pane windows; Ceiling fan(s)
- Laundry & utility: Laundry in basement
Neighborhood map
What this means for you Summary
Snapshot
- This is a 3-bed/1.0-bath single-family listed at $125k.
Deal economics
- At list price, monthly cash flow is $40 ($476/yr) — positive.
- The deal already cash-flows at list — no discount required.
- To meet the 1% rule (rent ≥ 1% of price), the offer needs to be $106k (15.0% below list).
- Recommended offer: $106k (15.0% below list) — sets the bar for 1% rule.
- Cap rate 6.7% vs local median 5.5% in Parkersburg — meaningfully above typical; check what's discounted (condition, days-on-market, listing class) to confirm the premium yield is real.
Location & tenants
- Location reads 72/100 on livability (#46 in WV) — a middle-class / working-renter tenant base. Strengths: cost of living A+, housing A+, health & safety A+; Watch: crime D+, commute F, employment F.
- Wood County Schools (urban): math 38% / reading 48% proficiency, ranked #3 of 55 in WV (top 6%) — families likely to look elsewhere, expect single-tenant / working-renter base with shorter leases.
- Zoned schools: Gihon Elementary School (math 52% / reading 57%, grade C, #29 of 377 statewide, top 10%, 269 students, 0% FRL); Blennerhassett Middle School (math 35% / reading 45%, grade F, #19 of 109 statewide, top 17%, 509 students, 0% FRL); Parkersburg South High School (math 28% / reading 49%, grade F, #30 of 110 statewide, top 27%, 1,454 students, 0% FRL) — zoned schools average 0% FRL vs 47% district-wide (47 pts lower); this property's tenant base skews higher-income than the district average.
- Market conditions: 149 active listings in the ZIP; 124 units permitted in Wood County in 2024 (33 in 5+ unit buildings).
Forward outlook
- Local home prices are declining (-3.0%/yr); year-one equity from $864 of loan paydown is wiped out by about $4k of value loss. Plan a longer hold.
- Wood County population projected at -13% by 2050 — secular population decline; favor cash flow + early exit over multi-decade hold.
Negotiation context
- Only 1 days on market — expect competitive offers; lowballing is unlikely to land.
- Current owner paid $48k; list at $125k implies a 160% gain — meaningful room to come down on a strong offer.
Risks & watch-outs
- Climate carrying-cost: extreme-heat days projected 7→18/yr by 2055 (HVAC capex compounding) — expect insurance premiums to compound above CPI over the hold.
Questions for the listing agent
- Built in 1979 — when were the roof, HVAC, electrical panel, plumbing, and water heater last replaced?
- Is there a deadline driving the sale (1031 exchange, divorce, estate, relocation)? That informs how much negotiation room exists.
- Schools are F-rated, which usually means shorter tenancies and higher turnover. Who's the typical renter profile here, and what's been the actual vacancy rate?
- Crime grade is D in this area — have there been break-ins, vandalism, or insurance claims at this property in the last 3 years? What carrier currently insures it and at what premium?
- What's the average days-on-market for RENTAL listings here right now (not sales)? A rising rental-DOM trend means longer vacancies and softer asking-rent achievability than the comps imply.
- What's the recent tenant-quality profile in this submarket — average credit score on applications, eviction rate, late-payment / NSF rate, and stable-employment percentage? A property-management company in the area should have these aggregated.
- How much new for-sale + rental construction is in the pipeline within 1–3 miles? Heavy new supply typically softens prices + rents 12–24 months out; constrained supply supports both.
Investment metrics
- 1% rule
- 0.85% ✗
- Cap rate
- 6.67%
- Cash-on-cash
- 1.36%
- DSCR
- 1.06
- GRM
- 9.8
CMA / ARV
- ARV (on-the-fly)
- $152,880
- Comps found
- 10
Show comp detail 10 sales within ~0.75 mi
| Address | Dist | Beds/Ba | Sqft | Sold | Price | $/sf | Match |
|---|---|---|---|---|---|---|---|
| 1702 Princeton St | 0.28mi | 3/1.0 | 1,164 (+7%) | 4mo | $159,500 | $137 | 73 |
| 1404 Jeffrey St | 0.60mi | 3/1.5 | 1,107 (+1%) | 5mo | $150,000 | $136 | 63 |
| 2310 Division Street Ext | 0.21mi | 2/1.0 (-1) | 960 (-12%) | 3mo | $145,000 | $151 | 62 |
| 2525 24th Ave | 0.57mi | 2/2.0 (-1) | 1,090 (-0%) | 7mo | $204,000 | $187 | 58 |
| 2102 Nora St | 0.38mi | 3/2.0 | 944 (-14%) | 5mo | $132,000 | $140 | 52 |
| 2601 22nd Ave | 0.57mi | 3/1.5 | 1,040 (-5%) | 15mo | $135,000 | $130 | 52 |
| 2521 Gihon Rd | 0.62mi | 3/1.0 | 988 (-10%) | 6mo | $117,875 | $119 | 50 |
| 2507 24th Ave | 0.50mi | 3/1.5 | 988 (-10%) | 18mo | $145,000 | $147 | 44 |
| 2702 David Lee Dr | 0.73mi | 4/2.0 (+1) | 1,125 (+3%) | 24mo | $239,000 | $212 | 32 |
| 2612 17th Ave | 0.60mi | 2/1.0 (-1) | 1,236 (+13%) | 20mo | $80,000 | $65 | 28 |
Match score weights: distance 35% · size 25% · config 20% · recency 20%. Top-matched comps best support the ARV.
Projected returns pro-forma
-3.0% appreciation · 3.0% rent growth · sell at horizon
- IRR
- -14.2%
- Equity multiple
- 0.49×
- Total profit
- $-17,752
- Equity at exit
- $18,638
- IRR
- -5.4%
- Equity multiple
- 0.65×
- Total profit
- $-12,299
- Equity at exit
- $10,808
Cash invested: $35,000 (down + closing). Projections, not guarantees.
Landlord ↔ Tenant lean methodology
- Overall (STATE)
- 83 Strongly Landlord-Friendly
- State West Virginia
- 83 Strongly Landlord-Friendly · R+22
- County
- — inherits STATE
- City
- — inherits STATE
ZIP-level market 26101
- Home prices YoY
- -27.3%
- Active inventory
- 149
- Price-to-rent
- 9.8×
Monthly cashflow live
- Estimated rent
- $1,062 medium interval (Pro) →
- Mortgage (P&I)
- −$656
- Tax from tax record
- −$92 /mo · $1,101/yr
- Insurance
- −$52
- HOA
- −$0
- Vacancy / Maint / Mgmt
- −$223
- Net cashflow
- $40
Break-even live
Sensitivity live
| Price | -10% $110 | -5% $75 | +0% $40 | +5% $4 | +10% $-31 |
|---|---|---|---|---|---|
| Rent | -10% $-44 | -5% $-2 | +0% $40 | +5% $82 | +10% $124 |
| Rate | -1.0pp $103 | -0.5pp $71 | base $40 | +0.5pp $7 | +1.0pp $-26 |
UW: 25.0% down · 7.5% · 30yr · 1.5% tax · 5.0% vac · 8.0% maint · 8.0% mgmt
Financing live
Cash to close
- Down payment
- $31,250
- Closing costs
- $3,750
- Reserves months
- —
- Total cash needed
- —
Loan-product check · same deal, 3 products live
Conventional
25% down · 7.5% · 30yr
- Down + closing
- —
- Monthly P&I
- —
- Monthly cashflow
- —
- DSCR
- —
- Eligible?
- —
Personal DTI + credit; lowest rate.
DSCR
20% down · 8.5% · 30yr
- Down + closing
- —
- Monthly P&I
- —
- Monthly cashflow
- —
- DSCR
- —
- Eligible?
- —
No personal income docs; deal must DSCR.
Hard money
10% down · 12.0% · 12mo
- Down + closing
- —
- Monthly P&I
- —
- Monthly cashflow
- —
- DSCR
- —
- Eligible?
- —
Short-term bridge; refi at stabilization.
Listing history 2 events
-
2026-06-05remarks 699-char remark
-
2026-06-05$125,000 Pending 1 DOM
ⓘ Source: listings_history table (triggers on properties + properties_extension) + one-shot
backfill from property_details.listing_events for pre-trigger history.
Tax reassessment forecast WV · Resets to sale price
- Current annual tax
- $1,101 · $92/mo
- Projected year-2 tax
- $1,101 · $92/mo
- Expected delta
- $0/yr ($0/mo · 0.0%)
ⓘ Screening estimate from a state-policy table — verify with the county assessor before closing.
Climate risk First Street
- Flood 1/10 Low FEMA zone X (unshaded) · 0% chance over 30 yrs
- Wildfire 4/10 Moderate
- Heat 5/10 Major 7 d/yr ≥102°F today · 18 d/yr by 30 yrs out
- Wind 2/10 Low 100% chance of damaging wind over 30 yrs
- Air quality 2/10 Low 1 unhealthy d/yr today · 2 by 30 yrs out
Nearby sold comps map
Loading sold comps map…
Walkable amenities ~0.75 mi
Loading nearby amenities…
Taxation est. · year 1
- Rental income
- $12,745
- − Mortgage interest
- −$7,002
- − Property taxes
- −$1,101
- − Insurance
- −$625
- − Repairs & maintenance
- −$1,020
- − Management
- −$1,020
- − Depreciation
- −$3,636
- Taxable loss
- −$1,659
- Est. tax savings @ 24.0%
- +$398
- After-tax cash flow
- $874/yr
For passive investors: Depreciation is non-cash, so a rental often shows a tax loss while cash-flowing — sheltering income. Rental losses are passive: they offset passive income freely, and up to $25,000/yr can offset ordinary (W-2) income if you actively participate and your MAGI is under $100k (phasing out to $0 by $150k); unused losses carry forward. On sale, claimed depreciation is recaptured at up to 25%, and gains may owe capital-gains tax (a 1031 exchange can defer both). Figures are a year-1 estimate at your 24.0% rate — not tax advice; consult a CPA.
Schools (NCES district)
- District
- Wood County Schools
- NCES district ID
- 5401620
- Math proficiency
- 38% ▼ -10.00%
- Reading proficiency
- 48% ▼ -4.00%
- Median HH income
- $42,363
- Composite
- 36.22/100
- National rank
- #4728
- State rank
- #3 of 55 in WV
Livability — Parkersburg
- Score
- 72/100
- State rank
- #46
- US rank
- #5841
Category grades
Schools grade is shown separately in the Schools card above.
Census & demographics
- Census place
- Parkersburg, WV
- County
- Wood County · 44,810 people
- City population
- 44,810
- Metro
- Parkersburg-Vienna, WV
- Population (ZIP)
- 28,005
- Household income
- $48,710
- Rent vs Own
- Severe rent burden
- 723.0
Population outlook (Wood County) Hauer SSP2
- Today (2025)
- 84,304 people
- By 2030
- 82,420 · -2.2%
- By 2040
- 78,133 · -7.3%
- By 2050
- 73,639 · -12.7%
- By 2075
- 63,093 · -25.2%
- By 2100
- 50,461 · -40.1%
Race, ethnicity, and origin ACS 2023
- Neighborhood character
- Predominantly White (93%)
- Race & ethnicity
- White 93% Two or more races 3% Hispanic / Latino 2% Black 1%
- Common ancestry
- Serbian 2% Slovak 2% Lithuanian 1%
- Foreign-born
- 1%
Political lean MEDSL · Wood
- 2024 margin
- Solid R (+43.0) · D 27.6% · R 70.7% · Other 1.6%
- 2008→2024 swing
- -14.4pp toward R · 2008: -28.7pp · 2024: -43.0pp
- All cycles
- 2024: R+43.0 2020: R+42.0 2016: R+47.8 2012: R+32.5 2008: R+28.7
Not yet ingested
- Civics
- —
Market trends
- HPI YoY
- ▼ -76.52%
- Current HPI
- 203.4508
- Rent YoY
- —
- Metro
- Parkersburg-Vienna, WV
- State GDP YoY
- —
- F500 in state
- 0
Price history
+160.4% since first listed3 events — show timeline
- 2026-06-04 Pending — MLSNOW
- 2026-06-04 Listed $125,000 MLSNOW
- 1990-09-21 Sold (Public Records) $48,000 Public Records
Property tax history
+3.0%/yrLatest (2025): $1,101 · +5.3% YoY. Source: county tax records.
Cash-flow waterfall
monthlySold comps — $/sqft
last 12 mo · ≤1 miLoading sold comps…