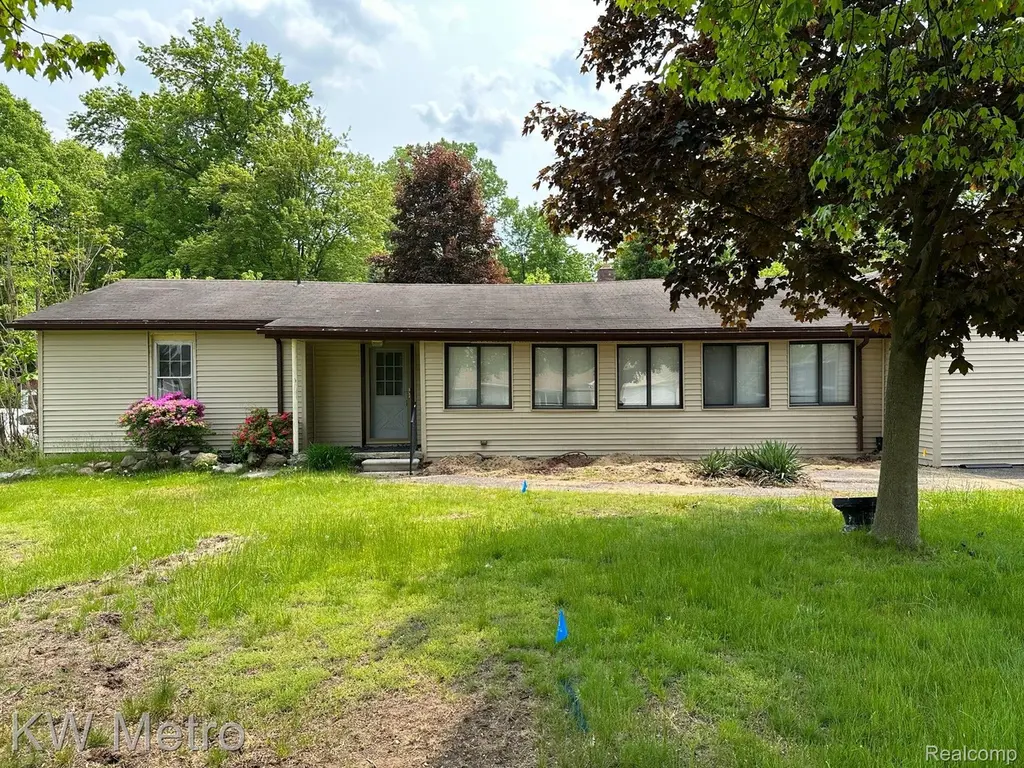
1436 Hartwig Dr · Troy, MI
Flood risk 1/10 · Minimal
- FEMA flood zone
- X (unshaded)
- Chance of flooding over 30 yrs
- 0.0%
- Est. flood insurance / yr
- $507 – $1,088
Fire risk 1/10 · Minimal
- Est. fire insurance / yr
- $784 – $1,456
Heat risk 2/10 · Minimal
- Hot days now (above 97°F)
- 7 days/yr
- Hot days in 30 yrs
- 14 days/yr
Wind risk 2/10 · Minimal
- Chance of severe wind over 30 yrs
- —
Air-quality risk 3/10 · Minor
- Unhealthy air days now
- 3 days/yr
- Unhealthy air days in 30 yrs
- 4 days/yr
Risk factors via First Street. Map © Google.
Why this score? — see what drove the A- grade
The composite is a weighted blend of 9 inputs, each scored 0–100. Each bar is that input's sub-score; the figure is the points it added to the 100-point composite (weight × sub-score).
- Cash flow +30.0/30.0
- ARV discount +15.0/15.0
- 1% rule +10.0/10.0
- DSCR +10.0/10.0
- Schools +6.5/10.0
- Livability +3.9/5.0
- Rent growth +2.5/5.0
- Condition / age +2.5/5.0
- Appreciation +0.0/10.0
$180,000
🖨 Deal sheet 📄 Offer letter ✓ Due diligence
Listing remarks MLS
Amazing potential in a great location on a large, park-like yard. The house is gutted and will need a full rehab. Foundation repairs have been professionally made with a transferable warranty. But the best use is likely as a tear down to build new. Listing agent has an ownership interest
Key facts
- Large park-like yard
- Foundation repairs
- 0.39 acre lot
Tags
Property features AI
Exterior
- Parking: Attached tandem garage with 2 spaces
- Utilities: Public sewer
- Home design: Single-family residence; One story; Ground-level entry with steps; Above-grade finished area approximately 1,316
- Construction: Block and vinyl siding exterior
- Exterior features: Paved road access; Lot roughly 100 x 170 (0.39 acres); No pool
Interior
- Bathrooms: 1 full bathroom
- Heating & cooling: Central air conditioning; Forced air heating (natural gas)
- Interior features: Crawl space basement; Total of 6 rooms
Neighborhood map
What this means for you Summary
Snapshot
- This is a 3-bed/1.0-bath single-family listed at $180k.
Deal economics
- At list price, monthly cash flow is $701 ($8k/yr) — positive.
- The deal already cash-flows at list — no discount required.
- Meets the 1% rule at list price ($3k rent vs $180k).
- Cap rate 11.0% vs local median 3.6% in Troy — top-decile yield for the area; either an underpriced asset or a hidden risk that comps aren't pricing in. Stress-test before assuming the spread holds.
Location & tenants
- Location reads 78/100 on livability (#113 in MI, #2,684 nationally) — a middle-class / working-renter tenant base. Strengths: employment A+, housing A+, schools A; Watch: health & safety D+, amenities F, commute F.
- Troy School District (urban): math 68% / reading 75% proficiency, ranked #8 of 540 in MI (top 2%) — strong family-tenant draw, lease renewals of 3-5y typical; only 10% free/reduced lunch — higher-income household profile.
- Market conditions: 120 active listings in the ZIP; 8 comparable units currently listed for rent nearby; rentals at typical pace (median 17d on market — plan ~3-4 weeks tenant-placement turnaround); high-income renter base; 2,614 units permitted in Oakland County in 2024 (721 in 5+ unit buildings).
Forward outlook
- Local home prices are declining (-3.0%/yr); year-one equity from $1k of loan paydown is wiped out by about $5k of value loss. Plan a longer hold.
- Oakland County population projected at +10% by 2050 — modest demand growth; plan on rents tracking national, not racing it.
- At projected returns (-3.0% appreciation + 3.0% rent growth), your $50k cash investment doubles in ~8 years — after that, you're playing with house money.
Negotiation context
- Only 3 days on market — expect competitive offers; lowballing is unlikely to land.
- 11 sale attempts since 4y ago with the ask held roughly flat each time — persistent listings suggest the price (not the market) is what's stuck; bring a comps-based counter.
- Current owner paid $115k; list at $180k implies a 57% gain — meaningful room to come down on a strong offer.
Risks & watch-outs
- Watch-outs: property tax is 2.9% of price; built in 1947 — expect roof / HVAC / electrical / plumbing capex.
Questions for the listing agent
- Built in 1947 — when were the roof, HVAC, electrical panel, plumbing, and water heater last replaced?
- Property tax is high relative to price — has the assessment been appealed recently, and will the sale trigger a re-assessment?
- Is there a deadline driving the sale (1031 exchange, divorce, estate, relocation)? That informs how much negotiation room exists.
- Schools are A-rated — typically a magnet for longer-tenancy family renters. What's the average tenant stay here, and is there a school-zone premium baked into asking?
- What's the average days-on-market for RENTAL listings here right now (not sales)? A rising rental-DOM trend means longer vacancies and softer asking-rent achievability than the comps imply.
- What's the recent tenant-quality profile in this submarket — average credit score on applications, eviction rate, late-payment / NSF rate, and stable-employment percentage? A property-management company in the area should have these aggregated.
- How much new for-sale + rental construction is in the pipeline within 1–3 miles? Heavy new supply typically softens prices + rents 12–24 months out; constrained supply supports both.
Investment metrics
- 1% rule
- 1.52% ✓
- Cap rate
- 10.97%
- Cash-on-cash
- 16.69%
- DSCR
- 1.74
- GRM
- 5.5
CMA / ARV
- ARV (on-the-fly)
- $318,472
- Comps found
- 6
Show comp detail 6 sales within ~0.75 mi
| Address | Dist | Beds/Ba | Sqft | Sold | Price | $/sf | Match |
|---|---|---|---|---|---|---|---|
| 322 Michelson Rd | 0.44mi | 3/1.0 | 1,292 (-2%) | 8mo | $219,999 | $170 | 70 |
| 380 E South Blvd | 0.25mi | 3/3.0 | 1,416 (+8%) | 1mo | $325,000 | $230 | 67 |
| 772 Marengo Dr | 0.75mi | 3/1.0 | 1,261 (-4%) | 6mo | $305,000 | $242 | 53 |
| 862 Hannah Ave | 0.65mi | 3/1.0 | 1,215 (-8%) | 9mo | $315,000 | $259 | 50 |
| 1731 W Auburn Rd | 0.40mi | 2/1.5 (-1) | 1,176 (-11%) | 8mo | $320,000 | $272 | 50 |
| 1457 Cambria Dr | 0.11mi | 3/2.0 | 1,500 (+14%) | 23mo | $300,000 | $200 | 48 |
Match score weights: distance 35% · size 25% · config 20% · recency 20%. Top-matched comps best support the ARV.
Projected returns pro-forma
-3.0% appreciation · 3.0% rent growth · sell at horizon
- IRR
- 7.9%
- Equity multiple
- 1.31×
- Total profit
- $15,648
- Equity at exit
- $26,839
- IRR
- 17.2%
- Equity multiple
- 2.42×
- Total profit
- $71,814
- Equity at exit
- $15,563
Cash invested: $50,400 (down + closing). Projections, not guarantees.
Landlord ↔ Tenant lean methodology
- Overall (STATE)
- 62 Landlord-Friendly
- State Michigan
- 62 Landlord-Friendly · EVEN
- County
- — inherits STATE
- City
- — inherits STATE
ZIP-level market 48085
- Active inventory
- 120
- Price-to-rent
- 5.5×
Monthly cashflow live
- Estimated rent
- $2,734 high interval (Pro) →
- Mortgage (P&I)
- −$944
- Tax from tax record
- −$440 /mo · $5,279/yr
- Insurance
- −$75
- HOA
- −$0
- Vacancy / Maint / Mgmt
- −$574
- Net cashflow
- $701
Break-even live
UW: 25.0% down · 7.5% · 30yr · 1.5% tax · 5.0% vac · 8.0% maint · 8.0% mgmt
Financing live
Cash to close
- Down payment
- $45,000
- Closing costs
- $5,400
- Reserves months
- —
- Total cash needed
- —
Loan-product check · same deal, 3 products live
Conventional
25% down · 7.5% · 30yr
- Down + closing
- —
- Monthly P&I
- —
- Monthly cashflow
- —
- DSCR
- —
- Eligible?
- —
Personal DTI + credit; lowest rate.
DSCR
20% down · 8.5% · 30yr
- Down + closing
- —
- Monthly P&I
- —
- Monthly cashflow
- —
- DSCR
- —
- Eligible?
- —
No personal income docs; deal must DSCR.
Hard money
10% down · 12.0% · 12mo
- Down + closing
- —
- Monthly P&I
- —
- Monthly cashflow
- —
- DSCR
- —
- Eligible?
- —
Short-term bridge; refi at stabilization.
Rent comps 8 comps
| Address | Beds | Baths | Sqft | Rent | $/sqft | DOM | Units | Dist |
|---|---|---|---|---|---|---|---|---|
| 1128 Alameda Blvd Unit 1128 Troy, MI | 2.0 | 2.0 | 1457 | $2,150 | $1.48 | 22d | 1 | 0.36mi |
| 1070 Villa Park Dr Troy, MI | 3.0 | 1.5 | 1200 | $1,792 | $1.49 | 2d | 3 | 0.64mi |
| 5944 Willow Grv Troy, MI | 3.0 | 2.0 | 1850 | $4,250 | $2.30 | 43d | 1 | 0.95mi |
| 2845 Hartwick Dr Rochester, MI | 3.0 | 3.5 | 1805 | $2,800 | $1.55 | 14d | 1 | 1.27mi |
| 3465 Hazelton Ave Rochester Hills, MI | 3.0 | 1.5 | 1240 | $3,690 | $2.98 | 3d | 1 | 1.35mi |
| 1629 Emerson Cir #95 Rochester Hills, MI | 2.0 | 1.0 | 950 | $1,390 | $1.46 | 43d | 1 | 1.36mi |
| 1750 Melville Dr Rochester Hills, MI | 1.0–2.0 | 1.0–2.0 | 875 | $1,639 | $1.87 | 3d | 1 | 1.39mi |
| 3113 Emmons Ave Rochester Hills, MI | 2.0 | 2.0 | 1200 | $1,800 | $1.50 | 16d | 1 | 1.49mi |
Listing history 24 events
-
2026-05-27$180,000 Active
-
2026-05-26$180,000 Active 288-char remark
Show marketing remark (288 chars)
Amazing potential in a great location on a large, park-like yard. The house is gutted and will need a full rehab. Foundation repairs have been professionally made with a transferable warranty. But the best use is likely as a tear down to build new. Listing agent has an ownership interest
-
2025-07-03historical
-
2025-07-03status Active
-
2024-12-17status Pending
-
2024-05-10status Pending
-
2024-05-10status Pending
-
2024-05-10historical
-
2024-03-21$195,000 Active
-
2024-03-21$195,000 Active
-
2023-12-11historical
-
2023-12-11historical
-
2023-08-25$199,900 Active
-
2023-08-25$199,900 Active
-
2023-08-20historical
-
2023-08-20historical
-
2023-05-26$199,900 Active
-
2023-05-26$199,900 Active
-
2023-04-14soldstatus $115,000
-
2022-12-07historical
-
2022-12-07historical
-
2022-11-02$235,000 Active
-
2022-10-29$235,000 Active
-
1993-04-26soldstatus $21,200
ⓘ Source: listings_history table (triggers on properties + properties_extension) + one-shot
backfill from property_details.listing_events for pre-trigger history.
Tax reassessment forecast MI · Partial reset (capped growth)
- Current annual tax
- $5,279 · $440/mo
- Projected year-2 tax
- $5,279 · $440/mo
- Expected delta
- $0/yr ($0/mo · 0.0%)
ⓘ Screening estimate from a state-policy table — verify with the county assessor before closing.
Climate risk First Street
- Flood 1/10 Low FEMA zone X (unshaded) · 0% chance over 30 yrs
- Wildfire 1/10 Low
- Heat 2/10 Low 7 d/yr ≥97°F today · 14 d/yr by 30 yrs out
- Wind 2/10 Low
- Air quality 3/10 Moderate 3 unhealthy d/yr today · 4 by 30 yrs out
Nearby sold comps map
Loading sold comps map…
Walkable amenities ~0.75 mi
Loading nearby amenities…
Taxation est. · year 1
- Rental income
- $32,807
- − Mortgage interest
- −$10,083
- − Property taxes
- −$5,279
- − Insurance
- −$900
- − Repairs & maintenance
- −$2,625
- − Management
- −$2,625
- − Depreciation
- −$5,236
- Taxable income
- $6,060
- Est. tax owed @ 24.0%
- −$1,454
- After-tax cash flow
- $6,957/yr
For passive investors: Depreciation is non-cash, so a rental often shows a tax loss while cash-flowing — sheltering income. Rental losses are passive: they offset passive income freely, and up to $25,000/yr can offset ordinary (W-2) income if you actively participate and your MAGI is under $100k (phasing out to $0 by $150k); unused losses carry forward. On sale, claimed depreciation is recaptured at up to 25%, and gains may owe capital-gains tax (a 1031 exchange can defer both). Figures are a year-1 estimate at your 24.0% rate — not tax advice; consult a CPA.
Schools (NCES district)
- District
- Troy School District
- NCES district ID
- 2634260
- Math proficiency
- 68% ▼ -3.00%
- Reading proficiency
- 75% ▼ -2.00%
- Median HH income
- $90,920
- Composite
- 64.5/100
- National rank
- #539
- State rank
- #8 of 540 in MI
Livability — Troy
- Score
- 78/100
- State rank
- #113
- US rank
- #2684
Category grades
Schools grade is shown separately in the Schools card above.
Census & demographics
- Census place
- Troy, MI
- County
- Oakland County · 1,009,092 people
- City population
- 87,898
- Metro
- Detroit-Warren-Dearborn, MI
- Population (ZIP)
- 27,231
- Household income
- $146,390
- Rent vs Own
- Severe rent burden
- 39.0
Population outlook (Oakland County) Hauer SSP2
- Today (2025)
- 1,335,747 people
- By 2030
- 1,375,100 · +2.9%
- By 2040
- 1,435,385 · +7.5%
- By 2050
- 1,469,250 · +10.0%
- By 2075
- 1,531,946 · +14.7%
- By 2100
- 1,450,485 · +8.6%
Race, ethnicity, and origin ACS 2023
- Neighborhood character
- Predominantly White (68%)
- Race & ethnicity
- White 68% Asian 21% Two or more races 5% Black 4% Hispanic / Latino 2%
- Common ancestry
- Romanian 11% Italian 3% Slovak 2%
- Foreign-born
- 26% · Canada, China, South Korea
- Languages at home
- 72% English-only · Other Indo-European 9% Chinese 4% Other Asian/Pacific 4%
Political lean MEDSL · Oakland
- 2024 margin
- D (+10.6) · D 54.4% · R 43.8% · Other 1.9%
- 2008→2024 swing
- -3.9pp toward R · 2008: 14.5pp · 2024: 10.6pp
- All cycles
- 2024: D+10.6 2020: D+14.1 2016: D+8.1 2012: D+8.1 2008: D+14.5
Not yet ingested
- Civics
- —
Market trends
- HPI YoY
- ▼ -326.83%
- Current HPI
- 184.4445
- Rent YoY
- —
- Metro
- Detroit-Warren-Dearborn, MI
- State GDP YoY
- ▲ 1.37%
- F500 in state
- 28
Industry mix (Fortune 500 HQ in MI)
| Industry | F500 HQs | Revenue |
|---|---|---|
| Automotive Parts | 3 | $48B |
|
||
| Automotive | 2 | $372B |
|
||
| Chemicals | 1 | $45B |
|
||
| Automotive Retail | 1 | $29B |
|
||
| Healthcare / Medical Devices | 1 | $23B |
|
||
| Automotive Technology | 1 | $20B |
|
||
Price history
+749.1% since first listed24 events — show timeline
- 2026-05-27 Listed $180,000 REALCOMP
- 2026-05-26 Listed $180,000 MiRealSource-MiMLS
- 2025-07-03 Listing Removed — MiRealSource-MiMLS
- 2025-07-03 Relisted — REALCOMP
- 2024-12-17 Pending — REALCOMP
- 2024-05-10 Pending — REALCOMP
- 2024-05-10 Pending — MiRealSource-MiMLS
- 2024-05-10 Listing Removed — REALCOMP
- 2024-03-21 Listed $195,000 REALCOMP
- 2024-03-21 Listed $195,000 MiRealSource-MiMLS
- 2023-12-11 Listing Removed — MiRealSource-MiMLS
- 2023-12-11 Listing Removed — REALCOMP
- 2023-08-25 Listed $199,900 MiRealSource-MiMLS
- 2023-08-25 Listed $199,900 REALCOMP
- 2023-08-20 Listing Removed — MiRealSource-MiMLS
- 2023-08-20 Listing Removed — REALCOMP
- 2023-05-26 Listed $199,900 MiRealSource-MiMLS
- 2023-05-26 Listed $199,900 REALCOMP
- 2023-04-14 Sold (Public Records) $115,000 Public Records
- 2022-12-07 Listing Removed — MiRealSource-MiMLS
- 2022-12-07 Listing Removed — REALCOMP
- 2022-11-02 Listed $235,000 REALCOMP
- 2022-10-29 Listed $235,000 MiRealSource-MiMLS
- 1993-04-26 Sold (Public Records) $21,200 Public Records
Property tax history
+7.5%/yrLatest (2025): $5,279 · +4.3% YoY. Source: county tax records.
Cash-flow waterfall
monthlySold comps — $/sqft
last 12 mo · ≤1 miLoading sold comps…