 🏷️ Likely Rental
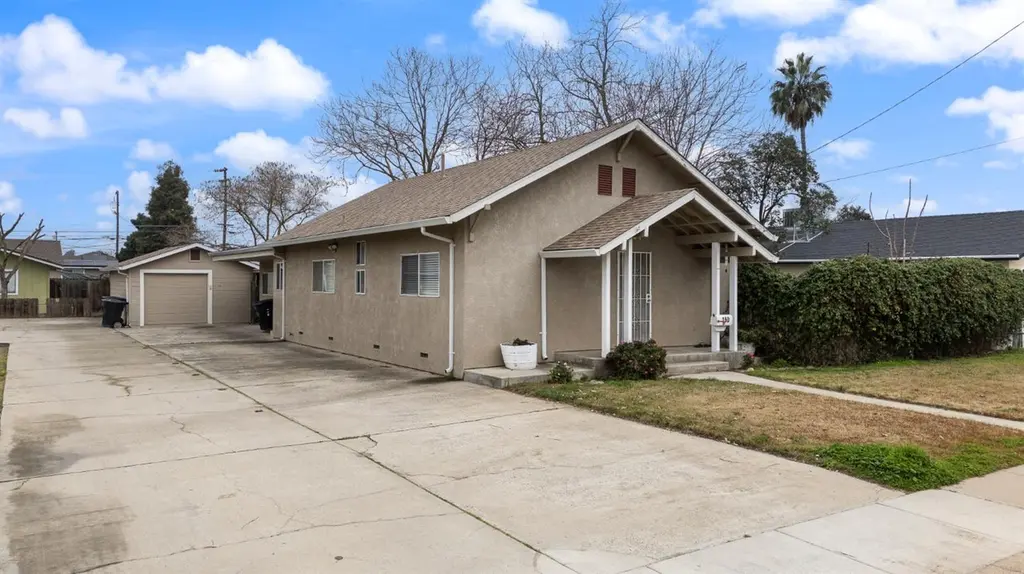
150 N Acacia · Ripon, CA
Flood risk 1/10 · Minimal
- FEMA flood zone
- X (unshaded)
- Chance of flooding over 30 yrs
- 0.0%
- Est. flood insurance / yr
- $507 – $1,088
Fire risk 6/10 · Moderate
- Est. fire insurance / yr
- $659 – $1,223
Heat risk 7/10 · Major
- Hot days now (above 102°F)
- 7 days/yr
- Hot days in 30 yrs
- 16 days/yr
Wind risk 1/10 · Minimal
- Chance of severe wind over 30 yrs
- —
Air-quality risk 10/10 · Severe
- Unhealthy air days now
- 27 days/yr
- Unhealthy air days in 30 yrs
- 29 days/yr
Risk factors via First Street. Map © Google.
Why this score? — see what drove the D grade
The composite is a weighted blend of 9 inputs, each scored 0–100. Each bar is that input's sub-score; the figure is the points it added to the 100-point composite (weight × sub-score).
- ARV discount +15.0/15.0
- Cash flow +11.3/30.0
- Schools +4.8/10.0
- DSCR +3.3/10.0
- Livability +3.0/5.0
- Rent growth +2.5/5.0
- Condition / age +2.5/5.0
- 1% rule +2.2/10.0
- Appreciation +0.0/10.0
$925,000
🖨 Deal sheet (PDF) 📄 Offer letter ✓ Due diligence
Multi-family units
County records classify this as Multi-Family (2-4 Unit). Listing-text estimate: 1 unit. estimate disagrees with records
Listing remarks
Exceptional opportunity to own a rare 3-unit property in the heart of Ripon! Currently grossing $5,800 per month! Ideally located with the elementary and high schools directly across the street and within walking distance to downtown Ripon, this versatile property offers strong rental appeal, long-term appreciation, and an ideal setup for owner-occupancy. The property consists of a single-story single-family residence plus a duplex, totaling three units. Unit 1 is a spacious 3-bedroom, 2-bath home offering approximately 1,500 square feet of living space. This home features updated luxury vinyl plank flooring throughout the main living areas, updated ceiling fans, and a remodeled kitchen wit
Key facts
- Remodeled kitchen
- Private side yard
- Private yard space
Tags
Neighborhood map
What this means for you Summary
Snapshot
- This is a 21-bed/12.0-bath multifamily listed at $925k.
Deal economics
- At list price, monthly cash flow is $-344 ($-4k/yr) — negative.
- To cash-flow at today's rent, offer at most $864k (6.6% below list).
- To meet the 1% rule (rent ≥ 1% of price), the offer needs to be $669k (27.7% below list).
- Recommended offer: $669k (27.7% below list) — sets the bar for 1% rule.
- Cap rate 5.8% vs local median 2.1% in Ripon — top-decile yield for the area; either an underpriced asset or a hidden risk that comps aren't pricing in. Stress-test before assuming the spread holds.
Location & tenants
- Location reads 60/100 on livability (#579 in CA) — a middle-class / working-renter tenant base. Strengths: employment A+, housing A+, crime A; Watch: amenities F, commute F, cost of living F.
- Ripon Unified (suburban): math 46% / reading 60% proficiency, ranked #106 of 517 in CA (top 20%) — acceptable for families but not a draw, mixed tenant base, ~2y average lease.
- Zoned schools: Ripona Elementary (math 24% / reading 36%, grade F, #834 of 1,571 statewide, top 54%, 480 students, 48% FRL); Ripon High (math 42% / reading 62%, grade D+, #296 of 1,170 statewide, top 27%, 998 students, 28% FRL).
- Zoned-school proficiency averages 41% at this address vs 53% district-wide (-12 pts) — the specific schools serving this property underperform the Ripon Unified average; the district grade overstates school quality for this exact location.
- Market conditions: 81 active listings in the ZIP; high-income renter base; 3,779 units permitted in San Joaquin County in 2024 (0 in 5+ unit buildings).
Forward outlook
- Local home prices are declining (-3.0%/yr); year-one equity from $6k of loan paydown is wiped out by about $28k of value loss. Plan a longer hold.
- San Joaquin County population projected at +17% by 2050 — long-run rental-demand tailwind backs the buy-and-hold thesis.
Negotiation context
- It's been on market 146 days — a 12% lower offer ($814k) is reasonable based on typical stale-listing flexibility.
- 2 sale attempts; this cycle's ask is 37655% above the opening price — seller raised mid-cycle; expect resistance to lowballs.
- Current owner paid $278k; list at $925k implies a 233% gain — meaningful room to come down on a strong offer.
Risks & watch-outs
- Watch-outs: built in 1917 — expect roof / HVAC / electrical / plumbing capex.
- Climate carrying-cost: major wildfire risk; extreme-heat days projected 7→16/yr by 2055 (HVAC capex compounding) — expect insurance premiums to compound above CPI over the hold.
Questions for the listing agent
- What do current leases actually rent for vs. the listed asking? Can we see a recent rent roll and the last 12 months of T-12 income?
- It's been on market 146 days. Have you received any prior offers? Is the seller open to a 28% concession, seller financing, or rate buy-down credit?
- Built in 1917 — when were the roof, HVAC, electrical panel, plumbing, and water heater last replaced?
- Why hasn't it sold? Are there any deal-killer items the seller is aware of (foundation, flood, title, zoning, code violations)?
- Is there a deadline driving the sale (1031 exchange, divorce, estate, relocation)? That informs how much negotiation room exists.
- Schools are A-rated — typically a magnet for longer-tenancy family renters. What's the average tenant stay here, and is there a school-zone premium baked into asking?
- The area grade is low — what's the realistic commute time and amenity access for the typical tenant pool here? Any planned neighborhood developments (good or bad) we should know about?
- What's the average days-on-market for RENTAL listings here right now (not sales)? A rising rental-DOM trend means longer vacancies and softer asking-rent achievability than the comps imply.
- What's the recent tenant-quality profile in this submarket — average credit score on applications, eviction rate, late-payment / NSF rate, and stable-employment percentage? A property-management company in the area should have these aggregated.
- How much new apartment / multifamily construction is in the pipeline within 1–3 miles? Heavy new supply (>2% of stock underway) typically softens rents 12–24 months out; light construction supports rent growth.
Investment metrics
- 1% rule
- 0.72% ✗
- Cap rate
- 5.85%
- Cash-on-cash
- -1.59%
- DSCR
- 0.93
- GRM
- 11.5
CMA / ARV
- ARV (median comp)
- $1,233,409
- List price
- $925,000
- Delta
- -25.00%
- Verdict
- UNDERPRICED
- Comps
- 2 within 2.0 mi
Projected returns pro-forma
-3.0% appreciation · 3.0% rent growth · sell at horizon
- IRR
- -19.0%
- Equity multiple
- 0.34×
- Total profit
- $-172,172
- Equity at exit
- $137,921
- IRR
- -11.6%
- Equity multiple
- 0.31×
- Total profit
- $-179,643
- Equity at exit
- $79,977
Cash invested: $259,000 (down + closing). Projections, not guarantees.
Landlord ↔ Tenant lean methodology
- Overall (STATE)
- 18 Strongly Tenant-Friendly
- State California
- 18 Strongly Tenant-Friendly · D+13
- County
- — inherits STATE
- City
- — inherits STATE
ZIP-level market 95366
- Active inventory
- 81
- Price-to-rent
- 32.4×
Monthly cashflow live
- Estimated rent
- $6,686 high interval (Pro) →
- Mortgage (P&I)
- −$4,851
- Tax from tax record
- −$390 /mo · $4,677/yr
- Insurance
- −$385
- HOA
- −$0
- Vacancy / Maint / Mgmt
- −$1,404
- Net cashflow
- $-344
Break-even live
Sensitivity live
| Price | -10% $180 | -5% $-82 | +0% $-344 | +5% $-606 | +10% $-868 |
|---|---|---|---|---|---|
| Rent | -10% $-872 | -5% $-608 | +0% $-344 | +5% $-80 | +10% $184 |
| Rate | -1.0pp $122 | -0.5pp $-109 | base $-344 | +0.5pp $-584 | +1.0pp $-828 |
3-unit breakdown (identical units grouped — click to expand)
| Units | Beds | Baths | Est. rent |
|---|---|---|---|
| 1× unit | 3 | 2 | $2,377 |
| 2× units | 2 | 1 | $4,310 |
| #2 | 2 | 1 | $2,155 |
| #3 | 2 | 1 | $2,155 |
| Total (3 units) | $6,686 | ||
UW: 25.0% down · 7.5% · 30yr · 1.5% tax · 5.0% vac · 8.0% maint · 8.0% mgmt
Financing live
Cash to close
- Down payment
- $231,250
- Closing costs
- $27,750
- Reserves months
- —
- Total cash needed
- —
Loan-product check · same deal, 3 products live
Conventional
25% down · 7.5% · 30yr
- Down + closing
- —
- Monthly P&I
- —
- Monthly cashflow
- —
- DSCR
- —
- Eligible?
- —
Personal DTI + credit; lowest rate.
DSCR
20% down · 8.5% · 30yr
- Down + closing
- —
- Monthly P&I
- —
- Monthly cashflow
- —
- DSCR
- —
- Eligible?
- —
No personal income docs; deal must DSCR.
Hard money
10% down · 12.0% · 12mo
- Down + closing
- —
- Monthly P&I
- —
- Monthly cashflow
- —
- DSCR
- —
- Eligible?
- —
Short-term bridge; refi at stabilization.
Listing history 18 events
-
2026-06-15statusdays on market $925,000 Pending 146 DOM
-
2026-06-14days on market $925,000 Active 145 DOM
-
2026-06-13days on market $925,000 Active 144 DOM
-
2026-06-10days on market $925,000 Active 142 DOM
-
2026-06-09days on market $925,000 Active 141 DOM
-
2026-06-08days on market $925,000 Active 140 DOM
-
2026-06-07days on market $925,000 Active 139 DOM
-
2026-06-05days on market $925,000 Active 136 DOM
-
2026-06-03days on market $925,000 Active 135 DOM
-
2026-06-03days on market $925,000 Active 134 DOM
-
2026-06-01days on market $925,000 Active 133 DOM
-
2026-05-31days on market $925,000 Active 132 DOM
-
2026-01-05historical $2,450
-
2025-11-20$2,450
-
2025-04-11historical $1,750
-
2025-03-19$1,750
-
2022-12-20historical
-
2001-12-11soldstatus $278,000
ⓘ Source: listings_history table (triggers on properties + properties_extension) + one-shot
backfill from property_details.listing_events for pre-trigger history.
Tax reassessment forecast CA · Resets to sale price
- Current annual tax
- $4,677 · $390/mo
- Projected year-2 tax
- $7,030 · $586/mo
- Expected delta
- +$2,353/yr (+$196/mo · 50.3%)
ⓘ Screening estimate from a state-policy table — verify with the county assessor before closing.
Climate risk First Street
- Flood 1/10 Low FEMA zone X (unshaded) · 0% chance over 30 yrs
- Wildfire 6/10 Major
- Heat 7/10 Severe 7 d/yr ≥102°F today · 16 d/yr by 30 yrs out
- Wind 1/10 Low
- Air quality 10/10 Extreme 27 unhealthy d/yr today · 29 by 30 yrs out
Nearby sold comps map
Loading sold comps map…
Walkable amenities ~0.75 mi
Loading nearby amenities…
Taxation est. · year 1
- Rental income
- $80,232
- − Mortgage interest
- −$51,814
- − Property taxes
- −$4,677
- − Insurance
- −$4,625
- − Repairs & maintenance
- −$6,419
- − Management
- −$6,419
- − Depreciation
- −$26,909
- Taxable loss
- −$20,631
- Est. tax savings @ 24.0%
- +$4,951
- After-tax cash flow
- $823/yr
For passive investors: Depreciation is non-cash, so a rental often shows a tax loss while cash-flowing — sheltering income. Rental losses are passive: they offset passive income freely, and up to $25,000/yr can offset ordinary (W-2) income if you actively participate and your MAGI is under $100k (phasing out to $0 by $150k); unused losses carry forward. On sale, claimed depreciation is recaptured at up to 25%, and gains may owe capital-gains tax (a 1031 exchange can defer both). Figures are a year-1 estimate at your 24.0% rate — not tax advice; consult a CPA.
Schools (NCES district)
- District
- Ripon Unified
- NCES district ID
- 0632880
- Math proficiency
- 46% ▼ -5.00%
- Reading proficiency
- 60% ▼ -7.00%
- Median HH income
- $75,364
- Composite
- 47.64/100
- National rank
- #2249
- State rank
- #106 of 517 in CA
Livability — Ripon
- Score
- 60/100
- State rank
- #579
- US rank
- #18838
Category grades
Schools grade is shown separately in the Schools card above.
Census & demographics
- Census place
- Ripon, CA
- County
- San Joaquin County · 729,570 people
- City population
- 18,954
- Metro
- Stockton, CA
- Population (ZIP)
- 18,954
- Household income
- $112,097
- Rent vs Own
- Severe rent burden
- 511.0
Population outlook (San Joaquin County) Hauer SSP2
- Today (2025)
- 796,965 people
- By 2030
- 828,849 · +4.0%
- By 2040
- 885,611 · +11.1%
- By 2050
- 929,798 · +16.7%
- By 2075
- 994,578 · +24.8%
- By 2100
- 971,291 · +21.9%
Race, ethnicity, and origin ACS 2023
- Neighborhood character
- Majority White (65%)
- Race & ethnicity
- White 65% Hispanic / Latino 25% Two or more races 13% Asian 5% Black 1%
- Hispanic origin (detail)
- Mexican 21%
- Common ancestry
- Iranian 8% Russian 5% Lithuanian 3%
- Foreign-born
- 8% · Canada, China, Vietnam
- Languages at home
- 84% English-only · Spanish 10% Other Indo-European 3% Chinese 1%
Political lean MEDSL · San Joaquin
- 2024 margin
- Toss-up / Even · D 48.0% · R 48.9% · Other 3.0%
- 2008→2024 swing
- -11.6pp toward R · 2008: 10.7pp · 2024: -0.9pp
- All cycles
- 2024: R+0.9 2020: D+13.9 2016: D+12.9 2012: D+8.9 2008: D+10.7
Not yet ingested
- Civics
- —
Market trends
- HPI YoY
- ▼ -160.97%
- Current HPI
- 288.2777
- Rent YoY
- —
- Metro
- Stockton, CA
- State GDP YoY
- ▲ 3.21%
- F500 in state
- 116
Industry mix (Fortune 500 HQ in CA)
| Industry | F500 HQs | Revenue |
|---|---|---|
| Technology | 27 | $1,492B |
|
||
| Financial Services | 3 | $174B |
|
||
| Retail | 3 | $44B |
|
||
| Insurance | 3 | $26B |
|
||
| Media / Entertainment | 2 | $115B |
|
||
| Pharmaceuticals / Biotech | 2 | $62B |
|
||
Price history
-99.1% since first listed6 events — show timeline
- 2026-01-05 Rental Removed $2,450 APPFOLIO
- 2025-11-20 Listed for Rent $2,450 APPFOLIO
- 2025-04-11 Rental Removed $1,750 APPFOLIO
- 2025-03-19 Listed for Rent $1,750 APPFOLIO
- 2022-12-20 Rental Removed — RENT.
- 2001-12-11 Sold (Public Records) $278,000 Public Records
Property tax history
+1.5%/yrLatest (2025): $4,677 · +1.6% YoY. Source: county tax records.
Cash-flow waterfall
monthlySold comps — $/sqft
last 12 mo · ≤1 miLoading sold comps…