 12-Plex
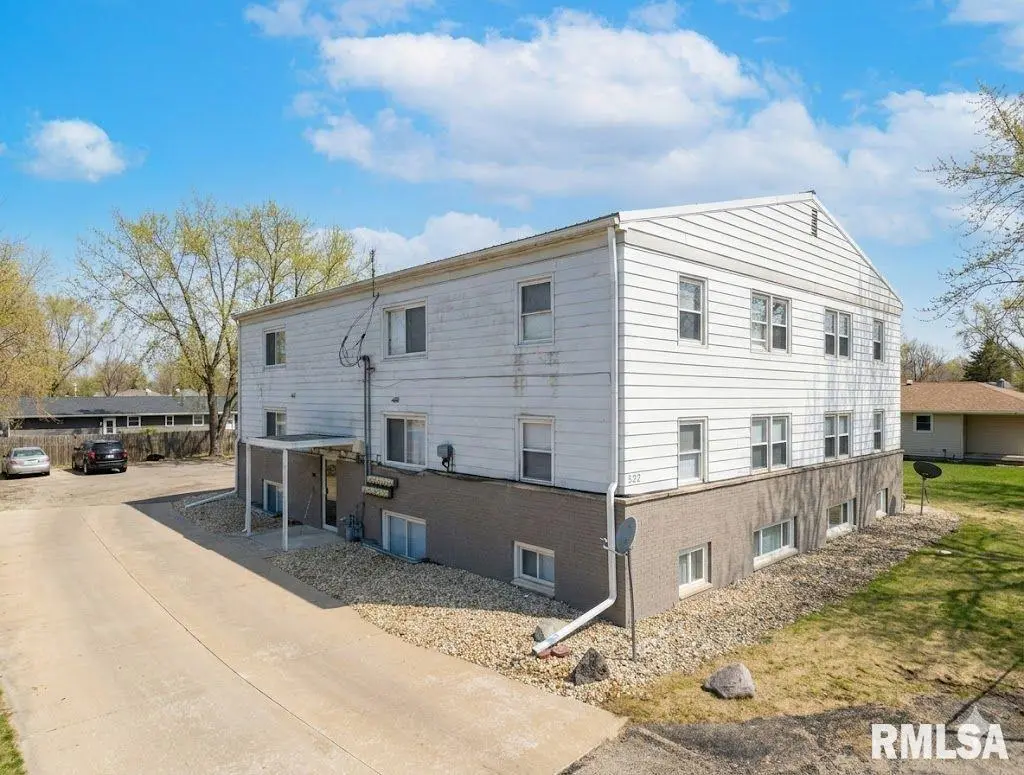
522 N Main St · Hanna City, IL
Flood risk No data
- FEMA flood zone
- —
- Chance of flooding over 30 yrs
- —
- Est. flood insurance / yr
- —
Fire risk No data
- Est. fire insurance / yr
- —
Heat risk No data
- Hot days now (above threshold)
- —
- Hot days in 30 yrs
- —
Wind risk No data
- Chance of severe wind over 30 yrs
- —
Air-quality risk No data
- Unhealthy air days now
- —
- Unhealthy air days in 30 yrs
- —
Risk factors via First Street. Map © Google.
Why this score? — see what drove the B- grade
The composite is a weighted blend of 9 inputs, each scored 0–100. Each bar is that input's sub-score; the figure is the points it added to the 100-point composite (weight × sub-score).
- Cash flow +29.6/30.0
- DSCR +10.0/10.0
- 1% rule +8.3/10.0
- ARV discount +7.5/15.0
- Condition / age +3.8/5.0
- Livability +3.2/5.0
- Rent growth +2.5/5.0
- Schools +2.3/10.0
- Appreciation +0.0/10.0
$720,000
🖨 Deal sheet 📄 Offer letter ✓ Due diligence
Multi-family units
County records classify this as Multi-Family (5+ Unit). Listing-text estimate: 12 units. confirmed
5+ unit building — per-unit beds/baths from public records are typically unavailable; the breakdown below (if shown) is an estimate from the listing text.
Listing remarks MLS
This 12 unit apartment building is located in Hanna City, about 10 miles west of Peoria near the Peoria International Airport, has had the units completely renovated or updated and is ready for a new owner to maximize the investment, rents and returns. Odd number units are 1 Bedroom/1 Bathroom, and even numbered units are 2 Bedroom/1 Bathroom. Recent updates other than renovating units include - boiler hot water lines and parts - 2024/2025, new main water line installed from street to building 2023, new sewer clean out 2023, new water heater - 2024. Currently there is one vacant unit (#2), and once rented total monthly rents will be at least $8545. Building is in the Village TIF District and Business Development District (BDD) that provide incentives for improvements (see Village of Hanna City website for details).
Key facts
- New main water line
- New sewer clean out
- New water heater
Tags
Neighborhood map
What this means for you Summary
Snapshot
- This is a 6×1bd/1ba + 6×2bd/1ba units multifamily listed at $720k. Condition is rated good.
Deal economics
- At list price, monthly cash flow is $3k ($31k/yr) — positive. Per door: $217/mo.
- The deal already cash-flows at list — no discount required.
- Meets the 1% rule at list price ($10k rent vs $720k).
- Recommended offer: $677k (6.0% below list) — sets the bar for market timing.
Location & tenants
- Location reads 65/100 on livability (#614 in IL) — a middle-class / working-renter tenant base. Strengths: crime A+, cost of living A+, housing A+; Watch: schools F, amenities F, commute F.
- Farmington Central CUSD 265 (rural): math 23% / reading 29% proficiency, ranked #293 of 620 in IL (top 47%) — low school quality limits family demand, transient renter base, plan for 1-2y turnover.
- Market conditions: 9 active listings in the ZIP; 73 units permitted in Peoria County in 2024 (0 in 5+ unit buildings).
Forward outlook
- Local home prices are declining (-3.0%/yr); year-one equity from $5k of loan paydown is wiped out by about $22k of value loss. Plan a longer hold.
- Peoria County population projected at -11% by 2050 — secular population decline; favor cash flow + early exit over multi-decade hold.
- At projected returns (-3.0% appreciation + 3.0% rent growth), your $202k cash investment doubles in ~8 years — after that, you're playing with house money.
Negotiation context
- It's been on market 76 days — a 6% lower offer ($677k) is reasonable based on typical stale-listing flexibility.
- 2 sale attempts since 20y ago; this cycle's ask has dropped $50k (6%) from the opening price — seller is motivated, your offer sets the floor, not the list.
- Current owner paid $225k; list at $720k implies a 220% gain — meaningful room to come down on a strong offer.
Questions for the listing agent
- It's been on market 76 days. Have you received any prior offers? Is the seller open to a 6% concession, seller financing, or rate buy-down credit?
- Can we see the unit-by-unit rent roll, current vacancy, and any below-market leases? What's the average tenancy length?
- What capital expenditures (roof, boiler, parking lot, exteriors) have been made in the last 5 years, and what's planned in the next 2?
- Built in 1967 — when were the roof, HVAC, electrical panel, plumbing, and water heater last replaced?
- Why hasn't it sold? Are there any deal-killer items the seller is aware of (foundation, flood, title, zoning, code violations)?
- Is there a deadline driving the sale (1031 exchange, divorce, estate, relocation)? That informs how much negotiation room exists.
- Schools are F-rated, which usually means shorter tenancies and higher turnover. Who's the typical renter profile here, and what's been the actual vacancy rate?
- What's the average days-on-market for RENTAL listings here right now (not sales)? A rising rental-DOM trend means longer vacancies and softer asking-rent achievability than the comps imply.
- What's the recent tenant-quality profile in this submarket — average credit score on applications, eviction rate, late-payment / NSF rate, and stable-employment percentage? A property-management company in the area should have these aggregated.
- How much new apartment / multifamily construction is in the pipeline within 1–3 miles? Heavy new supply (>2% of stock underway) typically softens rents 12–24 months out; light construction supports rent growth.
Investment metrics
- 1% rule
- 1.33% ✓
- Cap rate
- 10.63%
- Cash-on-cash
- 15.47%
- DSCR
- 1.69
- GRM
- 6.3
CMA / ARV
No comps found within radius.
Projected returns pro-forma
-3.0% appreciation · 3.0% rent growth · sell at horizon
- IRR
- 6.2%
- Equity multiple
- 1.24×
- Total profit
- $49,041
- Equity at exit
- $107,354
- IRR
- 15.6%
- Equity multiple
- 2.27×
- Total profit
- $256,485
- Equity at exit
- $62,252
Cash invested: $201,600 (down + closing). Projections, not guarantees.
Landlord ↔ Tenant lean methodology
- Overall (STATE)
- 43 Moderately Tenant-Leaning
- State Illinois
- 43 Moderately Tenant-Leaning · D+7
- County
- — inherits STATE
- City
- — inherits STATE
ZIP-level market 61536
- Home prices YoY
- -13.3%
- Active inventory
- 9
- Price-to-rent
- 74.3×
Monthly cashflow live
- Estimated rent
- $9,589 medium interval (Pro) →
- Mortgage (P&I)
- −$3,776
- Tax est. 1.5%
- −$900 /mo · $10,800/yr
- Insurance
- −$300
- HOA
- −$0
- Vacancy / Maint / Mgmt
- −$2,014
- Net cashflow
- $2,600
Break-even live
12-unit breakdown (identical units grouped — click to expand)
| Units | Beds | Baths | Est. rent |
|---|---|---|---|
| 6× units | 1 | 1 | $4,842 |
| #1 | 1 | 1 | $807 |
| #2 | 1 | 1 | $807 |
| #3 | 1 | 1 | $807 |
| #4 | 1 | 1 | $807 |
| #5 | 1 | 1 | $807 |
| #6 | 1 | 1 | $807 |
| 6× units | 2 | 1 | $4,746 |
| #7 | 2 | 1 | $791 |
| #8 | 2 | 1 | $791 |
| #9 | 2 | 1 | $791 |
| #10 | 2 | 1 | $791 |
| #11 | 2 | 1 | $791 |
| #12 | 2 | 1 | $791 |
| Total (12 units) | $9,589 | ||
UW: 25.0% down · 7.5% · 30yr · 1.5% tax · 5.0% vac · 8.0% maint · 8.0% mgmt
Financing live
Cash to close
- Down payment
- $180,000
- Closing costs
- $21,600
- Reserves months
- —
- Total cash needed
- —
Loan-product check · same deal, 3 products live
Conventional
25% down · 7.5% · 30yr
- Down + closing
- —
- Monthly P&I
- —
- Monthly cashflow
- —
- DSCR
- —
- Eligible?
- —
Personal DTI + credit; lowest rate.
DSCR
20% down · 8.5% · 30yr
- Down + closing
- —
- Monthly P&I
- —
- Monthly cashflow
- —
- DSCR
- —
- Eligible?
- —
No personal income docs; deal must DSCR.
Hard money
10% down · 12.0% · 12mo
- Down + closing
- —
- Monthly P&I
- —
- Monthly cashflow
- —
- DSCR
- —
- Eligible?
- —
Short-term bridge; refi at stabilization.
Listing history 21 events
-
2026-06-18days on market $720,000 Active 76 DOM
-
2026-06-17days on market $720,000 Active 75 DOM
-
2026-06-16days on market $720,000 Active 74 DOM
-
2026-06-15days on market $720,000 Active 73 DOM
-
2026-06-13days on market $720,000 Active 71 DOM
-
2026-06-12days on market $720,000 Active 70 DOM
-
2026-06-09days on market $720,000 Active 67 DOM
-
2026-06-08days on market $720,000 Active 66 DOM
-
2026-06-07days on market $720,000 Active 65 DOM
-
2026-06-04days on market $720,000 Active 61 DOM
-
2026-06-02days on market $720,000 Active 60 DOM
-
2026-06-01days on market $720,000 Active 59 DOM
-
2026-05-31days on market $720,000 Active 58 DOM
-
2026-05-31days on market $720,000 Active 57 DOM
-
2026-05-04price $720,000 829-char remark
Show marketing remark (829 chars)
This 12 unit apartment building is located in Hanna City, about 10 miles west of Peoria near the Peoria International Airport, has had the units completely renovated or updated and is ready for a new owner to maximize the investment, rents and returns. Odd number units are 1 Bedroom/1 Bathroom, and even numbered units are 2 Bedroom/1 Bathroom. Recent updates other than renovating units include - boiler hot water lines and parts - 2024/2025, new main water line installed from street to building 2023, new sewer clean out 2023, new water heater - 2024. Currently there is one vacant unit (#2), and once rented total monthly rents will be at least $8545. Building is in the Village TIF District and Business Development District (BDD) that provide incentives for improvements (see Village of Hanna City website for details).
-
2026-01-30$770,000 Active 829-char remark
Show marketing remark (829 chars)
This 12 unit apartment building is located in Hanna City, about 10 miles west of Peoria near the Peoria International Airport, has had the units completely renovated or updated and is ready for a new owner to maximize the investment, rents and returns. Odd number units are 1 Bedroom/1 Bathroom, and even numbered units are 2 Bedroom/1 Bathroom. Recent updates other than renovating units include - boiler hot water lines and parts - 2024/2025, new main water line installed from street to building 2023, new sewer clean out 2023, new water heater - 2024. Currently there is one vacant unit (#2), and once rented total monthly rents will be at least $8545. Building is in the Village TIF District and Business Development District (BDD) that provide incentives for improvements (see Village of Hanna City website for details).
-
2022-05-19price $795
-
2021-08-06historical
-
2021-08-06historical
-
2006-07-26$225,000
-
2006-07-17soldstatus $225,000
ⓘ Source: listings_history table (triggers on properties + properties_extension) + one-shot
backfill from property_details.listing_events for pre-trigger history.
Nearby sold comps map
Loading sold comps map…
Walkable amenities ~0.75 mi
Loading nearby amenities…
Taxation est. · year 1
- Rental income
- $115,068
- − Mortgage interest
- −$40,331
- − Property taxes
- −$10,800
- − Insurance
- −$3,600
- − Repairs & maintenance
- −$9,205
- − Management
- −$9,205
- − Depreciation
- −$20,945
- Taxable income
- $20,980
- Est. tax owed @ 24.0%
- −$5,035
- After-tax cash flow
- $26,159/yr
For passive investors: Depreciation is non-cash, so a rental often shows a tax loss while cash-flowing — sheltering income. Rental losses are passive: they offset passive income freely, and up to $25,000/yr can offset ordinary (W-2) income if you actively participate and your MAGI is under $100k (phasing out to $0 by $150k); unused losses carry forward. On sale, claimed depreciation is recaptured at up to 25%, and gains may owe capital-gains tax (a 1031 exchange can defer both). Figures are a year-1 estimate at your 24.0% rate — not tax advice; consult a CPA.
Condition & rehab AI · 12 photos
This 12-unit apartment building is in good condition with recent updates and is ready for a new owner to maximize investment and returns.
Value-add opportunities
- Both Painting exterior and interior walls — Enhances curb appeal and interior aesthetics.
- Both Landscaping improvements — Enhances curb appeal and property value.
- Both New flooring in common areas — Improves aesthetics and functionality of common areas.
- Both New lighting fixtures — Enhances safety and aesthetics of common areas.
Renovation cost estimate screening
Value-add ROI direction
- Both Painting exterior and interior walls — Enhances curb appeal and interior aesthetics. ↑
- Both Landscaping improvements — Enhances curb appeal and property value. ↑
- Both New flooring in common areas — Improves aesthetics and functionality of common areas. ↑
- Both New lighting fixtures — Enhances safety and aesthetics of common areas. ↑
ⓘ Cost ranges are severity-bucket heuristics (US national rule-of-thumb). Get contractor quotes + a written scope before underwriting a rehab budget.
Schools (NCES district)
- District
- Farmington Central CUSD 265
- NCES district ID
- 1700044
- Math proficiency
- 23% ▼ -8.00%
- Reading proficiency
- 29% ▼ -11.00%
- Median HH income
- $54,785
- Composite
- 23.33/100
- National rank
- #7914
- State rank
- #293 of 620 in IL
Livability — Hanna City
- Score
- 65/100
- State rank
- #614
- US rank
- #12624
Category grades
Schools grade is shown separately in the Schools card above.
Census & demographics
- Census place
- Hanna City, IL
- City population
- 3,445
- Population (ZIP)
- 3,445
Population outlook (Peoria County) Hauer SSP2
- Today (2025)
- 183,007 people
- By 2030
- 179,643 · -1.8%
- By 2040
- 171,782 · -6.1%
- By 2050
- 163,508 · -10.7%
- By 2075
- 140,178 · -23.4%
- By 2100
- 114,493 · -37.4%
Race, ethnicity, and origin ACS 2023
- Neighborhood character
- Predominantly White (88%)
- Race & ethnicity
- White 88% Black 5% Two or more races 3% Hispanic / Latino 3% Asian 2%
- Common ancestry
- Slovak 5% Italian 4% Lithuanian 2%
- Foreign-born
- 3% · Canada, Philippines
- Languages at home
- 98% English-only · Spanish 2% Other Asian/Pacific 1%
Political lean MEDSL · Peoria
- 2024 margin
- Toss-up / Even · D 51.5% · R 46.9% · Other 1.6%
- 2008→2024 swing
- -9.2pp toward R · 2008: 13.9pp · 2024: 4.7pp
- All cycles
- 2024: D+4.7 2020: D+6.3 2016: D+2.8 2012: D+4.4 2008: D+13.9
Not yet ingested
- Civics
- —
Market trends
- HPI YoY
- ▼ -31.72%
- Current HPI
- 207.0938
- Rent YoY
- —
- Metro
- —
- State GDP YoY
- ▲ 1.59%
- F500 in state
- 60
Industry mix (Fortune 500 HQ in IL)
| Industry | F500 HQs | Revenue |
|---|---|---|
| Insurance | 4 | $201B |
|
||
| Consumer Goods | 4 | $87B |
|
||
| Industrial Machinery | 3 | $64B |
|
||
| Healthcare | 2 | $55B |
|
||
| Retail / Pharmacy | 1 | $148B |
|
||
| Agriculture / Food | 1 | $86B |
|
||
Price history
+220.0% since first listed7 events — show timeline
- 2026-05-04 Price Changed $720,000 RMLSA as Distributed by MLS Grid
- 2026-01-30 Listed $770,000 RMLSA as Distributed by MLS Grid
- 2022-05-19 Price Changed $795 RENT.
- 2021-08-06 Listing Removed — RMLSA as Distributed by MLS Grid
- 2021-08-06 Listing Removed — RMLSA as Distributed by MLS Grid
- 2006-07-26 Listed $225,000 RMLSA as Distributed by MLS Grid
- 2006-07-17 Sold (MLS) $225,000 RMLSA as Distributed by MLS Grid
Cash-flow waterfall
monthlySold comps — $/sqft
last 12 mo · ≤1 miLoading sold comps…