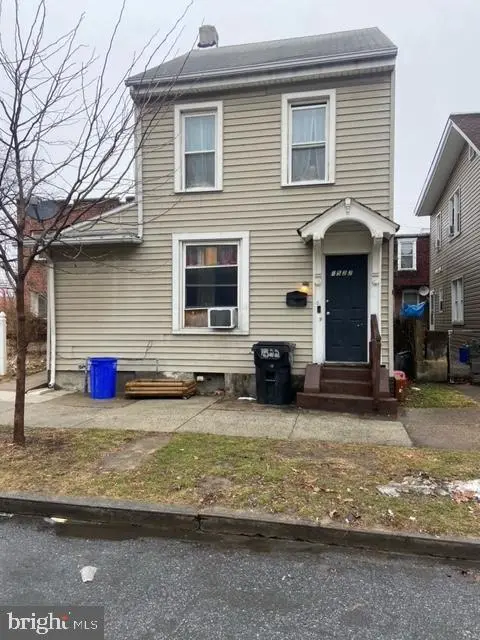
1522 Vernon St · Harrisburg, PA
Flood risk 1/10 · Minimal
- FEMA flood zone
- X (unshaded)
- Chance of flooding over 30 yrs
- 0.0%
- Est. flood insurance / yr
- $473 – $860
Fire risk 1/10 · Minimal
- Est. fire insurance / yr
- $511 – $949
Heat risk 5/10 · Moderate
- Hot days now (above 100°F)
- 7 days/yr
- Hot days in 30 yrs
- 15 days/yr
Wind risk 3/10 · Minor
- Chance of severe wind over 30 yrs
- 6.0%
Air-quality risk 2/10 · Minimal
- Unhealthy air days now
- 1 days/yr
- Unhealthy air days in 30 yrs
- 3 days/yr
Risk factors via First Street. Map © Google.
Why this score? — see what drove the B grade
The composite is a weighted blend of 9 inputs, each scored 0–100. Each bar is that input's sub-score; the figure is the points it added to the 100-point composite (weight × sub-score).
- Cash flow +30.0/30.0
- ARV discount +12.1/15.0
- 1% rule +10.0/10.0
- DSCR +10.0/10.0
- Livability +4.2/5.0
- Rent growth +3.6/5.0
- Condition / age +2.5/5.0
- Schools +0.8/10.0
- Appreciation +0.0/10.0
$110,000
🖨 Deal sheet 📄 Offer letter ✓ Due diligence
Listing remarks MLS
Schedule your showing today for this detached home with a completely remodeled kitchen with new counter tops and cabinets, completely remodeled bath with tile shower, and all new windows. The entire house has been painted and new laminate flooring has been installed. The furnace has been serviced and a new hot water heater has been installed as well. Large bedrooms with a large enclosed porch make this property a must see!
Key facts
- Built 1870
- Listed 20 days
Property features AI
Finance
- Other: Fee simple ownership
Exterior
- Parking: On-street parking
- Utilities: Public water; Public sewer; Electric service with circuit breakers; Natural gas heat and hot water
- Home design: Detached structure; Frame construction
- Construction: Frame construction; Brick/mortar foundation; Fiberglass and asphalt roof
- Exterior features: Cleared lot; Balcony; Above-grade and below-grade structures noted
Interior
- Kitchen: Gas oven/range; Refrigerator
- Bedrooms: One bedroom on the main level; Two bedrooms on the first upper level; One bedroom on the second upper level
- Bathrooms: One full bathroom
- Heating & cooling: Forced air heating; Electric cooling (electric as cooling fuel); Natural gas hot water
- Interior features: Dining area; Full basement
- Laundry & utility: In-home laundry hookups
Neighborhood map
What this means for you Summary
Snapshot
- This is a 4-bed/1.0-bath single-family listed at $110k.
Deal economics
- At list price, monthly cash flow is $508 ($6k/yr) — positive.
- The deal already cash-flows at list — no discount required.
- Meets the 1% rule at list price ($2k rent vs $110k).
- Recommended offer: $108k (1.5% below list) — sets the bar for market timing.
- Cap rate 11.8% vs local median 6.6% in Harrisburg — top-decile yield for the area; either an underpriced asset or a hidden risk that comps aren't pricing in. Stress-test before assuming the spread holds.
Location & tenants
- Location reads 84/100 on livability (#107 in PA, #826 nationally) — a professional / high-income tenant draw. Strengths: amenities A+, commute A+, cost of living A+; Watch: employment D, crime F.
- Harrisburg City SD (urban): math 6% / reading 13% proficiency, ranked #535 of 539 in PA (top 99%) — low school quality limits family demand, transient renter base, plan for 1-2y turnover; 82% free/reduced lunch — lower-income household profile, screen leases tightly.
- Zoned schools: Harrisburg Hs (math 24% / reading 10%, grade F, #399 of 437 statewide, top 92%, 1,230 students, 100% FRL) — zoned schools average 100% FRL vs 82% district-wide (18 pts higher); higher-poverty schools than district average — tighter screening recommended.
- Market conditions: Rents rising fast (+4.4%/yr); 67 active listings in the ZIP; 28 comparable units currently listed for rent nearby; rentals at typical pace (median 24d on market — plan ~3-4 weeks tenant-placement turnaround); 43% of comp listings sitting > 30 days — soft ceiling on asking rent; 540 units permitted in Dauphin County in 2024 (194 in 5+ unit buildings).
- This rent runs 43% of the median local income ($47k/yr) — at the standard rent-burdened threshold; future hikes will face affordability resistance.
Forward outlook
- Local home prices are declining (-3.0%/yr); year-one equity from $761 of loan paydown is wiped out by about $3k of value loss. Plan a longer hold.
- At projected returns (-3.0% appreciation + 4.4% rent growth), your $31k cash investment doubles in ~6 years — after that, you're playing with house money.
Negotiation context
- It's been on market 20 days — a 2% lower offer ($108k) is reasonable based on typical stale-listing flexibility.
- 3 sale attempts since 13y ago with the ask held roughly flat each time — persistent listings suggest the price (not the market) is what's stuck; bring a comps-based counter.
Risks & watch-outs
- Watch-outs: built in 1870 — expect roof / HVAC / electrical / plumbing capex.
- Climate carrying-cost: extreme-heat days projected 7→15/yr by 2055 (HVAC capex compounding) — expect insurance premiums to compound above CPI over the hold.
Questions for the listing agent
- Built in 1870 — when were the roof, HVAC, electrical panel, plumbing, and water heater last replaced?
- Is there a deadline driving the sale (1031 exchange, divorce, estate, relocation)? That informs how much negotiation room exists.
- Crime grade is F in this area — have there been break-ins, vandalism, or insurance claims at this property in the last 3 years? What carrier currently insures it and at what premium?
- What's the average days-on-market for RENTAL listings here right now (not sales)? A rising rental-DOM trend means longer vacancies and softer asking-rent achievability than the comps imply.
- What's the recent tenant-quality profile in this submarket — average credit score on applications, eviction rate, late-payment / NSF rate, and stable-employment percentage? A property-management company in the area should have these aggregated.
- How much new for-sale + rental construction is in the pipeline within 1–3 miles? Heavy new supply typically softens prices + rents 12–24 months out; constrained supply supports both.
Investment metrics
- 1% rule
- 1.50% ✓
- Cap rate
- 11.84%
- Cash-on-cash
- 19.80%
- DSCR
- 1.88
- GRM
- 5.6
CMA / ARV
- ARV (median comp)
- $122,374
- List price
- $110,000
- Delta
- -10.11%
- Verdict
- UNDERPRICED
- Comps
- 20 within 1.0 mi
Show comp detail 6 sales within ~0.75 mi
| Address | Dist | Beds/Ba | Sqft | Sold | Price | $/sf | Match |
|---|---|---|---|---|---|---|---|
| 1902 Rudy Rd | 0.28mi | 4/2.0 | 1,708 (+11%) | 5mo | $248,000 | $145 | 60 |
| 125 N Linden St | 0.52mi | 3/1.5 (-1) | 1,406 (-8%) | 6mo | $92,000 | $65 | 50 |
| 1925 Whitehall St | 0.45mi | 4/3.0 | 1,693 (+10%) | 13mo | $207,000 | $122 | 43 |
| 1715 Revere St | 0.74mi | 4/2.0 | 1,655 (+8%) | 13mo | $210,000 | $127 | 38 |
| 1912 Holly St | 0.28mi | 3/1.5 (-1) | 1,307 (-15%) | 21mo | $182,320 | $139 | 38 |
| 2133 Rudy Rd | 0.56mi | 3/1.0 (-1) | 1,311 (-15%) | 17mo | $210,000 | $160 | 30 |
Match score weights: distance 35% · size 25% · config 20% · recency 20%. Top-matched comps best support the ARV.
Projected returns pro-forma
-3.0% appreciation · 4.43% rent growth · sell at horizon
- IRR
- 13.6%
- Equity multiple
- 1.55×
- Total profit
- $16,990
- Equity at exit
- $16,401
- IRR
- 23.5%
- Equity multiple
- 3.17×
- Total profit
- $66,811
- Equity at exit
- $9,511
Cash invested: $30,800 (down + closing). Projections, not guarantees.
Landlord ↔ Tenant lean methodology
- Overall (STATE)
- 62 Landlord-Friendly
- State Pennsylvania
- 62 Landlord-Friendly · EVEN
- County
- — inherits STATE
- City
- — inherits STATE
ZIP-level market 17104
- Home prices YoY
- -6.3%
- Rents YoY
- 4.4%
- Active inventory
- 67
- Price-to-rent
- 5.6×
Monthly cashflow live
- Estimated rent
- $1,647 high interval (Pro) →
- Mortgage (P&I)
- −$577
- Tax from tax record
- −$171 /mo · $2,047/yr
- Insurance
- −$46
- HOA
- −$0
- Vacancy / Maint / Mgmt
- −$346
- Net cashflow
- $508
Break-even live
UW: 25.0% down · 7.5% · 30yr · 1.5% tax · 5.0% vac · 8.0% maint · 8.0% mgmt
Financing live
Cash to close
- Down payment
- $27,500
- Closing costs
- $3,300
- Reserves months
- —
- Total cash needed
- —
Loan-product check · same deal, 3 products live
Conventional
25% down · 7.5% · 30yr
- Down + closing
- —
- Monthly P&I
- —
- Monthly cashflow
- —
- DSCR
- —
- Eligible?
- —
Personal DTI + credit; lowest rate.
DSCR
20% down · 8.5% · 30yr
- Down + closing
- —
- Monthly P&I
- —
- Monthly cashflow
- —
- DSCR
- —
- Eligible?
- —
No personal income docs; deal must DSCR.
Hard money
10% down · 12.0% · 12mo
- Down + closing
- —
- Monthly P&I
- —
- Monthly cashflow
- —
- DSCR
- —
- Eligible?
- —
Short-term bridge; refi at stabilization.
Rent comps 28 comps
| Address | Beds | Baths | Sqft | Rent | $/sqft | DOM | Units | Dist |
|---|---|---|---|---|---|---|---|---|
| 29 S 15th St Harrisburg, PA | 5.0 | 1.0 | 1285 | $1,895 | $1.47 | 23d | 1 | 0.17mi |
| 337 S 15th St Harrisburg, PA | 3.0 | 1.0 | 1440 | $1,195 | $0.83 | 21d | 1 | 0.17mi |
| 14 S 17th St Harrisburg, PA | 5.0 | 2.0 | 2136 | $1,695 | $0.79 | 14d | 1 | 0.20mi |
| 1610 Hunter St Harrisburg, PA | 4.0 | 1.0 | 1776 | $1,450 | $0.82 | 23d | 1 | 0.22mi |
| 349 S 14th St Harrisburg, PA | 3.0 | 1.0 | 1544 | $1,450 | $0.94 | 23d | 1 | 0.23mi |
| 1414 Berryhill St Harrisburg, PA | 5.0 | 2.0 | 1786 | $1,700 | $0.95 | 23d | 1 | 0.30mi |
| 1615 Naudain St Harrisburg, PA | 3.0 | 1.0 | 1148 | $1,400 | $1.22 | 43d | 1 | 0.33mi |
| 331 Hummel St Unit B Harrisburg, PA | 3.0 | 1.0 | 1590 | $1,800 | $1.13 | 43d | 1 | 0.34mi |
| 52 N 18th St Harrisburg, PA | 3.0 | 1.0 | 1100 | $1,250 | $1.14 | 14d | 1 | 0.35mi |
| 1429 Naudain St Harrisburg, PA | 3.0 | 1.0 | 1254 | $1,400 | $1.12 | 23d | 1 | 0.36mi |
| 66 N 17th St Harrisburg, PA | 5.0 | 2.0 | 1845 | $2,195 | $1.19 | 43d | 1 | 0.38mi |
| 1251 Bailey St Harrisburg, PA | 3.0 | 1.0 | 1200 | $1,500 | $1.25 | 43d | 1 | 0.40mi |
| 1207 Market St Harrisburg, PA | 4.0 | 1.5 | 1423 | $1,995 | $1.40 | 43d | 1 | 0.41mi |
| 1517 Walnut St Harrisburg, PA | 3.0 | 1.0 | 1172 | $1,150 | $0.98 | 43d | 1 | 0.41mi |
| 2016 Swatara St Harrisburg, PA | 3.0 | 1.0 | 1380 | $1,175 | $0.85 | 43d | 1 | 0.43mi |
| 1139 Mulberry St Harrisburg, PA | 1.0–3.0 | 1.0 | 900 | $1,185 | $1.32 | 43d | 1 | 0.45mi |
| 21 Summit St Harrisburg, PA | 3.0 | 1.0 | 1200 | $1,550 | $1.29 | 14d | 1 | 0.46mi |
| 111 N 17th St Harrisburg, PA | 5.0 | 1.0 | 1800 | $1,850 | $1.03 | 14d | 1 | 0.48mi |
| 52 Balm St Harrisburg, PA | 3.0 | 1.0 | 1950 | $1,495 | $0.77 | 21d | 1 | 0.48mi |
| 2121 Kensington St Harrisburg, PA | 3.0 | 1.0 | 1088 | $1,450 | $1.33 | 43d | 1 | 0.57mi |
| 1728 Paxton St Harrisburg, PA | 3.0 | 1.5 | 1320 | $1,295 | $0.98 | 14d | 1 | 0.69mi |
| 200 S Court St Harrisburg, PA | 1.0–3.0 | 1.0–2.5 | 950 | $1,800 | $1.89 | 14d | 14 | 0.82mi |
| 301 Chestnut St Harrisburg, PA | 1.0–4.0 | 1.0–2.5 | 1437 | $2,600 | $1.81 | 43d | 1 | 0.82mi |
| 301 Chestnut St Harrisburg, PA | 4.0 | 1.0–2.5 | 1437 | $3,000 | $2.09 | 14d | 10 | 0.82mi |
| 649 S 23rd St Unit 1 Harrisburg, PA | 3.0 | 1.0 | 1450 | $1,465 | $1.01 | 43d | 1 | 0.89mi |
| 649 S 23rd St Harrisburg, PA | 3.0 | 1.0 | 1450 | $1,465 | $1.01 | 21d | 1 | 0.89mi |
| 919 Penn St Harrisburg, PA | 3.0 | 2.0 | 1458 | $1,795 | $1.23 | 23d | 1 | 1.32mi |
| 1202 Penn St Harrisburg, PA | 4.0 | 1.0 | 1706 | $1,495 | $0.88 | 43d | 1 | 1.43mi |
Listing history 13 events
-
2026-06-18days on market $110,000 Active 20 DOM
-
2026-06-17days on market $110,000 Active 19 DOM
-
2026-06-16days on market $110,000 Active 18 DOM
-
2026-06-15days on market $110,000 Active 17 DOM
-
2026-06-14days on market $110,000 Active 15 DOM
-
2026-06-13statusdays on market $110,000 Active 14 DOM
-
2026-05-09$110,000 Active 267-char remark
-
2026-05-07historical $110,000 267-char remark
-
2019-10-18soldstatus $328,000
-
2013-11-08soldstatus $27,500 426-char remark
Show marketing remark (426 chars)
Schedule your showing today for this detached home with a completely remodeled kitchen with new counter tops and cabinets, completely remodeled bath with tile shower, and all new windows. The entire house has been painted and new laminate flooring has been installed. The furnace has been serviced and a new hot water heater has been installed as well. Large bedrooms with a large enclosed porch make this property a must see!
-
2013-10-25historical 426-char remark
Show marketing remark (426 chars)
Schedule your showing today for this detached home with a completely remodeled kitchen with new counter tops and cabinets, completely remodeled bath with tile shower, and all new windows. The entire house has been painted and new laminate flooring has been installed. The furnace has been serviced and a new hot water heater has been installed as well. Large bedrooms with a large enclosed porch make this property a must see!
-
2013-03-30$39,900 426-char remark
Show marketing remark (426 chars)
Schedule your showing today for this detached home with a completely remodeled kitchen with new counter tops and cabinets, completely remodeled bath with tile shower, and all new windows. The entire house has been painted and new laminate flooring has been installed. The furnace has been serviced and a new hot water heater has been installed as well. Large bedrooms with a large enclosed porch make this property a must see!
-
1998-06-30soldstatus $18,684
ⓘ Source: listings_history table (triggers on properties + properties_extension) + one-shot
backfill from property_details.listing_events for pre-trigger history.
Tax reassessment forecast PA · Partial reset (capped growth)
- Current annual tax
- $2,047 · $171/mo
- Projected year-2 tax
- $2,047 · $171/mo
- Expected delta
- $0/yr ($0/mo · 0.0%)
ⓘ Screening estimate from a state-policy table — verify with the county assessor before closing.
Climate risk First Street
- Flood 1/10 Low FEMA zone X (unshaded) · 0% chance over 30 yrs
- Wildfire 1/10 Low
- Heat 5/10 Major 7 d/yr ≥100°F today · 15 d/yr by 30 yrs out
- Wind 3/10 Moderate 6% chance of damaging wind over 30 yrs
- Air quality 2/10 Low 1 unhealthy d/yr today · 3 by 30 yrs out
Nearby sold comps map
Loading sold comps map…
Walkable amenities ~0.75 mi
Loading nearby amenities…
Taxation est. · year 1
- Rental income
- $19,768
- − Mortgage interest
- −$6,162
- − Property taxes
- −$2,047
- − Insurance
- −$550
- − Repairs & maintenance
- −$1,581
- − Management
- −$1,581
- − Depreciation
- −$3,200
- Taxable income
- $4,647
- Est. tax owed @ 24.0%
- −$1,115
- After-tax cash flow
- $4,983/yr
For passive investors: Depreciation is non-cash, so a rental often shows a tax loss while cash-flowing — sheltering income. Rental losses are passive: they offset passive income freely, and up to $25,000/yr can offset ordinary (W-2) income if you actively participate and your MAGI is under $100k (phasing out to $0 by $150k); unused losses carry forward. On sale, claimed depreciation is recaptured at up to 25%, and gains may owe capital-gains tax (a 1031 exchange can defer both). Figures are a year-1 estimate at your 24.0% rate — not tax advice; consult a CPA.
Schools (NCES district)
- District
- Harrisburg City SD
- NCES district ID
- 4211580
- Math proficiency
- 6% ▼ -6.00%
- Reading proficiency
- 13% ▼ -10.00%
- Median HH income
- $33,432
- Composite
- 7.6/100
- National rank
- #9945
- State rank
- #535 of 539 in PA
Livability — Harrisburg
- Score
- 84/100
- State rank
- #107
- US rank
- #826
Category grades
Schools grade is shown separately in the Schools card above.
Census & demographics
- Census place
- Harrisburg, PA
- County
- Dauphin County · 247,857 people
- City population
- 184,296
- Metro
- Harrisburg-Carlisle, PA
- Population (ZIP)
- 18,541
- Household income
- $46,510
- Rent vs Own
- Severe rent burden
- 1166.0
Population outlook (Dauphin County) Hauer SSP2
- Today (2025)
- 281,628 people
- By 2030
- 283,549 · +0.7%
- By 2040
- 285,385 · +1.3%
- By 2050
- 286,188 · +1.6%
- By 2075
- 291,053 · +3.3%
- By 2100
- 282,374 · +0.3%
Race, ethnicity, and origin ACS 2023
- Neighborhood character
- Diverse neighborhood (Simpson 0.69)
- Race & ethnicity
- Black 44% Hispanic / Latino 29% White 19% Two or more races 12% Asian 3% Native American 1%
- Hispanic origin (detail)
- Puerto Rican 21% Dominican 6%
- Common ancestry
- Polish 1% Romanian 1% Slovak 1%
- Foreign-born
- 10% · Canada, China, Vietnam
- Languages at home
- 73% English-only · Spanish 21% Other Indo-European 1% Chinese 1%
Political lean MEDSL · Dauphin
- 2024 margin
- Lean D (+5.9) · D 52.4% · R 46.5% · Other 1.1%
- 2008→2024 swing
- -3.1pp toward R · 2008: 9.1pp · 2024: 5.9pp
- All cycles
- 2024: D+5.9 2020: D+8.5 2016: D+2.8 2012: D+6.0 2008: D+9.1
Not yet ingested
- Civics
- —
Market trends
- HPI YoY
- ▼ -22.83%
- Current HPI
- 340.2808
- Rent YoY
- ▲ 4.43%
- Metro
- Harrisburg-Carlisle, PA
- State GDP YoY
- ▲ 1.68%
- F500 in state
- 34
Industry mix (Fortune 500 HQ in PA)
| Industry | F500 HQs | Revenue |
|---|---|---|
| Healthcare | 2 | $309B |
|
||
| Insurance | 2 | $27B |
|
||
| Telecommunications / Media | 1 | $124B |
|
||
| Industrial Distribution | 1 | $22B |
|
||
| Financial Services | 1 | $20B |
|
||
| Chemicals / Materials | 1 | $18B |
|
||
Price history
+488.7% since first listed9 events — show timeline
- 2026-06-10 Relisted — BRIGHT MLS
- 2026-05-20 Contingent — BRIGHT MLS
- 2026-05-09 Listed $110,000 BRIGHT MLS
- 2026-05-07 Coming Soon $110,000 BRIGHT MLS
- 2019-10-18 Sold (Public Records) $328,000 Public Records
- 2013-11-08 Sold (MLS) $27,500 BRIGHT MLS
- 2013-10-25 Listing Removed — BRIGHT MLS
- 2013-03-30 Listed $39,900 BRIGHT MLS
- 1998-06-30 Sold (Public Records) $18,684 Public Records
Property tax history
+0.9%/yrLatest (2026): $2,047 · +1.6% YoY. Source: county tax records.
Cash-flow waterfall
monthlySold comps — $/sqft
last 12 mo · ≤1 miLoading sold comps…