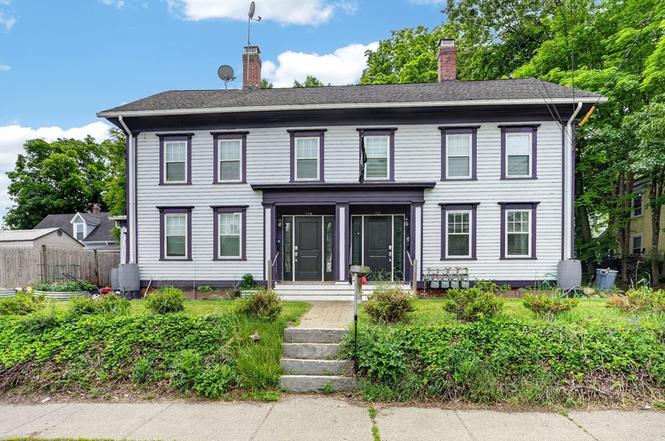
 Fourplex
190-192 Main St · Maynard, MA
Flood risk 1/10 · Minimal
- FEMA flood zone
- X (unshaded)
- Chance of flooding over 30 yrs
- 0.0%
- Est. flood insurance / yr
- $473 – $860
Fire risk 1/10 · Minimal
- Est. fire insurance / yr
- $915 – $1,699
Heat risk 5/10 · Moderate
- Hot days now (above 97°F)
- 7 days/yr
- Hot days in 30 yrs
- 15 days/yr
Wind risk 6/10 · Moderate
- Chance of severe wind over 30 yrs
- 27.0%
Air-quality risk 2/10 · Minimal
- Unhealthy air days now
- 1 days/yr
- Unhealthy air days in 30 yrs
- 2 days/yr
Risk factors via First Street. Map © Google.
Why this score? — see what drove the B grade
The composite is a weighted blend of 9 inputs, each scored 0–100. Each bar is that input's sub-score; the figure is the points it added to the 100-point composite (weight × sub-score).
- Cash flow +30.0/30.0
- 1% rule +10.0/10.0
- DSCR +10.0/10.0
- ARV discount +7.5/15.0
- Livability +4.1/5.0
- Condition / age +4.0/5.0
- Schools +3.8/10.0
- Rent growth +3.3/5.0
- Appreciation +0.0/10.0
$899,000
🖨 Deal sheet 📄 Offer letter ✓ Due diligence
Multi-family units
County records classify this as Multi-Family (2-4 Unit). Listing-text estimate: 4 units. confirmed
Listing remarks
This owner occupied 4-family has been lovingly maintained and updated by the same owner for 32 years! The list of updates is endless: The roof was stripped and replaced in 2017, Replacement windows throughout the house, each unit has Central Air, all separate utilities, (2) of the four furnaces are a year old with the other (2) being less than twelve years old. (3) of the four units have undergone extensive renovations including the owner's unit which is immaculate! Off street parking, coin operated laundry in the basement. All of this with easy access to downtown Maynard and all it has to offer!
Key facts
- Separate utilities
- Off street parking
- Central air
Tags
Property features AI
Finance
- HOA & community: Community near shopping, parks, tennis courts, golf, medical facility, laundromat, public school, T-Station, and sidewalks; Not a senior community
Exterior
- Parking: Six open parking spaces; Paved driveway and off-street paved parking
- Utilities: Public water; Public sewer; Gas available for range
- Home design: 4-family property; 8 total stories; Approximate year built (public records)
- Construction: Stone foundation; Shingle roof; Total building area 3,256
- Exterior features: Covered porch/patio; Paved drive and paved off-street parking; Public road frontage; Publicly maintained road
Interior
- Kitchen: Range; Dishwasher; Refrigerator
- Flooring: Tile; Carpet
- Bathrooms: 4 full bathrooms
- Heating & cooling: Forced air heating (natural gas); Central air conditioning
- Interior features: Upgraded countertops; Living room; Kitchen; Laundry room; Mudroom; Insulated windows; 13 total rooms
- Laundry & utility: Washer; Dryer; Laundry room
Neighborhood map
What this means for you Summary
Snapshot
- This is a 4 × 5-bed/4.0-bath units multifamily listed at $899k. Condition is rated good.
Deal economics
- At list price, monthly cash flow is $5k ($56k/yr) — positive. Per door: $1k/mo.
- The deal already cash-flows at list — no discount required.
- Meets the 1% rule at list price ($14k rent vs $899k).
- Cap rate 12.6% vs local median 1.8% in Maynard — top-decile yield for the area; either an underpriced asset or a hidden risk that comps aren't pricing in. Stress-test before assuming the spread holds.
Location & tenants
- Location reads 82/100 on livability (#26 in MA, #1,176 nationally) — a professional / high-income tenant draw. Strengths: amenities A+, employment A+, housing A+; Watch: commute F, cost of living F.
- Maynard (suburban): math 31% / reading 50% proficiency, ranked #184 of 302 in MA (top 61%) — families likely to look elsewhere, expect single-tenant / working-renter base with shorter leases; only 18% free/reduced lunch — higher-income household profile.
- Market conditions: Rents rising (+3.3%/yr); 9 active listings in the ZIP; high-income renter base; 3,670 units permitted in Middlesex County in 2024 (2,611 in 5+ unit buildings).
- At $13,805/mo this rent would consume 134% of the median local household income ($124k/yr) (locally 372% of renters already pay >50% of income on rent) — very limited rent-growth headroom before tenants either downsize or default.
Forward outlook
- Local home prices are declining (-3.0%/yr); year-one equity from $6k of loan paydown is wiped out by about $27k of value loss. Plan a longer hold.
- Middlesex County population projected at +20% by 2050 — long-run rental-demand tailwind backs the buy-and-hold thesis.
- At projected returns (-3.0% appreciation + 3.3% rent growth), your $252k cash investment doubles in ~6 years — after that, you're playing with house money.
Negotiation context
- Only 7 days on market — expect competitive offers; lowballing is unlikely to land.
Risks & watch-outs
- Watch-outs: built in 1900 — expect roof / HVAC / electrical / plumbing capex.
- Climate carrying-cost: major wind risk, 27% chance of damaging wind over 30y; extreme-heat days projected 7→15/yr by 2055 (HVAC capex compounding) — expect insurance premiums to compound above CPI over the hold.
Questions for the listing agent
- Can we see the unit-by-unit rent roll, current vacancy, and any below-market leases? What's the average tenancy length?
- What capital expenditures (roof, boiler, parking lot, exteriors) have been made in the last 5 years, and what's planned in the next 2?
- Built in 1900 — when were the roof, HVAC, electrical panel, plumbing, and water heater last replaced?
- Is there a deadline driving the sale (1031 exchange, divorce, estate, relocation)? That informs how much negotiation room exists.
- Schools are A-rated — typically a magnet for longer-tenancy family renters. What's the average tenant stay here, and is there a school-zone premium baked into asking?
- What's the average days-on-market for RENTAL listings here right now (not sales)? A rising rental-DOM trend means longer vacancies and softer asking-rent achievability than the comps imply.
- What's the recent tenant-quality profile in this submarket — average credit score on applications, eviction rate, late-payment / NSF rate, and stable-employment percentage? A property-management company in the area should have these aggregated.
- How much new apartment / multifamily construction is in the pipeline within 1–3 miles? Heavy new supply (>2% of stock underway) typically softens rents 12–24 months out; light construction supports rent growth.
Investment metrics
- 1% rule
- 1.54% ✓
- Cap rate
- 12.56%
- Cash-on-cash
- 22.37%
- DSCR
- 2.00
- GRM
- 5.4
CMA / ARV
No comps found within radius.
Projected returns pro-forma
-3.0% appreciation · 3.28% rent growth · sell at horizon
- IRR
- 15.5%
- Equity multiple
- 1.63×
- Total profit
- $157,342
- Equity at exit
- $134,044
- IRR
- 24.4%
- Equity multiple
- 3.14×
- Total profit
- $538,846
- Equity at exit
- $77,729
Cash invested: $251,720 (down + closing). Projections, not guarantees.
Landlord ↔ Tenant lean methodology
- Overall (STATE)
- 20 Strongly Tenant-Friendly
- State Massachusetts
- 20 Strongly Tenant-Friendly · D+15
- County
- — inherits STATE
- City
- — inherits STATE
ZIP-level market 01754
- Rents YoY
- 3.3%
- Active inventory
- 9
- Price-to-rent
- 21.7×
Monthly cashflow live
- Estimated rent
- $13,805 medium interval (Pro) →
- Mortgage (P&I)
- −$4,714
- Tax est. 1.5%
- −$1,124 /mo · $13,485/yr
- Insurance
- −$375
- HOA
- −$0
- Vacancy / Maint / Mgmt
- −$2,899
- Net cashflow
- $4,693
Break-even live
4-unit breakdown (identical units grouped — click to expand)
| Units | Beds | Baths | Est. rent |
|---|---|---|---|
| 4× units | 5 | 4 | $13,804 |
| #1 | 5 | 4 | $3,451 |
| #2 | 5 | 4 | $3,451 |
| #3 | 5 | 4 | $3,451 |
| #4 | 5 | 4 | $3,451 |
| Total (4 units) | $13,805 | ||
UW: 25.0% down · 7.5% · 30yr · 1.5% tax · 5.0% vac · 8.0% maint · 8.0% mgmt
Financing live
Cash to close
- Down payment
- $224,750
- Closing costs
- $26,970
- Reserves months
- —
- Total cash needed
- —
Loan-product check · same deal, 3 products live
Conventional
25% down · 7.5% · 30yr
- Down + closing
- —
- Monthly P&I
- —
- Monthly cashflow
- —
- DSCR
- —
- Eligible?
- —
Personal DTI + credit; lowest rate.
DSCR
20% down · 8.5% · 30yr
- Down + closing
- —
- Monthly P&I
- —
- Monthly cashflow
- —
- DSCR
- —
- Eligible?
- —
No personal income docs; deal must DSCR.
Hard money
10% down · 12.0% · 12mo
- Down + closing
- —
- Monthly P&I
- —
- Monthly cashflow
- —
- DSCR
- —
- Eligible?
- —
Short-term bridge; refi at stabilization.
Listing history 7 events
-
2026-06-18days on market $899,000 Active 7 DOM
-
2026-06-17days on market $899,000 Active 6 DOM
-
2026-06-16days on market $899,000 Active 5 DOM
-
2026-06-15statusdays on market $899,000 Active 4 DOM
-
2026-06-13days on market $899,000 New 2 DOM
-
2026-06-13remarks 603-char remark
-
2026-06-13$899,000 New 1 DOM
ⓘ Source: listings_history table (triggers on properties + properties_extension) + one-shot
backfill from property_details.listing_events for pre-trigger history.
Climate risk First Street
- Flood 1/10 Low FEMA zone X (unshaded) · 0% chance over 30 yrs
- Wildfire 1/10 Low
- Heat 5/10 Major 7 d/yr ≥97°F today · 15 d/yr by 30 yrs out
- Wind 6/10 Major 27% chance of damaging wind over 30 yrs
- Air quality 2/10 Low 1 unhealthy d/yr today · 2 by 30 yrs out
Nearby sold comps map
Loading sold comps map…
Walkable amenities ~0.75 mi
Loading nearby amenities…
Taxation est. · year 1
- Rental income
- $165,660
- − Mortgage interest
- −$50,358
- − Property taxes
- −$13,485
- − Insurance
- −$4,495
- − Repairs & maintenance
- −$13,253
- − Management
- −$13,253
- − Depreciation
- −$26,153
- Taxable income
- $44,664
- Est. tax owed @ 24.0%
- −$10,719
- After-tax cash flow
- $45,599/yr
For passive investors: Depreciation is non-cash, so a rental often shows a tax loss while cash-flowing — sheltering income. Rental losses are passive: they offset passive income freely, and up to $25,000/yr can offset ordinary (W-2) income if you actively participate and your MAGI is under $100k (phasing out to $0 by $150k); unused losses carry forward. On sale, claimed depreciation is recaptured at up to 25%, and gains may owe capital-gains tax (a 1031 exchange can defer both). Figures are a year-1 estimate at your 24.0% rate — not tax advice; consult a CPA.
Condition & rehab AI · 12 photos
This well-maintained 4-family home has been lovingly updated by the same owner for 32 years, with a new roof in 2017 and replacement windows throughout. It offers easy access to downtown Maynard and is move-in ready.
Value-add opportunities
- Both landscaping — enhances curb appeal and adds value
- Both painting — refreshes interior and exterior
- Both upgrading appliances — improves functionality and aesthetics
Renovation cost estimate screening
Value-add ROI direction
- Both landscaping — enhances curb appeal and adds value ↑
- Both painting — refreshes interior and exterior ↑
- Both upgrading appliances — improves functionality and aesthetics ↑
ⓘ Cost ranges are severity-bucket heuristics (US national rule-of-thumb). Get contractor quotes + a written scope before underwriting a rehab budget.
Schools (NCES district)
- District
- Maynard
- NCES district ID
- 2507500
- Math proficiency
- 31% ▼ -17.00%
- Reading proficiency
- 50% ▲ 2.00%
- Median HH income
- $82,569
- Composite
- 37.95/100
- National rank
- #4303
- State rank
- #184 of 302 in MA
Livability — Maynard
- Score
- 82/100
- State rank
- #26
- US rank
- #1176
Category grades
Schools grade is shown separately in the Schools card above.
Census & demographics
- Census place
- Maynard, MA
- County
- Middlesex County · 1,437,704 people
- City population
- 10,712
- Metro
- Boston-Cambridge-Newton, MA-NH
- Population (ZIP)
- 10,712
- Household income
- $124,067
- Rent vs Own
- Severe rent burden
- 372.0
Population outlook (Middlesex County) Hauer SSP2
- Today (2025)
- 1,740,269 people
- By 2030
- 1,817,187 · +4.4%
- By 2040
- 1,963,195 · +12.8%
- By 2050
- 2,087,461 · +20.0%
- By 2075
- 2,344,036 · +34.7%
- By 2100
- 2,383,776 · +37.0%
Race, ethnicity, and origin ACS 2023
- Neighborhood character
- Predominantly White (83%)
- Race & ethnicity
- White 83% Two or more races 7% Asian 5% Hispanic / Latino 4% Black 1%
- Common ancestry
- Romanian 4% Lithuanian 3% Russian 3%
- Foreign-born
- 12% · Canada, China, Vietnam
- Languages at home
- 88% English-only · Other Indo-European 6% Chinese 2% Spanish 2%
Political lean MEDSL · Middlesex
- 2024 margin
- Solid D (+39.5) · D 68.5% · R 29.0% · Other 2.5%
- 2008→2024 swing
- +9.3pp toward D · 2008: 30.1pp · 2024: 39.5pp
- All cycles
- 2024: D+39.5 2020: D+45.2 2016: D+38.1 2012: D+26.9 2008: D+30.1
Not yet ingested
- Civics
- —
Market trends
- HPI YoY
- ▼ -286.50%
- Current HPI
- 265.8435
- Rent YoY
- ▲ 3.28%
- Metro
- Boston-Cambridge-Newton, MA-NH
- State GDP YoY
- ▲ 2.28%
- F500 in state
- 38
Industry mix (Fortune 500 HQ in MA)
| Industry | F500 HQs | Revenue |
|---|---|---|
| Technology | 3 | $17B |
|
||
| Insurance | 2 | $84B |
|
||
| Retail | 2 | $76B |
|
||
| Life Sciences | 1 | $43B |
|
||
| Energy Technology | 1 | $31B |
|
||
| Aerospace / Defense | 1 | $18B |
|
||
Price history
1 event — show timeline
- 2026-06-11 Listed $899,000 MLS PIN
Cash-flow waterfall
monthlySold comps — $/sqft
last 12 mo · ≤1 miLoading sold comps…