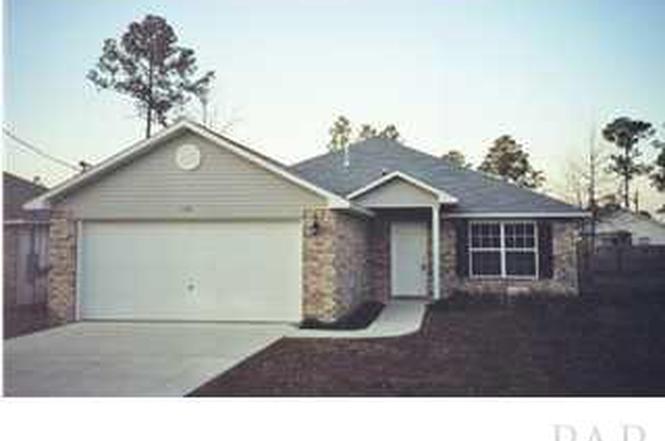
135 Valdosta Ave · Warrington, FL
Flood risk 1/10 · Minimal
- FEMA flood zone
- X (unshaded)
- Chance of flooding over 30 yrs
- 0.0%
- Est. flood insurance / yr
- $507 – $1,088
Fire risk 4/10 · Minor
- Est. fire insurance / yr
- $947 – $1,759
Heat risk 10/10 · Severe
- Hot days now (above 105°F)
- 7 days/yr
- Hot days in 30 yrs
- 23 days/yr
Wind risk 9/10 · Severe
- Chance of severe wind over 30 yrs
- 99.0%
Air-quality risk 1/10 · Minimal
- Unhealthy air days now
- 0 days/yr
- Unhealthy air days in 30 yrs
- 0 days/yr
Risk factors via First Street. Map © Google.
Why this score? — see what drove the B grade
The composite is a weighted blend of 9 inputs, each scored 0–100. Each bar is that input's sub-score; the figure is the points it added to the 100-point composite (weight × sub-score).
- Cash flow +27.8/30.0
- ARV discount +15.0/15.0
- DSCR +9.8/10.0
- 1% rule +6.8/10.0
- Schools +3.6/10.0
- Livability +3.2/5.0
- Rent growth +2.8/5.0
- Condition / age +2.5/5.0
- Appreciation +0.0/10.0
$195,000
🖨 Deal sheet 📄 Offer letter ✓ Due diligence
Listing remarks MLS
GREAT LOCATION.NEAR THE BEACHES AND NAS..THIS 1506 SF CONSTRUCTION HOME IS READY TO MOVE INTO. OPEN FLOOR PLAN HAS HIGH CEILINGS, PLANT LEDGES AND A TWO CAR GARAGE. MASTER BATH HAS WALK IN CLOSET, GARDEN TUB AND CULTURED MARBLE COUNTER TOPS. SURROUND SOUND SPEAKERS, AQUARIAMS, WASHER/DRYER AND REFRIG DO NOT CONVEY.WITH A FULL PRICE OFFER,$2500 FLOORING ALLOWANCE.
Key facts
- Open floor plan
- Tile flooring
- Convenient location
Tags
Neighborhood map
What this means for you Summary
Snapshot
- This is a 3-bed/3.0-bath single-family listed at $195k.
Deal economics
- At list price, monthly cash flow is $595 ($7k/yr) — positive.
- The deal already cash-flows at list — no discount required.
- Meets the 1% rule at list price ($2k rent vs $195k).
- Recommended offer: $172k (12.0% below list) — sets the bar for market timing.
- Cap rate 10.0% vs local median 4.3% in Warrington — top-decile yield for the area; either an underpriced asset or a hidden risk that comps aren't pricing in. Stress-test before assuming the spread holds.
Location & tenants
- Location reads 65/100 on livability (#631 in FL) — a middle-class / working-renter tenant base. Strengths: cost of living A+, housing A+; Watch: amenities F, commute F, employment F.
- Escambia (suburban): math 40% / reading 45% proficiency, ranked #56 of 73 in FL (top 77%) — families likely to look elsewhere, expect single-tenant / working-renter base with shorter leases.
- Zoned schools: Pleasant Grove Elementary School (math 60% / reading 53%, grade C+, #816 of 2,144 statewide, top 39%, 534 students, 66% FRL).
- Zoned-school proficiency averages 56% at this address vs 42% district-wide (+14 pts) — the actual schools serving this property are materially stronger than the Escambia average implies; a family-tenant draw the district grade alone would hide.
- Market conditions: Rents rising (+1.2%/yr); 702 active listings in the ZIP; 8 comparable units currently listed for rent nearby; rentals at typical pace (median 24d on market — plan ~3-4 weeks tenant-placement turnaround); 1,479 units permitted in Escambia County in 2024 (0 in 5+ unit buildings).
- This rent runs 38% of the median local income ($74k/yr) — at the standard rent-burdened threshold; future hikes will face affordability resistance.
Forward outlook
- Local home prices are declining (-3.0%/yr); year-one equity from $1k of loan paydown is wiped out by about $6k of value loss. Plan a longer hold.
- Escambia County population projected at +13% by 2050 — modest demand growth; plan on rents tracking national, not racing it.
Negotiation context
- It's been on market 173 days — a 12% lower offer ($172k) is reasonable based on typical stale-listing flexibility.
- 4 sale attempts since 24y ago; this cycle's ask has dropped $34k (15%) from the opening price — seller is motivated, your offer sets the floor, not the list.
- Current owner paid $126k; list at $195k implies a 54% gain — meaningful room to come down on a strong offer.
Risks & watch-outs
- Climate carrying-cost: severe wind risk, 99% chance of damaging wind over 30y; extreme-heat days projected 7→23/yr by 2055 (HVAC capex compounding) — expect insurance premiums to compound above CPI over the hold.
Questions for the listing agent
- It's been on market 173 days. Have you received any prior offers? Is the seller open to a 12% concession, seller financing, or rate buy-down credit?
- Why hasn't it sold? Are there any deal-killer items the seller is aware of (foundation, flood, title, zoning, code violations)?
- Is there a deadline driving the sale (1031 exchange, divorce, estate, relocation)? That informs how much negotiation room exists.
- Schools are D-rated, which usually means shorter tenancies and higher turnover. Who's the typical renter profile here, and what's been the actual vacancy rate?
- What's the average days-on-market for RENTAL listings here right now (not sales)? A rising rental-DOM trend means longer vacancies and softer asking-rent achievability than the comps imply.
- What's the recent tenant-quality profile in this submarket — average credit score on applications, eviction rate, late-payment / NSF rate, and stable-employment percentage? A property-management company in the area should have these aggregated.
- How much new for-sale + rental construction is in the pipeline within 1–3 miles? Heavy new supply typically softens prices + rents 12–24 months out; constrained supply supports both.
Investment metrics
- 1% rule
- 1.18% ✓
- Cap rate
- 9.96%
- Cash-on-cash
- 13.08%
- DSCR
- 1.58
- GRM
- 7.1
CMA / ARV
- ARV (on-the-fly)
- $254,036
- Comps found
- 12
Show comp detail 12 sales within ~0.75 mi
| Address | Dist | Beds/Ba | Sqft | Sold | Price | $/sf | Match |
|---|---|---|---|---|---|---|---|
| 2517 Gulf Breeze Ave | 0.18mi | 3/2.0 | 1,602 (+3%) | 0mo | $261,000 | $163 | 82 |
| 2520 Gulf Breeze Ave | 0.16mi | 3/2.0 | 1,533 (-1%) | 8mo | $269,900 | $176 | 81 |
| 2504 Gulf Breeze Ave | 0.13mi | 3/2.0 | 1,525 (-2%) | 9mo | $255,000 | $167 | 80 |
| 8712 Schooner Ln | 0.57mi | 3/2.0 | 1,516 (-2%) | 3mo | $277,000 | $183 | 63 |
| 2414 Redoubt Ave | 0.13mi | 3/2.0 | 1,756 (+13%) | 6mo | $275,000 | $157 | 62 |
| 1925 Dunlap St | 0.49mi | 3/2.0 | 1,580 (+2%) | 11mo | $126,167 | $80 | 60 |
| 2008 Augusta Ave | 0.68mi | 4/2.0 (+1) | 1,534 (-1%) | 8mo | $219,000 | $143 | 52 |
| 2125 Bainbridge Ave | 0.61mi | 3/3.0 | 1,750 (+13%) | 1mo | $524,985 | $300 | 49 |
| 3778 Weatherstone Cir | 0.51mi | 3/2.5 | 1,411 (-9%) | 15mo | $260,000 | $184 | 47 |
| 3770 Weatherstone Cir | 0.50mi | 3/2.5 | 1,758 (+14%) | 7mo | $289,000 | $164 | 47 |
| 8916 Jupiter Dr | 0.72mi | 4/2.0 (+1) | 1,568 (+1%) | 14mo | $215,000 | $137 | 44 |
| 3341 Marion Oaks Way | 0.69mi | 3/2.0 | 1,780 (+15%) | 1mo | $260,000 | $146 | 38 |
Match score weights: distance 35% · size 25% · config 20% · recency 20%. Top-matched comps best support the ARV.
Projected returns pro-forma
-3.0% appreciation · 1.22% rent growth · sell at horizon
- IRR
- 1.1%
- Equity multiple
- 1.04×
- Total profit
- $2,220
- Equity at exit
- $29,075
- IRR
- 8.9%
- Equity multiple
- 1.63×
- Total profit
- $34,533
- Equity at exit
- $16,860
Cash invested: $54,600 (down + closing). Projections, not guarantees.
Landlord ↔ Tenant lean methodology
- Overall (STATE)
- 87 Strongly Landlord-Friendly
- State Florida
- 87 Strongly Landlord-Friendly · R+3
- County
- — inherits STATE
- City
- — inherits STATE
ZIP-level market 32507
- Home prices YoY
- -4.6%
- Rents YoY
- 1.2%
- Active inventory
- 702
- Price-to-rent
- 7.1×
Monthly cashflow live
- Estimated rent
- $2,304 high interval (Pro) →
- Mortgage (P&I)
- −$1,023
- Tax from tax record
- −$121 /mo · $1,455/yr
- Insurance
- −$81
- HOA
- −$0
- Vacancy / Maint / Mgmt
- −$484
- Net cashflow
- $595
Break-even live
UW: 25.0% down · 7.5% · 30yr · 1.5% tax · 5.0% vac · 8.0% maint · 8.0% mgmt
Financing live
Cash to close
- Down payment
- $48,750
- Closing costs
- $5,850
- Reserves months
- —
- Total cash needed
- —
Loan-product check · same deal, 3 products live
Conventional
25% down · 7.5% · 30yr
- Down + closing
- —
- Monthly P&I
- —
- Monthly cashflow
- —
- DSCR
- —
- Eligible?
- —
Personal DTI + credit; lowest rate.
DSCR
20% down · 8.5% · 30yr
- Down + closing
- —
- Monthly P&I
- —
- Monthly cashflow
- —
- DSCR
- —
- Eligible?
- —
No personal income docs; deal must DSCR.
Hard money
10% down · 12.0% · 12mo
- Down + closing
- —
- Monthly P&I
- —
- Monthly cashflow
- —
- DSCR
- —
- Eligible?
- —
Short-term bridge; refi at stabilization.
Rent comps 8 comps
| Address | Beds | Baths | Sqft | Rent | $/sqft | DOM | Units | Dist |
|---|---|---|---|---|---|---|---|---|
| 2572 Gulf Breeze Ave Pensacola, FL | 4.0 | 2.0 | 2000 | $3,200 | $1.60 | 23d | 1 | 0.26mi |
| 3762 Weatherstone Cir Pensacola, FL | 4.0 | 2.0 | 1817 | $1,950 | $1.07 | 23d | 1 | 0.51mi |
| 7895 Bay Meadows Dr Pensacola, FL | 3.0 | 2.0 | 1566 | $2,200 | $1.40 | 23d | 1 | 0.56mi |
| 8727 Schooner Ln Pensacola, FL | 3.0 | 2.0 | 1279 | $1,950 | $1.52 | 23d | 1 | 0.56mi |
| 727 Bremen Ave Pensacola, FL | 3.0 | 2.0 | 1512 | $1,650 | $1.09 | 21d | 1 | 1.32mi |
| 9527 Laramie Dr Pensacola, FL | 4.0 | 2.0 | 1925 | $2,100 | $1.09 | 23d | 1 | 1.34mi |
| 2289 Dog Track Rd Unit b Pensacola, FL | 2.0 | 2.0 | 1070 | $1,850 | $1.73 | 14d | 1 | 1.44mi |
| 9219 Gulf Beach Hwy Pensacola, FL | 2.0 | 2.0 | 1472 | $1,249 | $0.85 | 23d | 1 | 1.50mi |
Listing history 17 events
-
2026-05-17status Pending
-
2026-04-21historical
-
2026-04-04historical Contingent
-
2026-03-11price $195,000
-
2026-02-14price $215,000
-
2026-01-29price $217,000
-
2025-12-27price $219,000
-
2025-12-01price $225,000
-
2025-10-29$229,000 Active
-
2017-06-19soldstatus $126,500
-
2017-04-05$126,500
-
2005-07-21soldstatus $143,000
-
2005-06-28soldstatus $143,000 365-char remark
Show marketing remark (365 chars)
GREAT LOCATION.NEAR THE BEACHES AND NAS..THIS 1506 SF CONSTRUCTION HOME IS READY TO MOVE INTO. OPEN FLOOR PLAN HAS HIGH CEILINGS, PLANT LEDGES AND A TWO CAR GARAGE. MASTER BATH HAS WALK IN CLOSET, GARDEN TUB AND CULTURED MARBLE COUNTER TOPS. SURROUND SOUND SPEAKERS, AQUARIAMS, WASHER/DRYER AND REFRIG DO NOT CONVEY.WITH A FULL PRICE OFFER,$2500 FLOORING ALLOWANCE.
-
2005-04-26$145,000 365-char remark
Show marketing remark (365 chars)
GREAT LOCATION.NEAR THE BEACHES AND NAS..THIS 1506 SF CONSTRUCTION HOME IS READY TO MOVE INTO. OPEN FLOOR PLAN HAS HIGH CEILINGS, PLANT LEDGES AND A TWO CAR GARAGE. MASTER BATH HAS WALK IN CLOSET, GARDEN TUB AND CULTURED MARBLE COUNTER TOPS. SURROUND SOUND SPEAKERS, AQUARIAMS, WASHER/DRYER AND REFRIG DO NOT CONVEY.WITH A FULL PRICE OFFER,$2500 FLOORING ALLOWANCE.
-
2003-02-21soldstatus $99,500
-
2002-02-25$102,400
-
2000-06-23soldstatus $3,067,600
ⓘ Source: listings_history table (triggers on properties + properties_extension) + one-shot
backfill from property_details.listing_events for pre-trigger history.
Tax reassessment forecast FL · Resets to sale price
- Current annual tax
- $1,455 · $121/mo
- Projected year-2 tax
- $1,618 · $135/mo
- Expected delta
- +$164/yr (+$14/mo · 11.3%)
ⓘ Screening estimate from a state-policy table — verify with the county assessor before closing.
Climate risk First Street
- Flood 1/10 Low FEMA zone X (unshaded) · 0% chance over 30 yrs
- Wildfire 4/10 Moderate
- Heat 10/10 Extreme 7 d/yr ≥105°F today · 23 d/yr by 30 yrs out
- Wind 9/10 Extreme 99% chance of damaging wind over 30 yrs
- Air quality 1/10 Low 0 unhealthy d/yr today · 0 by 30 yrs out
Nearby sold comps map
Loading sold comps map…
Walkable amenities ~0.75 mi
Loading nearby amenities…
Taxation est. · year 1
- Rental income
- $27,651
- − Mortgage interest
- −$10,923
- − Property taxes
- −$1,455
- − Insurance
- −$975
- − Repairs & maintenance
- −$2,212
- − Management
- −$2,212
- − Depreciation
- −$5,673
- Taxable income
- $4,201
- Est. tax owed @ 24.0%
- −$1,008
- After-tax cash flow
- $6,135/yr
For passive investors: Depreciation is non-cash, so a rental often shows a tax loss while cash-flowing — sheltering income. Rental losses are passive: they offset passive income freely, and up to $25,000/yr can offset ordinary (W-2) income if you actively participate and your MAGI is under $100k (phasing out to $0 by $150k); unused losses carry forward. On sale, claimed depreciation is recaptured at up to 25%, and gains may owe capital-gains tax (a 1031 exchange can defer both). Figures are a year-1 estimate at your 24.0% rate — not tax advice; consult a CPA.
Schools (NCES district)
- District
- Escambia
- NCES district ID
- 1200510
- Math proficiency
- 40% ▼ -9.00%
- Reading proficiency
- 45% ▼ -4.00%
- Median HH income
- $44,649
- Composite
- 36.04/100
- National rank
- #4773
- State rank
- #56 of 73 in FL
Livability — Warrington
- Score
- 65/100
- State rank
- #631
- US rank
- #12396
Category grades
Schools grade is shown separately in the Schools card above.
Census & demographics
- Census place
- Warrington, FL
- County
- Escambia County · 301,722 people
- Metro
- Pensacola-Ferry Pass-Brent, FL
- Population (ZIP)
- 32,226
- Household income
- $73,540
- Rent vs Own
- Severe rent burden
- 1175.0
Population outlook (Escambia County) Hauer SSP2
- Today (2025)
- 334,637 people
- By 2030
- 345,779 · +3.3%
- By 2040
- 364,828 · +9.0%
- By 2050
- 378,514 · +13.1%
- By 2075
- 403,220 · +20.5%
- By 2100
- 386,125 · +15.4%
Race, ethnicity, and origin ACS 2023
- Neighborhood character
- Predominantly White (73%)
- Race & ethnicity
- White 73% Black 10% Two or more races 10% Hispanic / Latino 7% Asian 2%
- Hispanic origin (detail)
- Mexican 3% Puerto Rican 2%
- Common ancestry
- Slovak 3% Lithuanian 2% Romanian 2%
- Foreign-born
- 5% · Canada, Vietnam
- Languages at home
- 92% English-only · Spanish 4% Other Asian/Pacific 1% French/Haitian/Cajun 1%
Political lean MEDSL · Escambia
- 2024 margin
- R (+19.5) · D 39.7% · R 59.2% · Other 1.1%
- 2008→2024 swing
- -0.2pp no change · 2008: -19.3pp · 2024: -19.5pp
- All cycles
- 2024: R+19.5 2020: R+15.1 2016: R+20.6 2012: R+20.6 2008: R+19.3
Not yet ingested
- Civics
- —
Market trends
- HPI YoY
- ▼ -26.23%
- Current HPI
- 548.03
- Rent YoY
- ▲ 1.22%
- Metro
- Pensacola-Ferry Pass-Brent, FL
- State GDP YoY
- ▲ 3.28%
- F500 in state
- 36
Industry mix (Fortune 500 HQ in FL)
| Industry | F500 HQs | Revenue |
|---|---|---|
| Industrial Technology | 2 | $29B |
|
||
| Insurance | 2 | $17B |
|
||
| Retail | 1 | $60B |
|
||
| Technology Distribution | 1 | $58B |
|
||
| Homebuilding | 1 | $35B |
|
||
| Technology Manufacturing | 1 | $35B |
|
||
Price history
-93.6% since first listed17 events — show timeline
- 2026-05-17 Pending — PARMLS
- 2026-04-21 Listing Removed — PARMLS
- 2026-04-04 Contingent — PARMLS
- 2026-03-11 Price Changed $195,000 PARMLS
- 2026-02-14 Price Changed $215,000 PARMLS
- 2026-01-29 Price Changed $217,000 PARMLS
- 2025-12-27 Price Changed $219,000 PARMLS
- 2025-12-01 Price Changed $225,000 PARMLS
- 2025-10-29 Listed $229,000 PARMLS
- 2017-06-19 Sold (Public Records) $126,500 Public Records
- 2017-04-05 Listed $126,500 PARMLS
- 2005-07-21 Sold (Public Records) $143,000 Public Records
- 2005-06-28 Sold (MLS) $143,000 PARMLS
- 2005-04-26 Listed $145,000 PARMLS
- 2003-02-21 Sold (MLS) $99,500 PARMLS
- 2002-02-25 Listed $102,400 PARMLS
- 2000-06-23 Sold (Public Records) $3,067,600 Public Records
Property tax history
+0.1%/yrLatest (2025): $1,455 · +15.5% YoY. Source: county tax records.
Cash-flow waterfall
monthlySold comps — $/sqft
last 12 mo · ≤1 miLoading sold comps…