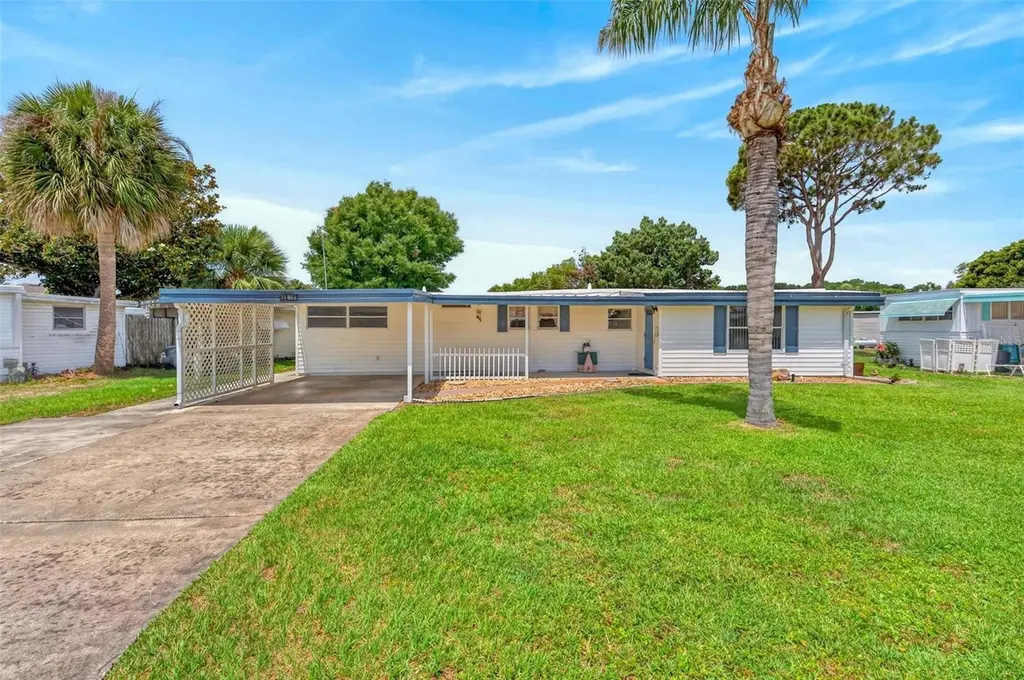
31643 Howard St · Tavares, FL
Flood risk 1/10 · Minimal
- FEMA flood zone
- X (unshaded)
- Chance of flooding over 30 yrs
- 0.0%
- Est. flood insurance / yr
- $507 – $1,088
Fire risk 3/10 · Minor
- Est. fire insurance / yr
- $947 – $1,759
Heat risk 8/10 · Major
- Hot days now (above 107°F)
- 7 days/yr
- Hot days in 30 yrs
- 22 days/yr
Wind risk 9/10 · Severe
- Chance of severe wind over 30 yrs
- 99.0%
Air-quality risk 2/10 · Minimal
- Unhealthy air days now
- 1 days/yr
- Unhealthy air days in 30 yrs
- 1 days/yr
Risk factors via First Street. Map © Google.
Why this score? — see what drove the B grade
The composite is a weighted blend of 9 inputs, each scored 0–100. Each bar is that input's sub-score; the figure is the points it added to the 100-point composite (weight × sub-score).
- Cash flow +30.0/30.0
- DSCR +10.0/10.0
- 1% rule +8.5/10.0
- ARV discount +7.5/15.0
- Schools +4.2/10.0
- Livability +3.8/5.0
- Rent growth +3.5/5.0
- Condition / age +2.5/5.0
- Appreciation +0.0/10.0
$149,900
🖨 Deal sheet 📄 Offer letter ✓ Due diligence
Listing remarks
Fully furnished and uniquely designed, this spacious 3 bed/2 bath home perfectly combines comfort and functionality. Step inside to find an expansive living area featuring a sunken bonus space to extend your living options. The kitchen boasts Whirlpool stainless steel appliances, a custom built-in pantry, and an adaptable island that can be repositioned to customize your workflow. The primary bedroom showcases a walk-in closet and an ensuite equipped with a convenient indoor laundry space, while two additional bedrooms provide the perfect setup for a guest room, home office, or hobby area. Through the sliding doors is a versatile converted bonus/Additional Bedroom/Florida room, uniquely equ
Key facts
- Walk-in closet
- Adaptable island
- Sunk bonus space
Tags
Property features AI
Finance
- Other: Total annual fees $300; Property type: Residential mobile home; Property subtype: Mobile Home; Zoning: RM
- Financial info: Lease restrictions apply
- HOA & community: Has HOA with monthly fee of $25; Association amenities include clubhouse, pool, recreation facilities, shuffleboard court; Association fee covers pool and recreational facilities; Association approval required; Association recreation owned; Buyer approval required; Deed restrictions; Golf carts allowed; Pets allowed (cats and dogs); Senior community
Exterior
- Parking: Carport (1 space)
- Utilities: Public water and well; Septic tank; Cable available; Broadband/High-speed internet available; Electricity connected; Water connected
- Home design: Residential mobile home (single wide); One story; Faces east
- Construction: Vinyl siding with frame construction; Metal roof; Pillar/post/pier foundation; Built in 1 level
- Exterior features: Front porch; Private mailbox; Rain gutters; Sliding doors; Storage; Shed(s); Workshop; Irrigation equipment; Lake access to Harris Chain of Lakes; Located in county; Paved road
Interior
- Kitchen: Dishwasher; Range; Microwave; Refrigerator
- Bedrooms: 3 bedrooms
- Flooring: Ceramic tile; Laminate
- Bathrooms: 2 full bathrooms
- Heating & cooling: Central heating; Ductless heating; Central air conditioning
- Interior features: Built-in features; Ceiling fans; Split bedroom floor plan; Walk-in closets; Bonus room; Florida room; Formal separate dining room; Inside utility; Storage rooms
- Laundry & utility: Washer; Dryer; Laundry inside
Neighborhood map
What this means for you Summary
Snapshot
- This is a 2-bed/1.0-bath manufactured listed at $150k.
Deal economics
- At list price, monthly cash flow is $629 ($8k/yr) — positive.
- The deal already cash-flows at list — no discount required.
- Meets the 1% rule at list price ($2k rent vs $150k).
- Recommended offer: $148k (1.5% below list) — sets the bar for market timing.
- Cap rate 11.3% vs local median 4.5% in Tavares — top-decile yield for the area; either an underpriced asset or a hidden risk that comps aren't pricing in. Stress-test before assuming the spread holds.
Location & tenants
- Location reads 76/100 on livability (#220 in FL, #3,464 nationally) — a middle-class / working-renter tenant base. Strengths: crime A+, cost of living A+, housing A+; Watch: employment D, amenities F, commute F.
- Lake (suburban): math 49% / reading 50% proficiency, ranked #37 of 73 in FL (top 51%) — families likely to look elsewhere, expect single-tenant / working-renter base with shorter leases.
- Market conditions: Rents rising fast (+4.0%/yr); 501 active listings in the ZIP; 7 comparable units currently listed for rent nearby; rentals at typical pace (median 15d on market — plan ~3-4 weeks tenant-placement turnaround); 4,799 units permitted in Lake County in 2024 (814 in 5+ unit buildings).
- This rent runs 38% of the median local income ($63k/yr) — at the standard rent-burdened threshold; future hikes will face affordability resistance.
Forward outlook
- Local home prices are declining (-3.0%/yr); year-one equity from $1k of loan paydown is wiped out by about $4k of value loss. Plan a longer hold.
- Lake County population projected at +37% by 2050 — long-run rental-demand tailwind backs the buy-and-hold thesis.
- At projected returns (-3.0% appreciation + 4.0% rent growth), your $42k cash investment doubles in ~7 years — after that, you're playing with house money.
Negotiation context
- It's been on market 29 days — a 2% lower offer ($148k) is reasonable based on typical stale-listing flexibility.
- 2 sale attempts with the ask held roughly flat each time — persistent listings suggest the price (not the market) is what's stuck; bring a comps-based counter.
Risks & watch-outs
- Climate carrying-cost: severe wind risk, 99% chance of damaging wind over 30y; extreme-heat days projected 7→22/yr by 2055 (HVAC capex compounding) — expect insurance premiums to compound above CPI over the hold.
Questions for the listing agent
- Built in 1968 — when were the roof, HVAC, electrical panel, plumbing, and water heater last replaced?
- What does the HOA fee cover, when was the last increase, and are there any pending special assessments or reserve-fund shortfalls?
- Is there a deadline driving the sale (1031 exchange, divorce, estate, relocation)? That informs how much negotiation room exists.
- What's the average days-on-market for RENTAL listings here right now (not sales)? A rising rental-DOM trend means longer vacancies and softer asking-rent achievability than the comps imply.
- What's the recent tenant-quality profile in this submarket — average credit score on applications, eviction rate, late-payment / NSF rate, and stable-employment percentage? A property-management company in the area should have these aggregated.
- How much new for-sale + rental construction is in the pipeline within 1–3 miles? Heavy new supply typically softens prices + rents 12–24 months out; constrained supply supports both.
Investment metrics
- 1% rule
- 1.35% ✓
- Cap rate
- 11.33%
- Cash-on-cash
- 17.98%
- DSCR
- 1.80
- GRM
- 6.2
CMA / ARV
- ARV (on-the-fly)
- $423,254
- Comps found
- 1
Show comp detail 1 sale within ~0.75 mi
| Address | Dist | Beds/Ba | Sqft | Sold | Price | $/sf | Match |
|---|---|---|---|---|---|---|---|
| 31714 Terrace Dr | 0.38mi | 2/2.0 | 1,704 (-10%) | 10mo | $380,000 | $223 | 53 |
Match score weights: distance 35% · size 25% · config 20% · recency 20%. Top-matched comps best support the ARV.
Projected returns pro-forma
-3.0% appreciation · 4.05% rent growth · sell at horizon
- IRR
- 10.7%
- Equity multiple
- 1.43×
- Total profit
- $17,911
- Equity at exit
- $22,351
- IRR
- 20.5%
- Equity multiple
- 2.82×
- Total profit
- $76,181
- Equity at exit
- $12,961
Cash invested: $41,972 (down + closing). Projections, not guarantees.
Landlord ↔ Tenant lean methodology
- Overall (STATE)
- 87 Strongly Landlord-Friendly
- State Florida
- 87 Strongly Landlord-Friendly · R+3
- County
- — inherits STATE
- City
- — inherits STATE
ZIP-level market 32778
- Home prices YoY
- -23.4%
- Rents YoY
- 4.0%
- Active inventory
- 501
- Price-to-rent
- 6.2×
Monthly cashflow live
- Estimated rent
- $2,023 high interval (Pro) →
- Mortgage (P&I)
- −$786
- Tax from tax record
- −$96 /mo · $1,148/yr
- Insurance
- −$62
- HOA
- −$25
- Vacancy / Maint / Mgmt
- −$425
- Net cashflow
- $629
Break-even live
UW: 25.0% down · 7.5% · 30yr · 1.5% tax · 5.0% vac · 8.0% maint · 8.0% mgmt
Financing live
Cash to close
- Down payment
- $37,475
- Closing costs
- $4,497
- Reserves months
- —
- Total cash needed
- —
Loan-product check · same deal, 3 products live
Conventional
25% down · 7.5% · 30yr
- Down + closing
- —
- Monthly P&I
- —
- Monthly cashflow
- —
- DSCR
- —
- Eligible?
- —
Personal DTI + credit; lowest rate.
DSCR
20% down · 8.5% · 30yr
- Down + closing
- —
- Monthly P&I
- —
- Monthly cashflow
- —
- DSCR
- —
- Eligible?
- —
No personal income docs; deal must DSCR.
Hard money
10% down · 12.0% · 12mo
- Down + closing
- —
- Monthly P&I
- —
- Monthly cashflow
- —
- DSCR
- —
- Eligible?
- —
Short-term bridge; refi at stabilization.
Rent comps 7 comps
| Address | Beds | Baths | Sqft | Rent | $/sqft | DOM | Units | Dist |
|---|---|---|---|---|---|---|---|---|
| 4721 Treasure Cay Rd Tavares, FL | 3.0 | 2.0 | 1372 | $2,000 | $1.46 | 15d | 1 | 0.29mi |
| 4749 Abaco Dr Tavares, FL | 3.0 | 2.0 | 2304 | $2,230 | $0.97 | 4d | 1 | 0.34mi |
| 4950 Marsh Harbor Dr Tavares, FL | 3.0 | 2.0 | 1227 | $2,050 | $1.67 | 4d | 1 | 0.48mi |
| 4567 Barbuda Dr Tavares, FL | 3.0 | 2.0 | 1362 | $2,150 | $1.58 | 24d | 1 | 0.50mi |
| 3224 Manatee Rd Tavares, FL | 3.0 | 2.0 | 1568 | $1,600 | $1.02 | 4d | 1 | 0.70mi |
| 459 E Rosewood Ln #157 Tavares, FL | 3.0 | 2.0 | 1240 | $1,400 | $1.13 | 22d | 1 | 0.88mi |
| 465 Oak Dr Tavares, FL | 3.0 | 3.0 | 1550 | $1,750 | $1.13 | 24d | 1 | 1.16mi |
HOA detail
- Monthly dues
- $25 · $300/yr
- Likely covers
- pool
Listing history 18 events
-
2026-06-18days on market $149,900 Active 29 DOM
-
2026-06-17days on market $149,900 Active 28 DOM
-
2026-06-16days on market $149,900 Active 27 DOM
-
2026-06-15days on market $149,900 Active 26 DOM
-
2026-06-13days on market $149,900 Active 24 DOM
-
2026-06-09days on market $149,900 Active 20 DOM
-
2026-06-08days on market $149,900 Active 19 DOM
-
2026-06-07days on market $149,900 Active 18 DOM
-
2026-06-04days on market $149,900 Active 15 DOM
-
2026-06-03days on market $149,900 Active 14 DOM
-
2026-06-02days on market $149,900 Active 13 DOM
-
2026-06-01days on market $149,900 Active 12 DOM
-
2026-05-31days on market $149,900 Active 11 DOM
-
2026-05-20$149,900 Active
-
2025-12-31historical
-
2025-11-25price $175,000
-
2025-10-14price $185,000
-
2025-08-14$195,000 Active
ⓘ Source: listings_history table (triggers on properties + properties_extension) + one-shot
backfill from property_details.listing_events for pre-trigger history.
Tax reassessment forecast FL · Resets to sale price
- Current annual tax
- $1,148 · $96/mo
- Projected year-2 tax
- $1,244 · $104/mo
- Expected delta
- +$96/yr (+$8/mo · 8.4%)
ⓘ Screening estimate from a state-policy table — verify with the county assessor before closing.
Climate risk First Street
- Flood 1/10 Low FEMA zone X (unshaded) · 0% chance over 30 yrs
- Wildfire 3/10 Moderate
- Heat 8/10 Severe 7 d/yr ≥107°F today · 22 d/yr by 30 yrs out
- Wind 9/10 Extreme 99% chance of damaging wind over 30 yrs
- Air quality 2/10 Low 1 unhealthy d/yr today · 1 by 30 yrs out
Nearby sold comps map
Loading sold comps map…
Walkable amenities ~0.75 mi
Loading nearby amenities…
Taxation est. · year 1
- Rental income
- $24,274
- − Mortgage interest
- −$8,397
- − Property taxes
- −$1,148
- − Insurance
- −$750
- − Repairs & maintenance
- −$1,942
- − Management
- −$1,942
- − HOA
- −$300
- − Depreciation
- −$4,361
- Taxable income
- $5,436
- Est. tax owed @ 24.0%
- −$1,305
- After-tax cash flow
- $6,242/yr
For passive investors: Depreciation is non-cash, so a rental often shows a tax loss while cash-flowing — sheltering income. Rental losses are passive: they offset passive income freely, and up to $25,000/yr can offset ordinary (W-2) income if you actively participate and your MAGI is under $100k (phasing out to $0 by $150k); unused losses carry forward. On sale, claimed depreciation is recaptured at up to 25%, and gains may owe capital-gains tax (a 1031 exchange can defer both). Figures are a year-1 estimate at your 24.0% rate — not tax advice; consult a CPA.
Schools (NCES district)
- District
- Lake
- NCES district ID
- 1201050
- Math proficiency
- 49% ▼ -7.00%
- Reading proficiency
- 50% ▼ -4.00%
- Median HH income
- $46,632
- Composite
- 42.05/100
- National rank
- #3327
- State rank
- #37 of 73 in FL
Livability — Tavares
- Score
- 76/100
- State rank
- #220
- US rank
- #3464
Category grades
Schools grade is shown separately in the Schools card above.
Census & demographics
- County
- Lake County · 364,602 people
- City population
- 25,042
- Metro
- Orlando-Kissimmee-Sanford, FL
- Population (ZIP)
- 25,042
- Household income
- $63,472
- Rent vs Own
- Severe rent burden
- 586.0
Population outlook (Lake County) Hauer SSP2
- Today (2025)
- 386,640 people
- By 2030
- 417,107 · +7.9%
- By 2040
- 476,676 · +23.3%
- By 2050
- 531,296 · +37.4%
- By 2075
- 648,303 · +67.7%
- By 2100
- 698,530 · +80.7%
Race, ethnicity, and origin ACS 2023
- Neighborhood character
- Predominantly White (72%)
- Race & ethnicity
- White 72% Hispanic / Latino 14% Two or more races 8% Black 8% Asian 2%
- Hispanic origin (detail)
- Mexican 1% Puerto Rican 7% Cuban 2% Dominican 1%
- Common ancestry
- Romanian 4% Italian 3% Slovak 2%
- Foreign-born
- 9% · Canada, Dominican Republic, Jamaica
- Languages at home
- 85% English-only · Spanish 11% Other Indo-European 2% Other Asian/Pacific 1%
Political lean MEDSL · Lake
- 2024 margin
- Strong R (+24.7) · D 37.3% · R 62.0%
- 2008→2024 swing
- -11.2pp toward R · 2008: -13.5pp · 2024: -24.7pp
- All cycles
- 2024: R+24.7 2020: R+20.0 2016: R+23.1 2012: R+17.1 2008: R+13.5
Not yet ingested
- Civics
- —
Market trends
- HPI YoY
- ▼ -88.07%
- Current HPI
- 288.7123
- Rent YoY
- ▲ 4.05%
- Metro
- Orlando-Kissimmee-Sanford, FL
- State GDP YoY
- ▲ 3.28%
- F500 in state
- 36
Industry mix (Fortune 500 HQ in FL)
| Industry | F500 HQs | Revenue |
|---|---|---|
| Industrial Technology | 2 | $29B |
|
||
| Insurance | 2 | $17B |
|
||
| Retail | 1 | $60B |
|
||
| Technology Distribution | 1 | $58B |
|
||
| Homebuilding | 1 | $35B |
|
||
| Technology Manufacturing | 1 | $35B |
|
||
Price history
-23.1% since first listed5 events — show timeline
- 2026-05-20 Listed $149,900 Stellar MLS as Distributed by MLS Grid
- 2025-12-31 Listing Removed — Stellar MLS as Distributed by MLS Grid
- 2025-11-25 Price Changed $175,000 Stellar MLS as Distributed by MLS Grid
- 2025-10-14 Price Changed $185,000 Stellar MLS as Distributed by MLS Grid
- 2025-08-14 Listed $195,000 Stellar MLS as Distributed by MLS Grid
Property tax history
+10.3%/yrLatest (2025): $1,148 · +2.6% YoY. Source: county tax records.
Cash-flow waterfall
monthlySold comps — $/sqft
last 12 mo · ≤1 miLoading sold comps…