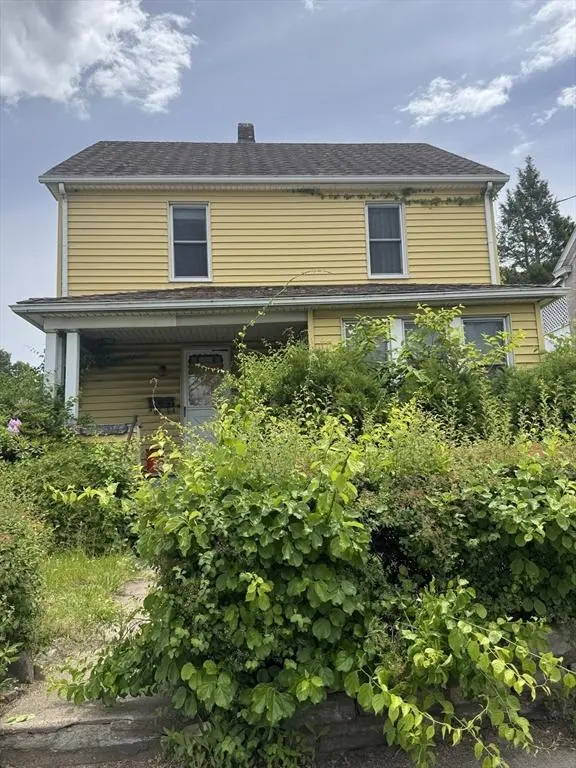
220 South St · Holyoke, MA
Flood risk 1/10 · Minimal
- FEMA flood zone
- X (unshaded)
- Chance of flooding over 30 yrs
- 0.0%
- Est. flood insurance / yr
- $473 – $860
Fire risk 1/10 · Minimal
- Est. fire insurance / yr
- $915 – $1,699
Heat risk 4/10 · Minor
- Hot days now (above 98°F)
- 7 days/yr
- Hot days in 30 yrs
- 16 days/yr
Wind risk 4/10 · Minor
- Chance of severe wind over 30 yrs
- 21.0%
Air-quality risk 2/10 · Minimal
- Unhealthy air days now
- 1 days/yr
- Unhealthy air days in 30 yrs
- 1 days/yr
Risk factors via First Street. Map © Google.
Why this score? — see what drove the B- grade
The composite is a weighted blend of 9 inputs, each scored 0–100. Each bar is that input's sub-score; the figure is the points it added to the 100-point composite (weight × sub-score).
- Cash flow +26.5/30.0
- ARV discount +15.0/15.0
- DSCR +9.0/10.0
- 1% rule +7.7/10.0
- Livability +3.1/5.0
- Rent growth +2.5/5.0
- Condition / age +2.5/5.0
- Schools +0.8/10.0
- Appreciation +0.0/10.0
$160,000
🖨 Deal sheet (PDF) 📄 Offer letter ✓ Due diligence
Listing remarks
Opportunity awaits in this 3-bedroom, 1.5-bath home conveniently located near shopping and public transportation. Property requires extensive rehabilitation and is being sold strictly as-is. Heating and water will not be turned on for inspections. Subject to license to sell. Cash or rehab financing only.
Key facts
- 5,998 sq ft lot
- 2 parking spots
- Built 1915
Property features AI
Finance
- HOA & community: No senior community; Public transportation nearby; Shopping nearby
Exterior
- Parking: Off-street parking; Two parking spaces
- Utilities: Public water; Public sewer
- Home design: Single family residence; Approximately 1,560 above-grade finished area; Yellow exterior color
- Construction: Brick/mortar foundation; Shingle roof; Built (year approximate, source: public records)
- Exterior features: Porch; Level lot; Public road frontage
Interior
- Kitchen: Range
- Bathrooms: One full bathroom; One half bathroom
- Heating & cooling: Steam heating; Natural gas heating; Has heating
- Interior features: Six total rooms; Full basement
Neighborhood map
What this means for you Summary
Snapshot
- This is a 3-bed/2.0-bath single-family listed at $160k.
Deal economics
- At list price, monthly cash flow is $422 ($5k/yr) — positive.
- The deal already cash-flows at list — no discount required.
- Meets the 1% rule at list price ($2k rent vs $160k).
- Recommended offer: $158k (1.5% below list) — sets the bar for market timing.
- Cap rate 9.5% vs local median 5.3% in Holyoke — top-decile yield for the area; either an underpriced asset or a hidden risk that comps aren't pricing in. Stress-test before assuming the spread holds.
Location & tenants
- Location reads 62/100 on livability (#203 in MA) — a middle-class / working-renter tenant base. Strengths: commute A+, health & safety A+, housing B; Watch: schools F, crime F, amenities F.
- Holyoke (suburban): math 5% / reading 14% proficiency, ranked #302 of 302 in MA (top 100%) — low school quality limits family demand, transient renter base, plan for 1-2y turnover; 82% free/reduced lunch — lower-income household profile, screen leases tightly.
- Market conditions: 43 active listings in the ZIP; 17 comparable units currently listed for rent nearby; rentals at typical pace (median 23d on market — plan ~3-4 weeks tenant-placement turnaround); 41% of comp listings sitting > 30 days — soft ceiling on asking rent; 453 units permitted in Hampden County in 2024 (116 in 5+ unit buildings).
- At $2,025/mo this rent would consume 45% of the median local household income ($54k/yr) (locally 2404% of renters already pay >50% of income on rent) — very limited rent-growth headroom before tenants either downsize or default.
Forward outlook
- Local home prices are declining (-3.0%/yr); year-one equity from $1k of loan paydown is wiped out by about $5k of value loss. Plan a longer hold.
- Hampden County population projected at +5% by 2050 — modest demand growth; plan on rents tracking national, not racing it.
- At projected returns (-3.0% appreciation + 3.0% rent growth), your $45k cash investment doubles in ~10 years — after that, you're playing with house money.
Negotiation context
- It's been on market 15 days — a 2% lower offer ($158k) is reasonable based on typical stale-listing flexibility.
Risks & watch-outs
- Watch-outs: built in 1915 — expect roof / HVAC / electrical / plumbing capex.
Questions for the listing agent
- Built in 1915 — when were the roof, HVAC, electrical panel, plumbing, and water heater last replaced?
- Is there a deadline driving the sale (1031 exchange, divorce, estate, relocation)? That informs how much negotiation room exists.
- Schools are F-rated, which usually means shorter tenancies and higher turnover. Who's the typical renter profile here, and what's been the actual vacancy rate?
- Crime grade is F in this area — have there been break-ins, vandalism, or insurance claims at this property in the last 3 years? What carrier currently insures it and at what premium?
- What's the average days-on-market for RENTAL listings here right now (not sales)? A rising rental-DOM trend means longer vacancies and softer asking-rent achievability than the comps imply.
- What's the recent tenant-quality profile in this submarket — average credit score on applications, eviction rate, late-payment / NSF rate, and stable-employment percentage? A property-management company in the area should have these aggregated.
- How much new for-sale + rental construction is in the pipeline within 1–3 miles? Heavy new supply typically softens prices + rents 12–24 months out; constrained supply supports both.
Investment metrics
- 1% rule
- 1.27% ✓
- Cap rate
- 9.46%
- Cash-on-cash
- 11.31%
- DSCR
- 1.50
- GRM
- 6.6
CMA / ARV
- ARV (on-the-fly)
- $291,720
- Comps found
- 12
Show comp detail 12 sales within ~0.75 mi
| Address | Dist | Beds/Ba | Sqft | Sold | Price | $/sf | Match |
|---|---|---|---|---|---|---|---|
| 13 Willow St | 0.43mi | 3/1.5 | 1,568 (+0%) | 5mo | $190,000 | $121 | 72 |
| 16 Charles St | 0.30mi | 4/1.5 (+1) | 1,668 (+7%) | 7mo | $293,000 | $176 | 62 |
| 14 Ladd St | 0.45mi | 4/2.0 (+1) | 1,512 (-3%) | 12mo | $235,000 | $155 | 59 |
| 55 Hitchcock St | 0.65mi | 4/1.5 (+1) | 1,548 (-1%) | 8mo | $340,000 | $220 | 54 |
| 258 Walnut St | 0.62mi | 4/1.5 (+1) | 1,546 (-1%) | 10mo | $215,000 | $139 | 54 |
| 42 Lawler St | 0.61mi | 4/1.5 (+1) | 1,469 (-6%) | 2mo | $290,000 | $197 | 53 |
| 325 Elm St | 0.40mi | 4/2.5 (+1) | 1,680 (+8%) | 11mo | $315,000 | $188 | 53 |
| 78 Calumet Rd | 0.71mi | 3/2.0 | 1,458 (-6%) | 5mo | $330,000 | $226 | 52 |
| 25 W Glen St | 0.66mi | 3/1.5 | 1,706 (+9%) | 8mo | $299,000 | $175 | 46 |
| 10 Gilman St | 0.73mi | 3/1.0 | 1,408 (-10%) | 9mo | $335,000 | $238 | 38 |
| 42 Arnodale Ave | 0.73mi | 3/2.0 | 1,792 (+15%) | 6mo | $225,000 | $126 | 36 |
| 141 Saint Jerome Ave | 0.69mi | 4/1.5 (+1) | 1,768 (+13%) | 3mo | $330,000 | $187 | 36 |
Match score weights: distance 35% · size 25% · config 20% · recency 20%. Top-matched comps best support the ARV.
Projected returns pro-forma
-3.0% appreciation · 3.0% rent growth · sell at horizon
- IRR
- 0.6%
- Equity multiple
- 1.02×
- Total profit
- $1,048
- Equity at exit
- $23,857
- IRR
- 10.3%
- Equity multiple
- 1.80×
- Total profit
- $35,854
- Equity at exit
- $13,834
Cash invested: $44,800 (down + closing). Projections, not guarantees.
Landlord ↔ Tenant lean methodology
- Overall (STATE)
- 20 Strongly Tenant-Friendly
- State Massachusetts
- 20 Strongly Tenant-Friendly · D+15
- County
- — inherits STATE
- City
- — inherits STATE
ZIP-level market 01040
- Home prices YoY
- -33.2%
- Active inventory
- 43
- Price-to-rent
- 6.6×
Monthly cashflow live
- Estimated rent
- $2,025 high interval (Pro) →
- Mortgage (P&I)
- −$839
- Tax from tax record
- −$272 /mo · $3,260/yr
- Insurance
- −$67
- HOA
- −$0
- Vacancy / Maint / Mgmt
- −$425
- Net cashflow
- $422
Break-even live
Sensitivity live
| Price | -10% $513 | -5% $468 | +0% $422 | +5% $377 | +10% $332 |
|---|---|---|---|---|---|
| Rent | -10% $262 | -5% $342 | +0% $422 | +5% $502 | +10% $582 |
| Rate | -1.0pp $503 | -0.5pp $463 | base $422 | +0.5pp $381 | +1.0pp $339 |
UW: 25.0% down · 7.5% · 30yr · 1.5% tax · 5.0% vac · 8.0% maint · 8.0% mgmt
Financing live
Cash to close
- Down payment
- $40,000
- Closing costs
- $4,800
- Reserves months
- —
- Total cash needed
- —
Loan-product check · same deal, 3 products live
Conventional
25% down · 7.5% · 30yr
- Down + closing
- —
- Monthly P&I
- —
- Monthly cashflow
- —
- DSCR
- —
- Eligible?
- —
Personal DTI + credit; lowest rate.
DSCR
20% down · 8.5% · 30yr
- Down + closing
- —
- Monthly P&I
- —
- Monthly cashflow
- —
- DSCR
- —
- Eligible?
- —
No personal income docs; deal must DSCR.
Hard money
10% down · 12.0% · 12mo
- Down + closing
- —
- Monthly P&I
- —
- Monthly cashflow
- —
- DSCR
- —
- Eligible?
- —
Short-term bridge; refi at stabilization.
Rent comps 17 comps
| Address | Beds | Baths | Sqft | Rent | $/sqft | DOM | Units | Dist |
|---|---|---|---|---|---|---|---|---|
| 194 W Franklin St Unit 2 Holyoke, MA | 2.0 | 1.0 | 1100 | $1,700 | $1.55 | 22d | 1 | 0.48mi |
| 293 Clemente St Unit 3R Holyoke, MA | 3.0 | 1.0 | 1100 | $1,750 | $1.59 | 22d | 1 | 0.52mi |
| 297 Beech St Unit 3 Holyoke, MA | 4.0 | 1.0 | 1600 | $2,500 | $1.56 | 45d | 1 | 0.57mi |
| 11 Worcester Pl Unit 2 Holyoke, MA | 3.0 | 1.0 | 1500 | $1,850 | $1.23 | 22d | 1 | 0.59mi |
| 245 Sargeant St Apt 2 Holyoke, MA | 2.0 | 1.0 | 1200 | $2,000 | $1.67 | 22d | 1 | 0.74mi |
| 211 Walnut St Unit 2R Holyoke, MA | 2.0 | 1.0 | 1100 | $1,500 | $1.36 | 22d | 1 | 0.74mi |
| 267 Sargeant St Holyoke, MA | 2.0 | 1.0 | 1200 | $1,900 | $1.58 | 45d | 1 | 0.76mi |
| 1761-1763 Northampton St Unit 3 Holyoke, MA | 2.0 | 1.0 | 1500 | $1,800 | $1.20 | 15d | 1 | 0.78mi |
| 53 Forest St Chicopee, MA | 3.0 | 1.0 | 1100 | $1,650 | $1.50 | 45d | 1 | 0.79mi |
| 30 Bemis St Unit 3 Chicopee, MA | 2.0 | 1.0 | 1250 | $1,600 | $1.28 | 15d | 1 | 0.86mi |
| 664 Chicopee St Chicopee, MA | 3.0 | 1.0 | 1458 | $3,400 | $2.33 | 45d | 1 | 0.88mi |
| 664 Chicopee St Unit 2 Chicopee, MA | 3.0 | 1.0 | 1458 | $2,000 | $1.37 | 15d | 1 | 0.88mi |
| 828 Chicopee St Chicopee, MA | 3.0 | 1.0 | 1250 | $1,795 | $1.44 | 22d | 1 | 0.89mi |
| 12 Saint James Ave Holyoke, MA | 3.0 | 1.0 | 1295 | $2,100 | $1.62 | 15d | 1 | 0.94mi |
| 926 Chicopee St Unit 34 Chicopee, MA | 3.0 | 1.0 | 1200 | $1,900 | $1.58 | 45d | 1 | 0.95mi |
| 577 Pleasant St Apt 1L Holyoke, MA | 2.0 | 1.0 | 1100 | $1,795 | $1.63 | 45d | 1 | 0.98mi |
| 109 Ridgewood Ave Holyoke, MA | 3.0 | 1.5 | 1584 | $2,499 | $1.58 | 45d | 1 | 1.03mi |
Listing history 11 events
-
2026-06-18days on market $160,000 Active 15 DOM
-
2026-06-17days on market $160,000 Active 14 DOM
-
2026-06-16days on market $160,000 Active 13 DOM
-
2026-06-15days on market $160,000 Active 12 DOM
-
2026-06-14days on market $160,000 Active 10 DOM
-
2026-06-10days on market $160,000 Active 7 DOM
-
2026-06-09days on market $160,000 Active 6 DOM
-
2026-06-08days on market $160,000 Active 5 DOM
-
2026-06-07statusdays on market $160,000 Active 4 DOM
-
2026-06-03remarks 305-char remark
-
2026-06-03$160,000 New 1 DOM
ⓘ Source: listings_history table (triggers on properties + properties_extension) + one-shot
backfill from property_details.listing_events for pre-trigger history.
Tax reassessment forecast MA · Partial reset (capped growth)
- Current annual tax
- $3,260 · $272/mo
- Projected year-2 tax
- $3,260 · $272/mo
- Expected delta
- $0/yr ($0/mo · 0.0%)
ⓘ Screening estimate from a state-policy table — verify with the county assessor before closing.
Climate risk First Street
- Flood 1/10 Low FEMA zone X (unshaded) · 0% chance over 30 yrs
- Wildfire 1/10 Low
- Heat 4/10 Moderate 7 d/yr ≥98°F today · 16 d/yr by 30 yrs out
- Wind 4/10 Moderate 21% chance of damaging wind over 30 yrs
- Air quality 2/10 Low 1 unhealthy d/yr today · 1 by 30 yrs out
Nearby sold comps map
Loading sold comps map…
Walkable amenities ~0.75 mi
Loading nearby amenities…
Taxation est. · year 1
- Rental income
- $24,300
- − Mortgage interest
- −$8,962
- − Property taxes
- −$3,260
- − Insurance
- −$800
- − Repairs & maintenance
- −$1,944
- − Management
- −$1,944
- − Depreciation
- −$4,655
- Taxable income
- $2,735
- Est. tax owed @ 24.0%
- −$656
- After-tax cash flow
- $4,412/yr
For passive investors: Depreciation is non-cash, so a rental often shows a tax loss while cash-flowing — sheltering income. Rental losses are passive: they offset passive income freely, and up to $25,000/yr can offset ordinary (W-2) income if you actively participate and your MAGI is under $100k (phasing out to $0 by $150k); unused losses carry forward. On sale, claimed depreciation is recaptured at up to 25%, and gains may owe capital-gains tax (a 1031 exchange can defer both). Figures are a year-1 estimate at your 24.0% rate — not tax advice; consult a CPA.
Schools (NCES district)
- District
- Holyoke
- NCES district ID
- 2506270
- Math proficiency
- 5% ▼ -7.00%
- Reading proficiency
- 14% ▼ -5.00%
- Median HH income
- $35,495
- Composite
- 7.79/100
- National rank
- #9934
- State rank
- #302 of 302 in MA
Livability — Holyoke
- Score
- 62/100
- State rank
- #203
- US rank
- #16308
Category grades
Schools grade is shown separately in the Schools card above.
Census & demographics
- Census place
- Holyoke, MA
- County
- Hampden County · 230,965 people
- City population
- 37,813
- Metro
- Springfield, MA
- Population (ZIP)
- 37,813
- Household income
- $53,605
- Rent vs Own
- Severe rent burden
- 2404.0
Population outlook (Hampden County) Hauer SSP2
- Today (2025)
- 485,646 people
- By 2030
- 491,517 · +1.2%
- By 2040
- 500,539 · +3.1%
- By 2050
- 508,827 · +4.8%
- By 2075
- 539,167 · +11.0%
- By 2100
- 545,698 · +12.4%
Race, ethnicity, and origin ACS 2023
- Neighborhood character
- Majority Hispanic (52%)
- Race & ethnicity
- Hispanic / Latino 52% White 43% Two or more races 23% Black 2%
- Hispanic origin (detail)
- Puerto Rican 45% Dominican 2%
- Common ancestry
- Lithuanian 5% Romanian 4% Slovak 1%
- Foreign-born
- 6% · Canada, Jamaica
- Languages at home
- 58% English-only · Spanish 39% Russian/Polish/Slavic 1% French/Haitian/Cajun 1%
Political lean MEDSL · Hampden
- 2024 margin
- Lean D (+8.9) · D 53.4% · R 44.5% · Other 2.1%
- 2008→2024 swing
- -16.4pp toward R · 2008: 25.3pp · 2024: 8.9pp
- All cycles
- 2024: D+8.9 2020: D+17.7 2016: D+16.0 2012: D+25.4 2008: D+25.3
Not yet ingested
- Civics
- —
Market trends
- HPI YoY
- ▼ -146.03%
- Current HPI
- 293.93
- Rent YoY
- —
- Metro
- Springfield, MA
- State GDP YoY
- ▲ 2.28%
- F500 in state
- 38
Industry mix (Fortune 500 HQ in MA)
| Industry | F500 HQs | Revenue |
|---|---|---|
| Technology | 3 | $17B |
|
||
| Insurance | 2 | $84B |
|
||
| Retail | 2 | $76B |
|
||
| Life Sciences | 1 | $43B |
|
||
| Energy Technology | 1 | $31B |
|
||
| Aerospace / Defense | 1 | $18B |
|
||
Price history
1 event — show timeline
- 2026-06-02 Listed $160,000 MLS PIN
Property tax history
+3.6%/yrLatest (2023): $3,260 · +5.1% YoY. Source: county tax records.
Cash-flow waterfall
monthlySold comps — $/sqft
last 12 mo · ≤1 miLoading sold comps…