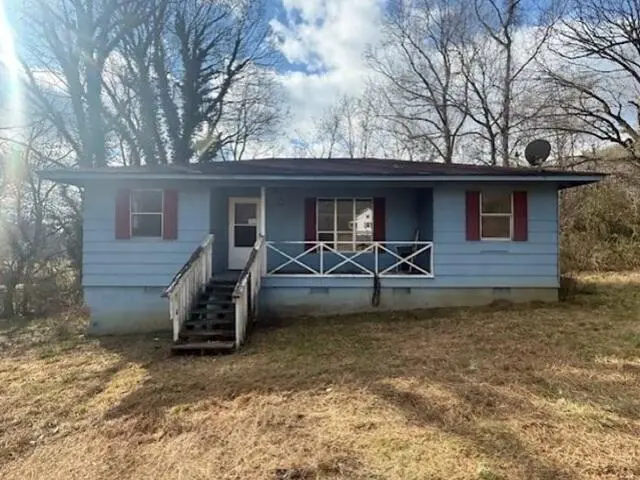
251 W Iowa Ave · Whitwell, TN
Flood risk 1/10 · Minimal
- FEMA flood zone
- X (unshaded)
- Chance of flooding over 30 yrs
- 0.0%
- Est. flood insurance / yr
- $507 – $1,088
Fire risk 5/10 · Moderate
- Est. fire insurance / yr
- $949 – $1,763
Heat risk 5/10 · Moderate
- Hot days now (above 105°F)
- 8 days/yr
- Hot days in 30 yrs
- 23 days/yr
Wind risk 4/10 · Minor
- Chance of severe wind over 30 yrs
- 10.0%
Air-quality risk 3/10 · Minor
- Unhealthy air days now
- 2 days/yr
- Unhealthy air days in 30 yrs
- 2 days/yr
Risk factors via First Street. Map © Google.
Why this score? — see what drove the B+ grade
The composite is a weighted blend of 9 inputs, each scored 0–100. Each bar is that input's sub-score; the figure is the points it added to the 100-point composite (weight × sub-score).
- Cash flow +28.6/30.0
- ARV discount +15.0/15.0
- DSCR +10.0/10.0
- Appreciation +7.4/10.0
- 1% rule +6.8/10.0
- Livability +2.8/5.0
- Rent growth +2.5/5.0
- Condition / age +2.5/5.0
- Schools +2.1/10.0
$82,000
🖨 Deal sheet 📄 Offer letter ✓ Due diligence
Listing remarks
Have you considered a move to the countryside? Check out this cute three bedroom, one bathroom home on . 63 acres! Lovely surroundings and set off the road for extra privacy. Home needs some work. RESERVE AUCTION PROPERTY- Property sold ''AS-IS'' without contingencies, repairs, warranties, guarantees or representation as to listing accuracy, property information, photo or other depiction included or described herein. Inspect before bidding.
Key facts
- 0.63 acre lot
- Built 1985
- Listed 24 days
Property features AI
Finance
- Other: Property listed as residential single-family residence; Lot approximately 0.63 acres (approx. dimensions 160 x 172 irr)
- Financial info: Tax information not included (tax amount excluded)
- HOA & community: Subdivision: Rolling Hills
Exterior
- Parking: Other parking (details not specified)
- Security: Not specified
- Utilities: Public water available; Sewer available (septic tank)
- Home design: Single-family house; One level
- Construction: Frame construction; Slab foundation; Built year not specified
- Exterior features: No additional exterior features listed; Composition/Shingle roof
Interior
- Kitchen: No kitchen appliance details provided
- Bedrooms: Not specified
- Flooring: Not specified
- Bathrooms: One full bathroom
- Heating & cooling: Has heating (type not specified); Has cooling (type not specified)
- Interior features: Six total rooms; No basement
- Laundry & utility: No laundry details provided
Neighborhood map
What this means for you Summary
Snapshot
- This is a 3-bed/1.0-bath single-family listed at $82k.
Deal economics
- At list price, monthly cash flow is $269 ($3k/yr) — positive.
- The deal already cash-flows at list — no discount required.
- Meets the 1% rule at list price ($967 rent vs $82k).
- Recommended offer: $81k (1.5% below list) — sets the bar for market timing.
- Cap rate 10.2% vs local median 2.9% in Whitwell — top-decile yield for the area; either an underpriced asset or a hidden risk that comps aren't pricing in. Stress-test before assuming the spread holds.
Location & tenants
- Location reads 56/100 on livability (#346 in TN) — a working-class tenant base; expect higher turnover. Strengths: cost of living A+, housing A+, crime B; Watch: amenities F, commute F, health & safety F.
- Marion County (town): math 24% / reading 25% proficiency, ranked #89 of 139 in TN (top 64%) — low school quality limits family demand, transient renter base, plan for 1-2y turnover.
- Zoned schools: Whitwell Elementary (math 47% / reading 37%, grade F, #191 of 952 statewide, top 22%, 492 students, 0% FRL); Whitwell Middle School (math 23% / reading 19%, grade F, #187 of 333 statewide, top 58%, 308 students, 0% FRL); Whitwell High School (math 12% / reading 32%, grade F, #163 of 332 statewide, top 51%, 343 students, 0% FRL) — zoned schools average 0% FRL vs 57% district-wide (57 pts lower); this property's tenant base skews higher-income than the district average.
- Market conditions: 80 active listings in the ZIP; 225 units permitted in Marion County in 2024 (0 in 5+ unit buildings).
Forward outlook
- In year one you build about $5k of equity ($567 loan paydown + $4k appreciation (4.8% local appreciation)).
- At projected returns (4.8% appreciation + 3.0% rent growth), your $23k cash investment doubles in ~3 years — after that, you're playing with house money.
- By year 8, paydown + projected appreciation supports a ~$34k cash-out refi (75% LTV) — recoverable capital for the next deal without selling this one.
Negotiation context
- It's been on market 24 days — a 2% lower offer ($81k) is reasonable based on typical stale-listing flexibility.
Risks & watch-outs
- Climate carrying-cost: moderate wildfire risk; extreme-heat days projected 8→23/yr by 2055 (HVAC capex compounding) — expect insurance premiums to compound above CPI over the hold.
Questions for the listing agent
- Is there a deadline driving the sale (1031 exchange, divorce, estate, relocation)? That informs how much negotiation room exists.
- Schools are F-rated, which usually means shorter tenancies and higher turnover. Who's the typical renter profile here, and what's been the actual vacancy rate?
- What's the average days-on-market for RENTAL listings here right now (not sales)? A rising rental-DOM trend means longer vacancies and softer asking-rent achievability than the comps imply.
- What's the recent tenant-quality profile in this submarket — average credit score on applications, eviction rate, late-payment / NSF rate, and stable-employment percentage? A property-management company in the area should have these aggregated.
- How much new for-sale + rental construction is in the pipeline within 1–3 miles? Heavy new supply typically softens prices + rents 12–24 months out; constrained supply supports both.
Investment metrics
- 1% rule
- 1.18% ✓
- Cap rate
- 10.23%
- Cash-on-cash
- 14.07%
- DSCR
- 1.63
- GRM
- 7.1
CMA / ARV
- ARV (on-the-fly)
- $140,148
- Comps found
- 1
Show comp detail 1 sale within ~0.75 mi
| Address | Dist | Beds/Ba | Sqft | Sold | Price | $/sf | Match |
|---|---|---|---|---|---|---|---|
| 426 S Elm St | 0.72mi | 3/1.0 | 1,040 (+14%) | 16mo | $159,000 | $153 | 31 |
Match score weights: distance 35% · size 25% · config 20% · recency 20%. Top-matched comps best support the ARV.
Projected returns pro-forma
4.83% appreciation · 3.0% rent growth · sell at horizon
- IRR
- 24.7%
- Equity multiple
- 2.53×
- Total profit
- $35,238
- Equity at exit
- $45,639
- IRR
- 24.0%
- Equity multiple
- 5.01×
- Total profit
- $92,035
- Equity at exit
- $78,090
Cash invested: $22,960 (down + closing). Projections, not guarantees.
Landlord ↔ Tenant lean methodology
- Overall (STATE)
- 87 Strongly Landlord-Friendly
- State Tennessee
- 87 Strongly Landlord-Friendly · R+13
- County
- — inherits STATE
- City
- — inherits STATE
ZIP-level market 37397
- Home prices YoY
- 1.6%
- Active inventory
- 80
- Price-to-rent
- 7.1×
Monthly cashflow live
- Estimated rent
- $967 medium interval (Pro) →
- Mortgage (P&I)
- −$430
- Tax from tax record
- −$31 /mo · $366/yr
- Insurance
- −$34
- HOA
- −$0
- Vacancy / Maint / Mgmt
- −$203
- Net cashflow
- $269
Break-even live
UW: 25.0% down · 7.5% · 30yr · 1.5% tax · 5.0% vac · 8.0% maint · 8.0% mgmt
Financing live
Cash to close
- Down payment
- $20,500
- Closing costs
- $2,460
- Reserves months
- —
- Total cash needed
- —
Loan-product check · same deal, 3 products live
Conventional
25% down · 7.5% · 30yr
- Down + closing
- —
- Monthly P&I
- —
- Monthly cashflow
- —
- DSCR
- —
- Eligible?
- —
Personal DTI + credit; lowest rate.
DSCR
20% down · 8.5% · 30yr
- Down + closing
- —
- Monthly P&I
- —
- Monthly cashflow
- —
- DSCR
- —
- Eligible?
- —
No personal income docs; deal must DSCR.
Hard money
10% down · 12.0% · 12mo
- Down + closing
- —
- Monthly P&I
- —
- Monthly cashflow
- —
- DSCR
- —
- Eligible?
- —
Short-term bridge; refi at stabilization.
Listing history 16 events
-
2026-06-16status $82,000 Pending 24 DOM
-
2026-06-15days on market $82,000 Active 24 DOM
-
2026-06-14days on market $82,000 Active 22 DOM
-
2026-06-13days on market $82,000 Active 21 DOM
-
2026-06-10days on market $82,000 Active 19 DOM
-
2026-06-09days on market $82,000 Active 18 DOM
-
2026-06-08days on market $82,000 Active 17 DOM
-
2026-06-07days on market $82,000 Active 16 DOM
-
2026-06-05days on market $82,000 Active 13 DOM
-
2026-06-03days on market $82,000 Active 12 DOM
-
2026-06-02days on market $82,000 Active 11 DOM
-
2026-06-01days on market $82,000 Active 10 DOM
-
2026-05-31days on market $82,000 Active 9 DOM
-
2026-05-30days on market $82,000 Active 8 DOM
-
2026-05-22$82,000 Active
-
2026-04-02price $82,000
ⓘ Source: listings_history table (triggers on properties + properties_extension) + one-shot
backfill from property_details.listing_events for pre-trigger history.
Tax reassessment forecast TN · Resets to sale price
- Current annual tax
- $366 · $31/mo
- Projected year-2 tax
- $582 · $49/mo
- Expected delta
- +$216/yr (+$18/mo · 59.0%)
ⓘ Screening estimate from a state-policy table — verify with the county assessor before closing.
Climate risk First Street
- Flood 1/10 Low FEMA zone X (unshaded) · 0% chance over 30 yrs
- Wildfire 5/10 Major
- Heat 5/10 Major 8 d/yr ≥105°F today · 23 d/yr by 30 yrs out
- Wind 4/10 Moderate 10% chance of damaging wind over 30 yrs
- Air quality 3/10 Moderate 2 unhealthy d/yr today · 2 by 30 yrs out
Nearby sold comps map
Loading sold comps map…
Walkable amenities ~0.75 mi
Loading nearby amenities…
Taxation est. · year 1
- Rental income
- $11,604
- − Mortgage interest
- −$4,593
- − Property taxes
- −$366
- − Insurance
- −$410
- − Repairs & maintenance
- −$928
- − Management
- −$928
- − Depreciation
- −$2,385
- Taxable income
- $1,992
- Est. tax owed @ 24.0%
- −$478
- After-tax cash flow
- $2,753/yr
For passive investors: Depreciation is non-cash, so a rental often shows a tax loss while cash-flowing — sheltering income. Rental losses are passive: they offset passive income freely, and up to $25,000/yr can offset ordinary (W-2) income if you actively participate and your MAGI is under $100k (phasing out to $0 by $150k); unused losses carry forward. On sale, claimed depreciation is recaptured at up to 25%, and gains may owe capital-gains tax (a 1031 exchange can defer both). Figures are a year-1 estimate at your 24.0% rate — not tax advice; consult a CPA.
Schools (NCES district)
- District
- Marion County
- NCES district ID
- 4702640
- Math proficiency
- 24% ▼ -2.00%
- Reading proficiency
- 25% ▼ -3.00%
- Median HH income
- $41,941
- Composite
- 20.88/100
- National rank
- #8494
- State rank
- #89 of 139 in TN
Livability — Whitwell
- Score
- 56/100
- State rank
- #346
- US rank
- #22851
Category grades
Schools grade is shown separately in the Schools card above.
Census & demographics
- Census place
- Whitwell, TN
- City population
- 10,044
- Population (ZIP)
- 10,044
Population outlook (Marion County) Hauer SSP2
- Today (2025)
- 28,889 people
- By 2030
- 28,915 · +0.1%
- By 2040
- 28,662 · -0.8%
- By 2050
- 28,053 · -2.9%
- By 2075
- 26,855 · -7.0%
- By 2100
- 24,404 · -15.5%
Race, ethnicity, and origin ACS 2023
- Neighborhood character
- Predominantly White (94%)
- Race & ethnicity
- White 94% Two or more races 3% Hispanic / Latino 2% Black 1%
- Common ancestry
- Serbian 2% Lithuanian 1% Slovak 1%
- Foreign-born
- 1% · Canada
- Languages at home
- 99% English-only · Spanish 1%
Political lean MEDSL · Marion
- 2024 margin
- Solid R (+55.7) · D 21.7% · R 77.4%
- 2008→2024 swing
- -34.3pp toward R · 2008: -21.4pp · 2024: -55.7pp
- All cycles
- 2024: R+55.7 2020: R+50.8 2016: R+44.8 2012: R+22.3 2008: R+21.4
Not yet ingested
- Civics
- —
Market trends
- HPI YoY
- ▲ 4.83%
- Current HPI
- 307.3072
- Rent YoY
- —
- Metro
- —
- State GDP YoY
- ▲ 2.78%
- F500 in state
- 22
Industry mix (Fortune 500 HQ in TN)
| Industry | F500 HQs | Revenue |
|---|---|---|
| Healthcare | 3 | $91B |
|
||
| Retail | 3 | $72B |
|
||
| Transportation / Logistics | 1 | $88B |
|
||
| Paper / Packaging | 1 | $19B |
|
||
| Insurance | 1 | $13B |
|
||
| Energy | 1 | $12B |
|
||
Price history
+0.0% since first listed2 events — show timeline
- 2026-05-22 Listed $82,000 GCAR
- 2026-04-02 Price Changed $82,000 GCAR
Property tax history
+1.9%/yrLatest (2025): $366 · +0.0% YoY. Source: county tax records.
Cash-flow waterfall
monthlySold comps — $/sqft
last 12 mo · ≤1 miLoading sold comps…