21 Eric Ave · Nashua, NH
Flood risk 1/10 · Minimal
- FEMA flood zone
- X (unshaded)
- Chance of flooding over 30 yrs
- 0.0%
- Est. flood insurance / yr
- $507 – $1,088
Fire risk 2/10 · Minimal
- Est. fire insurance / yr
- $507 – $941
Heat risk 4/10 · Minor
- Hot days now (above 97°F)
- 7 days/yr
- Hot days in 30 yrs
- 15 days/yr
Wind risk 6/10 · Moderate
- Chance of severe wind over 30 yrs
- 27.0%
Air-quality risk 2/10 · Minimal
- Unhealthy air days now
- 0 days/yr
- Unhealthy air days in 30 yrs
- 2 days/yr
Risk factors via First Street. Map © Google.
Why this score? — see what drove the D- grade
The composite is a weighted blend of 9 inputs, each scored 0–100. Each bar is that input's sub-score; the figure is the points it added to the 100-point composite (weight × sub-score).
- Cash flow +9.5/30.0
- ARV discount +8.3/15.0
- 1% rule +5.5/10.0
- Livability +4.2/5.0
- Rent growth +3.1/5.0
- Schools +3.1/10.0
- DSCR +2.7/10.0
- Condition / age +2.5/5.0
- Appreciation +0.0/10.0
$295,000
🖨 Deal sheet 📄 Offer letter ✓ Due diligence
Listing remarks MLS
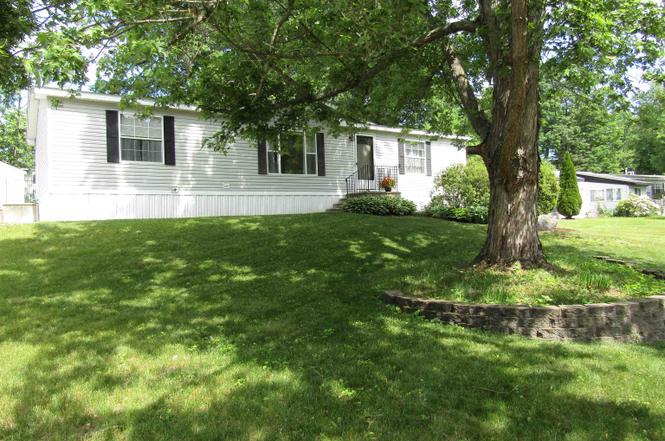
Fabulous Home and Ready for the next owner to move right in! Nicely maintained 3 bedroom 2 bath home with soaking tub in the Primary bath along with a stand up shower. Sitting on a nicely appointed corner lot with fully fenced in back yard. Sit outside and entertain on the freshly stained deck just off the dining area. The Kitchen has plenty of cabinet and counter space for cooking and appliances are included! The Central Air conditioning will be a welcomed addition for the hot summer days. The laundry is conveniently located off the kitchen with washer and dryer included. The full bath and 2 ample sized bedrooms make up the rest of the house! The large shed is great for storage space and the driveway parks 2 cars comfortably. Propane heat and tankless water heater. Come see your new home! Park approval required. Pets allowed.
Key facts
- Bright kitchen
- Landscaped grounds
- Spacious deck
Tags
Property features AI
Finance
- Other: Road frontage is association-maintained; Property on a corner within Rodgers Mobile Home Park (GPS recommended for directions)
- HOA & community: Monthly community/park fee of $530; Fee covers plowing, sewer, trash, water and park rent; Located in Rodgers Mobile Home Park; park approval required
Exterior
- Parking: Paved driveway
- Utilities: Public water; Community sewer; Circuit breaker electrical; Cable internet available; Gas provided by LP/bottle
- Home design: Double wide / Manufactured home; Single-story (main level entry); Gray exterior
- Construction: Built in 2003; Wood frame construction; Asphalt shingle roof; Victorian Patriot multisection mobile (model NR210N)
- Exterior features: Corner lot; Curbing; Landscaped yard; Sloping lot; Paved driveway
Interior
- Kitchen: Kitchen on main level; Dishwasher; Refrigerator
- Bedrooms: Three bedrooms (all on main level); One bedroom includes a private bath
- Flooring: Vinyl plank
- Bathrooms: One full bathroom; One three-quarter bathroom
- Heating & cooling: Forced air heat (propane); Central air conditioning
- Interior features: Six total rooms; Vinyl plank flooring; On-demand (tankless) water heater
- Laundry & utility: Washer and dryer included
Neighborhood map
What this means for you Summary
Snapshot
- This is a 3-bed/2.0-bath manufactured listed at $295k.
Deal economics
- At list price, monthly cash flow is $-204 ($-2k/yr) — negative.
- To cash-flow at today's rent, offer at most $259k (12.2% below list).
- Meets the 1% rule at list price ($3k rent vs $295k).
- Recommended offer: $259k (12.2% below list) — sets the bar for cash-flow.
- Cap rate 5.5% vs local median 2.9% in Nashua — top-decile yield for the area; either an underpriced asset or a hidden risk that comps aren't pricing in. Stress-test before assuming the spread holds.
Location & tenants
- Location reads 83/100 on livability (#11 in NH, #983 nationally) — a professional / high-income tenant draw. Strengths: commute A+, housing A+, health & safety A+; Watch: amenities D+.
- Nashua School District (urban): math 27% / reading 40% proficiency, ranked #77 of 98 in NH (top 79%) — families likely to look elsewhere, expect single-tenant / working-renter base with shorter leases.
- Market conditions: Rents rising (+2.5%/yr); 101 active listings in the ZIP; solid renter incomes; 981 units permitted in Hillsborough County in 2024 (381 in 5+ unit buildings).
- This rent runs 35% of the median local income ($108k/yr) — at the standard rent-burdened threshold; future hikes will face affordability resistance.
Forward outlook
- Local home prices are declining (-3.0%/yr); year-one equity from $2k of loan paydown is wiped out by about $9k of value loss. Plan a longer hold.
- Hillsborough County population projected to shrink 8% by 2050 — rents likely to lag national; underwrite the cash flow, not the appreciation.
Negotiation context
- Only 1 days on market — expect competitive offers; lowballing is unlikely to land.
- 4 sale attempts since 18y ago with the ask held roughly flat each time — persistent listings suggest the price (not the market) is what's stuck; bring a comps-based counter.
- Current owner paid $250k; 18% above their basis — modest negotiation headroom, anchor on the comps not their cost.
Risks & watch-outs
- Climate carrying-cost: major wind risk, 27% chance of damaging wind over 30y — expect insurance premiums to compound above CPI over the hold.
Questions for the listing agent
- What do current leases actually rent for vs. the listed asking? Can we see a recent rent roll and the last 12 months of T-12 income?
- What does the HOA fee cover, when was the last increase, and are there any pending special assessments or reserve-fund shortfalls?
- Is there a deadline driving the sale (1031 exchange, divorce, estate, relocation)? That informs how much negotiation room exists.
- Schools are B-rated — typically a magnet for longer-tenancy family renters. What's the average tenant stay here, and is there a school-zone premium baked into asking?
- The area grade is low — what's the realistic commute time and amenity access for the typical tenant pool here? Any planned neighborhood developments (good or bad) we should know about?
- What's the average days-on-market for RENTAL listings here right now (not sales)? A rising rental-DOM trend means longer vacancies and softer asking-rent achievability than the comps imply.
- What's the recent tenant-quality profile in this submarket — average credit score on applications, eviction rate, late-payment / NSF rate, and stable-employment percentage? A property-management company in the area should have these aggregated.
- How much new for-sale + rental construction is in the pipeline within 1–3 miles? Heavy new supply typically softens prices + rents 12–24 months out; constrained supply supports both.
Investment metrics
- 1% rule
- 1.05% ✓
- Cap rate
- 5.46%
- Cash-on-cash
- -2.97%
- DSCR
- 0.87
- GRM
- 7.9
CMA / ARV
- ARV (on-the-fly)
- $300,144
- Comps found
- 5
Show comp detail 5 sales within ~0.75 mi
| Address | Dist | Beds/Ba | Sqft | Sold | Price | $/sf | Match |
|---|---|---|---|---|---|---|---|
| 21 Shawn Ave | 0.04mi | 3/2.0 | 1,319 (-2%) | 3mo | $318,000 | $241 | 91 |
| 17 Eric Ave #1517 | 0.04mi | 3/2.0 | 1,352 (0%) | 12mo | $300,000 | $222 | 89 |
| 4 Ponderosa Ave | 0.14mi | 3/2.0 | 1,390 (+3%) | 11mo | $274,900 | $198 | 80 |
| 14 Eric Ave | 0.11mi | 3/2.0 | 1,296 (-4%) | 12mo | $305,000 | $235 | 78 |
| 13 Satin Ave | 0.05mi | 3/1.5 | 1,248 (-8%) | 11mo | $128,500 | $103 | 74 |
Match score weights: distance 35% · size 25% · config 20% · recency 20%. Top-matched comps best support the ARV.
Projected returns pro-forma
-3.0% appreciation · 2.53% rent growth · sell at horizon
- IRR
- -21.8%
- Equity multiple
- 0.25×
- Total profit
- $-61,859
- Equity at exit
- $43,985
- IRR
- -16.6%
- Equity multiple
- 0.09×
- Total profit
- $-74,841
- Equity at exit
- $25,506
Cash invested: $82,600 (down + closing). Projections, not guarantees.
Landlord ↔ Tenant lean methodology
- Overall (STATE)
- 56 Moderately Landlord-Leaning
- State New Hampshire
- 56 Moderately Landlord-Leaning · D+1
- County
- — inherits STATE
- City
- — inherits STATE
ZIP-level market 03062
- Rents YoY
- 2.5%
- Active inventory
- 101
- Price-to-rent
- 7.9×
Monthly cashflow live
- Estimated rent
- $3,094 medium interval (Pro) →
- Mortgage (P&I)
- −$1,547
- Tax from tax record
- −$448 /mo · $5,381/yr
- Insurance
- −$123
- HOA
- −$530
- Vacancy / Maint / Mgmt
- −$650
- Net cashflow
- $-204
Break-even live
UW: 25.0% down · 7.5% · 30yr · 1.5% tax · 5.0% vac · 8.0% maint · 8.0% mgmt
Financing live
Cash to close
- Down payment
- $73,750
- Closing costs
- $8,850
- Reserves months
- —
- Total cash needed
- —
Loan-product check · same deal, 3 products live
Conventional
25% down · 7.5% · 30yr
- Down + closing
- —
- Monthly P&I
- —
- Monthly cashflow
- —
- DSCR
- —
- Eligible?
- —
Personal DTI + credit; lowest rate.
DSCR
20% down · 8.5% · 30yr
- Down + closing
- —
- Monthly P&I
- —
- Monthly cashflow
- —
- DSCR
- —
- Eligible?
- —
No personal income docs; deal must DSCR.
Hard money
10% down · 12.0% · 12mo
- Down + closing
- —
- Monthly P&I
- —
- Monthly cashflow
- —
- DSCR
- —
- Eligible?
- —
Short-term bridge; refi at stabilization.
HOA detail
- Monthly dues
- $530 · $6,360/yr
- Likely covers
- water
Listing history 2 events
-
2026-06-18remarks 692-char remark
-
2026-06-18$295,000 Active 1 DOM
ⓘ Source: listings_history table (triggers on properties + properties_extension) + one-shot
backfill from property_details.listing_events for pre-trigger history.
Tax reassessment forecast NH · Partial reset (capped growth)
- Current annual tax
- $5,381 · $448/mo
- Projected year-2 tax
- $5,906 · $492/mo
- Expected delta
- +$525/yr (+$44/mo · 9.8%)
ⓘ Screening estimate from a state-policy table — verify with the county assessor before closing.
Climate risk First Street
- Flood 1/10 Low FEMA zone X (unshaded) · 0% chance over 30 yrs
- Wildfire 2/10 Low
- Heat 4/10 Moderate 7 d/yr ≥97°F today · 15 d/yr by 30 yrs out
- Wind 6/10 Major 27% chance of damaging wind over 30 yrs
- Air quality 2/10 Low 0 unhealthy d/yr today · 2 by 30 yrs out
Nearby sold comps map
Loading sold comps map…
Walkable amenities ~0.75 mi
Loading nearby amenities…
Taxation est. · year 1
- Rental income
- $37,122
- − Mortgage interest
- −$16,525
- − Property taxes
- −$5,381
- − Insurance
- −$1,475
- − Repairs & maintenance
- −$2,970
- − Management
- −$2,970
- − HOA
- −$6,360
- − Depreciation
- −$8,582
- Taxable loss
- −$7,140
- Est. tax savings @ 24.0%
- +$1,714
- After-tax cash flow
- $-740/yr
For passive investors: Depreciation is non-cash, so a rental often shows a tax loss while cash-flowing — sheltering income. Rental losses are passive: they offset passive income freely, and up to $25,000/yr can offset ordinary (W-2) income if you actively participate and your MAGI is under $100k (phasing out to $0 by $150k); unused losses carry forward. On sale, claimed depreciation is recaptured at up to 25%, and gains may owe capital-gains tax (a 1031 exchange can defer both). Figures are a year-1 estimate at your 24.0% rate — not tax advice; consult a CPA.
Schools (NCES district)
- District
- Nashua School District
- NCES district ID
- 3304980
- Math proficiency
- 27% ▼ -12.00%
- Reading proficiency
- 40% ▼ -6.00%
- Median HH income
- $66,393
- Composite
- 30.62/100
- National rank
- #6189
- State rank
- #77 of 98 in NH
Livability — Nashua
- Score
- 83/100
- State rank
- #11
- US rank
- #983
Category grades
Schools grade is shown separately in the Schools card above.
Census & demographics
- Census place
- Nashua, NH
- County
- Hillsborough County · 309,362 people
- City population
- 91,294
- Metro
- Manchester-Nashua, NH
- Population (ZIP)
- 29,441
- Household income
- $107,540
- Rent vs Own
- Severe rent burden
- 658.0
Population outlook (Hillsborough County) Hauer SSP2
- Today (2025)
- 412,771 people
- By 2030
- 410,974 · -0.4%
- By 2040
- 399,959 · -3.1%
- By 2050
- 381,542 · -7.6%
- By 2075
- 339,855 · -17.7%
- By 2100
- 289,270 · -29.9%
Race, ethnicity, and origin ACS 2023
- Neighborhood character
- Predominantly White (74%)
- Race & ethnicity
- White 74% Asian 15% Two or more races 5% Hispanic / Latino 5% Black 2%
- Hispanic origin (detail)
- Puerto Rican 2% Dominican 2%
- Common ancestry
- Lithuanian 9% Slovak 4% Romanian 3%
- Foreign-born
- 19% · Canada, China, Vietnam
- Languages at home
- 79% English-only · Other Asian/Pacific 6% Other Indo-European 5% Spanish 3%
Political lean MEDSL · Hillsborough
- 2024 margin
- Toss-up / Even · D 50.9% · R 48.0% · Other 1.0%
- 2008→2024 swing
- -0.9pp no change · 2008: 3.8pp · 2024: 2.9pp
- All cycles
- 2024: D+2.9 2020: D+7.7 2016: R+0.2 2012: D+1.7 2008: D+3.8
Not yet ingested
- Civics
- —
Market trends
- HPI YoY
- ▼ -432.67%
- Current HPI
- 309.5007
- Rent YoY
- ▲ 2.53%
- Metro
- Manchester-Nashua, NH
- State GDP YoY
- —
- F500 in state
- 0
Price history
+146.9% since first listed9 events — show timeline
- 2026-06-17 Listed $295,000 PrimeMLS
- 2022-09-02 Sold (MLS) $250,000 PrimeMLS
- 2022-08-07 Pending — PrimeMLS
- 2022-08-05 Listed $239,900 PrimeMLS
- 2013-09-26 Sold (Public Records) $86,500 Public Records
- 2013-09-25 Sold (MLS) $86,500 PrimeMLS
- 2013-08-01 Listed $89,980 PrimeMLS
- 2008-11-25 Sold (MLS) $105,000 PrimeMLS
- 2008-08-05 Listed $119,500 PrimeMLS
Property tax history
+9.6%/yrLatest (2025): $5,381 · +5.9% YoY. Source: county tax records.
Cash-flow waterfall
monthlySold comps — $/sqft
last 12 mo · ≤1 miLoading sold comps…