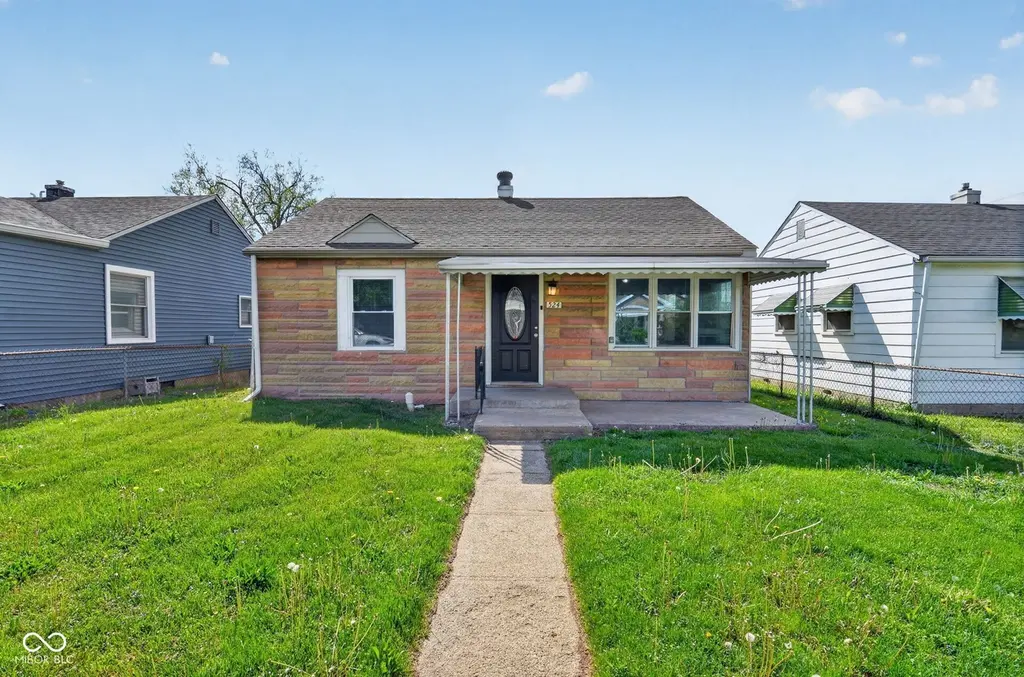
524 Leeds Ave · Indianapolis city (balance), IN
Flood risk 1/10 · Minimal
- FEMA flood zone
- X (unshaded)
- Chance of flooding over 30 yrs
- 0.0%
- Est. flood insurance / yr
- $473 – $860
Fire risk 1/10 · Minimal
- Est. fire insurance / yr
- $717 – $1,331
Heat risk 4/10 · Minor
- Hot days now (above 101°F)
- 7 days/yr
- Hot days in 30 yrs
- 19 days/yr
Wind risk 2/10 · Minimal
- Chance of severe wind over 30 yrs
- 0.0%
Air-quality risk 4/10 · Minor
- Unhealthy air days now
- 5 days/yr
- Unhealthy air days in 30 yrs
- 7 days/yr
Risk factors via First Street. Map © Google.
Why this score? — see what drove the C+ grade
The composite is a weighted blend of 9 inputs, each scored 0–100. Each bar is that input's sub-score; the figure is the points it added to the 100-point composite (weight × sub-score).
- Cash flow +22.1/30.0
- ARV discount +15.0/15.0
- DSCR +7.1/10.0
- 1% rule +6.2/10.0
- Rent growth +3.2/5.0
- Livability +2.5/5.0
- Condition / age +2.5/5.0
- Schools +1.4/10.0
- Appreciation +0.0/10.0
$109,900
🖨 Deal sheet (PDF) 📄 Offer letter ✓ Due diligence
Listing remarks
Welcome to this cozy single-family home located on the south side of Indianapolis. Built in the late 1940s, this property offers a functional layout with comfortable living spaces and a classic design that reflects its era. The home features a practical floor plan with a bright living area, an efficient kitchen, and well-sized bedrooms. Situated on a quiet residential street, the property provides a peaceful setting with a manageable yard suitable for outdoor enjoyment or future improvements. Conveniently located near major roadways, schools, parks, and shopping, this home offers easy access to downtown Indianapolis and surrounding areas. This property presents a great opportunity for homeo
Key facts
- 5,358 sq ft lot
- 2 garage spots
- Built 1949
Neighborhood map
What this means for you Summary
Snapshot
- This is a 2-bed/1.5-bath single-family listed at $110k.
Deal economics
- At list price, monthly cash flow is $177 ($2k/yr) — positive.
- The deal already cash-flows at list — no discount required.
- Meets the 1% rule at list price ($1k rent vs $110k).
- Cap rate 8.2% vs local median 4.4% in Indianapolis city (balance) — top-decile yield for the area; either an underpriced asset or a hidden risk that comps aren't pricing in. Stress-test before assuming the spread holds.
Location & tenants
- Location reads: area grade C — affects rentability + tenant quality, not the cash-flow math above.
- Indianapolis Public Schools (urban): math 14% / reading 20% proficiency, ranked #286 of 301 in IN (top 95%) — low school quality limits family demand, transient renter base, plan for 1-2y turnover; 77% free/reduced lunch — lower-income household profile, screen leases tightly.
- Zoned schools: William Mckinley School 39 (math 23% / reading 15%, grade F, #829 of 994 statewide, top 84%, 369 students, 76% FRL); H L Harshman Middle School (math 3% / reading 16%, grade F, #316 of 330 statewide, top 96%, 549 students, 84% FRL); Arsenal Technical High School (math 6% / reading 27%, grade F, #353 of 369 statewide, top 96%, 2,366 students, 74% FRL) — zoned schools at 78% FRL track the district average.
- Market conditions: Rents rising (+2.9%/yr); 500 active listings in the ZIP; 40 comparable units currently listed for rent nearby; rentals at typical pace (median 25d on market — plan ~3-4 weeks tenant-placement turnaround); 48% of comp listings sitting > 30 days — soft ceiling on asking rent; 1,906 units permitted in Marion County in 2024 (621 in 5+ unit buildings).
Forward outlook
- Local home prices are declining (-3.0%/yr); year-one equity from $760 of loan paydown is wiped out by about $3k of value loss. Plan a longer hold.
- Marion County population projected at +18% by 2050 — long-run rental-demand tailwind backs the buy-and-hold thesis.
Negotiation context
- Only 7 days on market — expect competitive offers; lowballing is unlikely to land.
Risks & watch-outs
- Watch-outs: built in 1949 — expect roof / HVAC / electrical / plumbing capex.
Questions for the listing agent
- Built in 1949 — when were the roof, HVAC, electrical panel, plumbing, and water heater last replaced?
- Is there a deadline driving the sale (1031 exchange, divorce, estate, relocation)? That informs how much negotiation room exists.
- What's the average days-on-market for RENTAL listings here right now (not sales)? A rising rental-DOM trend means longer vacancies and softer asking-rent achievability than the comps imply.
- What's the recent tenant-quality profile in this submarket — average credit score on applications, eviction rate, late-payment / NSF rate, and stable-employment percentage? A property-management company in the area should have these aggregated.
- How much new for-sale + rental construction is in the pipeline within 1–3 miles? Heavy new supply typically softens prices + rents 12–24 months out; constrained supply supports both.
Investment metrics
- 1% rule
- 1.12% ✓
- Cap rate
- 8.23%
- Cash-on-cash
- 6.91%
- DSCR
- 1.31
- GRM
- 7.4
CMA / ARV
- ARV (on-the-fly)
- $172,040
- Comps found
- 12
Show comp detail 12 sales within ~0.75 mi
| Address | Dist | Beds/Ba | Sqft | Sold | Price | $/sf | Match |
|---|---|---|---|---|---|---|---|
| 543 Leeds Ave | 0.04mi | 2/1.0 | 856 (-7%) | 13mo | $172,500 | $202 | 74 |
| 917 St Peter St | 0.39mi | 2/1.0 | 913 (-1%) | 9mo | $90,000 | $99 | 71 |
| 274 Leeds Ave | 0.28mi | 3/2.0 (+1) | 936 (+2%) | 12mo | $100,000 | $107 | 67 |
| 3106 Newton Ave | 0.53mi | 3/2.0 (+1) | 912 (-1%) | 1mo | $95,500 | $105 | 66 |
| 2251 English Ave | 0.32mi | 3/1.0 (+1) | 960 (+4%) | 10mo | $179,900 | $187 | 62 |
| 425 S Oakland Ave | 0.31mi | 2/1.0 | 834 (-9%) | 13mo | $105,000 | $126 | 58 |
| 1917 Fletcher Ave | 0.54mi | 2/1.0 | 980 (+6%) | 13mo | $240,000 | $245 | 51 |
| 331 S Oakland Ave | 0.36mi | 3/1.0 (+1) | 1,056 (+15%) | 5mo | $135,000 | $128 | 47 |
| 1118 Churchman Ave | 0.61mi | 2/2.0 | 812 (-12%) | 7mo | $244,000 | $300 | 44 |
| 3780 E Pleasant Run Parkway North Dr | 0.75mi | 3/1.0 (+1) | 1,026 (+12%) | 3mo | $136,000 | $133 | 36 |
| 1641 Deloss St | 0.71mi | 3/1.5 (+1) | 1,038 (+13%) | 9mo | $205,000 | $197 | 33 |
| 1145 Villa Ave | 0.71mi | 3/2.0 (+1) | 1,044 (+14%) | 8mo | $299,900 | $287 | 31 |
Match score weights: distance 35% · size 25% · config 20% · recency 20%. Top-matched comps best support the ARV.
Projected returns pro-forma
-3.0% appreciation · 2.88% rent growth · sell at horizon
- IRR
- -5.8%
- Equity multiple
- 0.78×
- Total profit
- $-6,632
- Equity at exit
- $16,386
- IRR
- 3.7%
- Equity multiple
- 1.27×
- Total profit
- $8,317
- Equity at exit
- $9,502
Cash invested: $30,772 (down + closing). Projections, not guarantees.
Landlord ↔ Tenant lean methodology
- Overall (STATE)
- 90 Strongly Landlord-Friendly
- State Indiana
- 90 Strongly Landlord-Friendly · R+11
- County
- — inherits STATE
- City
- — inherits STATE
ZIP-level market 46203
- Home prices YoY
- -26.7%
- Rents YoY
- 2.9%
- Active inventory
- 500
- Price-to-rent
- 7.4×
Monthly cashflow live
- Estimated rent
- $1,235 high interval (Pro) →
- Mortgage (P&I)
- −$576
- Tax from tax record
- −$177 /mo · $2,120/yr
- Insurance
- −$46
- HOA
- −$0
- Vacancy / Maint / Mgmt
- −$259
- Net cashflow
- $177
Break-even live
Sensitivity live
| Price | -10% $239 | -5% $208 | +0% $177 | +5% $146 | +10% $115 |
|---|---|---|---|---|---|
| Rent | -10% $80 | -5% $128 | +0% $177 | +5% $226 | +10% $275 |
| Rate | -1.0pp $232 | -0.5pp $205 | base $177 | +0.5pp $149 | +1.0pp $120 |
UW: 25.0% down · 7.5% · 30yr · 1.5% tax · 5.0% vac · 8.0% maint · 8.0% mgmt
Financing live
Cash to close
- Down payment
- $27,475
- Closing costs
- $3,297
- Reserves months
- —
- Total cash needed
- —
Loan-product check · same deal, 3 products live
Conventional
25% down · 7.5% · 30yr
- Down + closing
- —
- Monthly P&I
- —
- Monthly cashflow
- —
- DSCR
- —
- Eligible?
- —
Personal DTI + credit; lowest rate.
DSCR
20% down · 8.5% · 30yr
- Down + closing
- —
- Monthly P&I
- —
- Monthly cashflow
- —
- DSCR
- —
- Eligible?
- —
No personal income docs; deal must DSCR.
Hard money
10% down · 12.0% · 12mo
- Down + closing
- —
- Monthly P&I
- —
- Monthly cashflow
- —
- DSCR
- —
- Eligible?
- —
Short-term bridge; refi at stabilization.
Rent comps 40 comps
| Address | Beds | Baths | Sqft | Rent | $/sqft | DOM | Units | Dist |
|---|---|---|---|---|---|---|---|---|
| 2631 Southeastern Ave Indianapolis, IN | 3.0 | 2.0 | 1072 | $1,195 | $1.11 | 13d | 1 | 0.08mi |
| 453 S Keystone Ave Indianapolis, IN | 2.0 | 1.5 | 950 | $1,150 | $1.21 | 0d | 1 | 0.18mi |
| 330 S Rural St Indianapolis, IN | 2.0 | 1.0 | 960 | $1,050 | $1.09 | 9d | 1 | 0.22mi |
| 350 S Oxford St Indianapolis, IN | 3.0 | 1.0 | 826 | $1,300 | $1.57 | 45d | 1 | 0.24mi |
| 323 S Rural St Indianapolis, IN | 3.0 | 1.5 | 1090 | $1,050 | $0.96 | 45d | 1 | 0.26mi |
| 3022 English Ave Unit 3022 Indianapolis, IN | 2.0 | 1.0 | 600 | $650 | $1.08 | 45d | 1 | 0.27mi |
| 2230 Woodlawn Ave Indianapolis, IN | 2.0 | 1.0 | 924 | $1,350 | $1.46 | 45d | 1 | 0.44mi |
| 340 S Dearborn St Indianapolis, IN | 2.0 | 1.0 | 873 | $1,180 | $1.35 | 25d | 1 | 0.44mi |
| 225 Hamilton Ave Indianapolis, IN | 2.0 | 2.0 | 1008 | $1,695 | $1.68 | 45d | 1 | 0.45mi |
| 301 S Gray St Indianapolis, IN | 2.0 | 1.0 | 841 | $1,025 | $1.22 | 25d | 1 | 0.46mi |
| 423 Villa Ave Indianapolis, IN | 1.0 | 1.0 | 593 | $799 | $1.35 | 25d | 1 | 0.50mi |
| 2025 Southeastern Ave Indianapolis, IN | 1.0 | 1.0 | 663 | $775 | $1.17 | 45d | 1 | 0.50mi |
| 2034 Southeastern Ave Indianapolis, IN | 1.0 | 1.0 | 525 | $850 | $1.62 | 16d | 1 | 0.51mi |
| 2116 Woodlawn Ave Indianapolis, IN | 2.0 | 2.0 | 1054 | $1,175 | $1.11 | 9d | 1 | 0.51mi |
| 1011 Harlan St Indianapolis, IN | 2.0 | 2.0 | 1008 | $1,525 | $1.51 | 45d | 1 | 0.54mi |
| 1013 Harlan St Indianapolis, IN | 2.0 | 1.0 | 1008 | $1,475 | $1.46 | 45d | 1 | 0.54mi |
| 270 S Lasalle St Indianapolis, IN | 3.0 | 2.0 | 562 | $1,329 | $2.36 | 9d | 1 | 0.54mi |
| 49 S Rural St Indianapolis, IN | 2.0 | 1.5 | 750 | $950 | $1.27 | 12d | 1 | 0.56mi |
| 1912 Lexington Ave Unit 1910B Indianapolis, IN | 1.0 | 1.0 | 660 | $850 | $1.29 | 45d | 1 | 0.56mi |
| 247 S Randolph St Indianapolis, IN | 2.0 | 1.0 | 720 | $750 | $1.04 | 45d | 1 | 0.59mi |
| 245 S Randolph St Indianapolis, IN | 2.0 | 1.0 | 720 | $750 | $1.04 | 45d | 1 | 0.59mi |
| 815 Dawson St Unit 2 Indianapolis, IN | 2.0 | 1.0 | 600 | $1,300 | $2.17 | 6d | 1 | 0.64mi |
| 3441 Prospect St Indianapolis, IN | 2.0 | 1.0 | 1008 | $1,700 | $1.69 | 46d | 1 | 0.68mi |
| 3441 Prospect St Indianapolis, IN | 2.0 | 1.0 | 1008 | $1,500 | $1.49 | 25d | 1 | 0.68mi |
| 518 S State Ave Indianapolis, IN | 2.0 | 1.0 | 900 | $725 | $0.81 | 45d | 1 | 0.68mi |
| 1718 Southeastern Ave Indianapolis, IN | 1.0 | 1.0 | 700 | $1,080 | $1.54 | 45d | 1 | 0.72mi |
| 28 S Dearborn St Unit A Indianapolis, IN | 3.0 | 1.0 | 1100 | $1,400 | $1.27 | 12d | 1 | 0.72mi |
| 1023 S State Ave Indianapolis, IN | 1.0 | 1.0 | 600 | $1,099 | $1.83 | 25d | 1 | 0.76mi |
| 3702 Hoyt Ave Indianapolis, IN | 3.0 | 2.0 | 960 | $1,500 | $1.56 | 15d | 1 | 0.78mi |
| 3706 Hoyt Ave Indianapolis, IN | 3.0 | 1.0 | 960 | $1,500 | $1.56 | 15d | 1 | 0.79mi |
| 37 S Tuxedo St Indianapolis, IN | 3.0 | 1.0 | 950 | $1,150 | $1.21 | 45d | 1 | 0.80mi |
| 1505 S Rural St Indianapolis, IN | 3.0 | 1.0 | 1104 | $1,500 | $1.36 | 14d | 1 | 0.85mi |
| 1449 Fletcher Ave Indianapolis, IN | 2.0 | 2.0 | 1000 | $2,000 | $2.00 | 19d | 1 | 0.87mi |
| 225 N Hamilton Ave Indianapolis, IN | 2.0 | 2.0 | 1008 | $1,695 | $1.68 | 45d | 1 | 0.87mi |
| 235 N Oakland Ave Indianapolis, IN | 2.0 | 1.0 | 800 | $1,000 | $1.25 | 45d | 1 | 0.88mi |
| 2211 E New York St Unit B Indianapolis, IN | 1.0 | 1.0 | 650 | $725 | $1.12 | 23d | 1 | 0.89mi |
| 2211 E New York St Unit B Indianapolis, IN | 1.0 | 1.0 | 650 | $699 | $1.08 | 0d | 1 | 0.89mi |
| 313 Eastern Ave Indianapolis, IN | 2.0 | 1.0 | 1040 | $950 | $0.91 | 23d | 1 | 0.91mi |
| 3518 Terrace Ave Indianapolis, IN | 3.0 | 1.0 | 864 | $1,300 | $1.50 | 45d | 1 | 0.93mi |
| 228 N Randolph St Indianapolis, IN | 2.0 | 2.0 | 1008 | $1,695 | $1.68 | 45d | 1 | 0.94mi |
Listing history 2 events
-
2026-04-24status Pending
-
2026-04-17$109,900 Active
ⓘ Source: listings_history table (triggers on properties + properties_extension) + one-shot
backfill from property_details.listing_events for pre-trigger history.
Tax reassessment forecast IN · Partial reset (capped growth)
- Current annual tax
- $2,120 · $177/mo
- Projected year-2 tax
- $2,120 · $177/mo
- Expected delta
- $0/yr ($0/mo · 0.0%)
ⓘ Screening estimate from a state-policy table — verify with the county assessor before closing.
Climate risk First Street
- Flood 1/10 Low FEMA zone X (unshaded) · 0% chance over 30 yrs
- Wildfire 1/10 Low
- Heat 4/10 Moderate 7 d/yr ≥101°F today · 19 d/yr by 30 yrs out
- Wind 2/10 Low 0% chance of damaging wind over 30 yrs
- Air quality 4/10 Moderate 5 unhealthy d/yr today · 7 by 30 yrs out
Nearby sold comps map
Loading sold comps map…
Walkable amenities ~0.75 mi
Loading nearby amenities…
Taxation est. · year 1
- Rental income
- $14,824
- − Mortgage interest
- −$6,156
- − Property taxes
- −$2,120
- − Insurance
- −$550
- − Repairs & maintenance
- −$1,186
- − Management
- −$1,186
- − Depreciation
- −$3,197
- Taxable income
- $430
- Est. tax owed @ 24.0%
- −$103
- After-tax cash flow
- $2,023/yr
For passive investors: Depreciation is non-cash, so a rental often shows a tax loss while cash-flowing — sheltering income. Rental losses are passive: they offset passive income freely, and up to $25,000/yr can offset ordinary (W-2) income if you actively participate and your MAGI is under $100k (phasing out to $0 by $150k); unused losses carry forward. On sale, claimed depreciation is recaptured at up to 25%, and gains may owe capital-gains tax (a 1031 exchange can defer both). Figures are a year-1 estimate at your 24.0% rate — not tax advice; consult a CPA.
Schools (NCES district)
- District
- Indianapolis Public Schools
- NCES district ID
- 1804770
- Math proficiency
- 14% ▼ -7.00%
- Reading proficiency
- 20% ▼ -3.00%
- Median HH income
- $32,034
- Composite
- 13.69/100
- National rank
- #9499
- State rank
- #286 of 301 in IN
Livability — Indianapolis city (balance)
No livability data for this city. (Only ~50 U.S. cities are tracked.)
Census & demographics
- Census place
- Indianapolis city (balance), IN
- County
- Marion County · 998,460 people
- City population
- 881,119
- Metro
- Indianapolis-Carmel-Anderson, IN
- Population (ZIP)
- 37,758
- Household income
- $57,393
- Rent vs Own
- Severe rent burden
- 1499.0
Population outlook (Marion County) Hauer SSP2
- Today (2025)
- 1,025,572 people
- By 2030
- 1,065,727 · +3.9%
- By 2040
- 1,141,577 · +11.3%
- By 2050
- 1,208,920 · +17.9%
- By 2075
- 1,367,288 · +33.3%
- By 2100
- 1,438,201 · +40.2%
Race, ethnicity, and origin ACS 2023
- Neighborhood character
- Predominantly White (69%)
- Race & ethnicity
- White 69% Hispanic / Latino 14% Black 12% Two or more races 8% Asian 2% Native American 1%
- Hispanic origin (detail)
- Mexican 12% Puerto Rican 1%
- Common ancestry
- Slovak 2% Lithuanian 2% Italian 1%
- Foreign-born
- 8% · Canada
- Languages at home
- 88% English-only · Spanish 10% Other Indo-European 1%
Political lean MEDSL · Marion
- 2024 margin
- Strong D (+27.7) · D 63.0% · R 35.3% · Other 1.7%
- 2008→2024 swing
- -0.7pp no change · 2008: 28.4pp · 2024: 27.7pp
- All cycles
- 2024: D+27.7 2020: D+29.1 2016: D+22.8 2012: D+22.2 2008: D+28.4
Not yet ingested
- Civics
- —
Market trends
- HPI YoY
- ▼ -127.37%
- Current HPI
- 349.579
- Rent YoY
- ▲ 2.88%
- Metro
- Indianapolis-Carmel-Anderson, IN
- State GDP YoY
- ▲ 2.90%
- F500 in state
- 18
Industry mix (Fortune 500 HQ in IN)
| Industry | F500 HQs | Revenue |
|---|---|---|
| Industrial Machinery | 2 | $37B |
|
||
| Healthcare | 1 | $177B |
|
||
| Pharmaceuticals | 1 | $45B |
|
||
| Metals / Steel | 1 | $18B |
|
||
| Agriculture | 1 | $17B |
|
||
| Packaging | 1 | $12B |
|
||
Price history
2 events — show timeline
- 2026-04-24 Pending — MIBOR as Distributed by MLS Grid
- 2026-04-17 Listed $109,900 MIBOR as Distributed by MLS Grid
Property tax history
+18.8%/yrLatest (2025): $2,120 · +13.4% YoY. Source: county tax records.
Cash-flow waterfall
monthlySold comps — $/sqft
last 12 mo · ≤1 miLoading sold comps…