 🏷️ Likely Rental
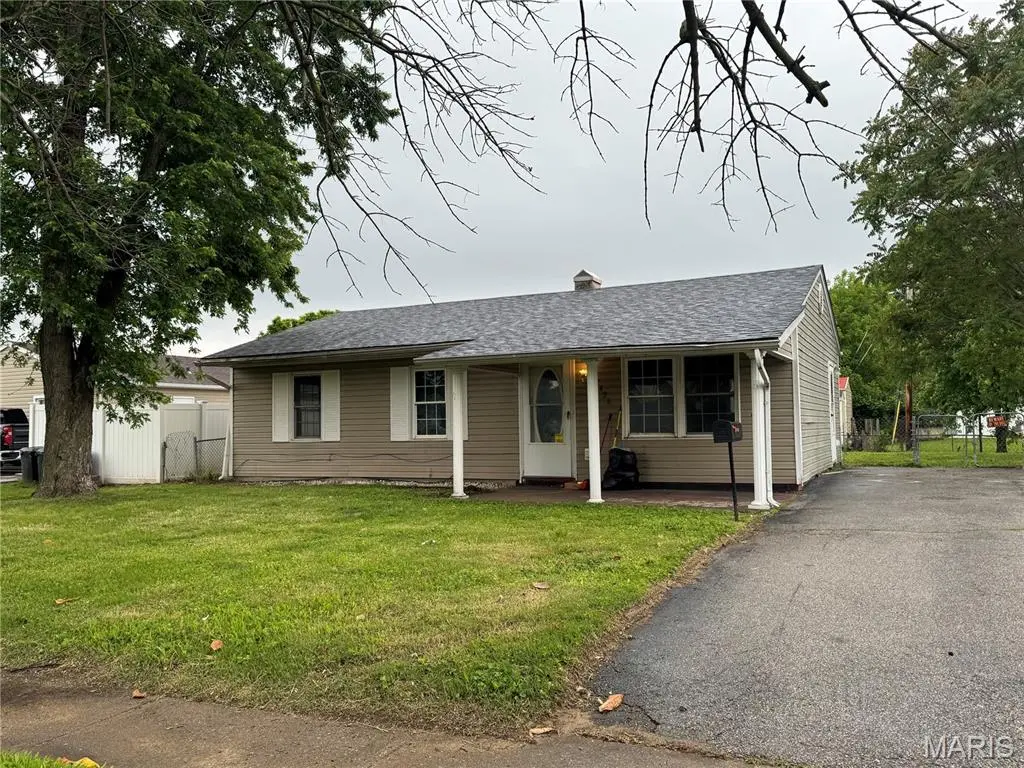
2428 Sunbury Ave · Granite City, IL
Flood risk 1/10 · Minimal
- FEMA flood zone
- X
- Chance of flooding over 30 yrs
- 0.0%
- Est. flood insurance / yr
- $507 – $1,088
Fire risk 1/10 · Minimal
- Est. fire insurance / yr
- $804 – $1,492
Heat risk 6/10 · Moderate
- Hot days now (above 108°F)
- 7 days/yr
- Hot days in 30 yrs
- 21 days/yr
Wind risk 2/10 · Minimal
- Chance of severe wind over 30 yrs
- 1.0%
Air-quality risk 4/10 · Minor
- Unhealthy air days now
- 4 days/yr
- Unhealthy air days in 30 yrs
- 5 days/yr
Risk factors via First Street. Map © Google.
Why this score? — see what drove the B grade
The composite is a weighted blend of 9 inputs, each scored 0–100. Each bar is that input's sub-score; the figure is the points it added to the 100-point composite (weight × sub-score).
- Cash flow +30.0/30.0
- ARV discount +15.0/15.0
- 1% rule +10.0/10.0
- DSCR +10.0/10.0
- Livability +3.2/5.0
- Rent growth +2.9/5.0
- Condition / age +2.5/5.0
- Schools +0.9/10.0
- Appreciation +0.0/10.0
$74,900
🖨 Deal sheet 📄 Offer letter ✓ Due diligence
Listing remarks
Opportunity is knocking at 2428 Sunbury in Granite City! This 3-bedroom, 1-bath home is full of potential and priced with upside in mind—estimated ARV of $130K+. Whether you're an investor or a buyer looking to build equity, this property offers a strong foundation to bring your vision to life. Situated on a well-kept street, the home features a large fenced-in backyard—perfect for pets, entertaining, or future enhancements. Inside, you'll find an eat-in kitchen, a spacious laundry room, and a layout that’s open to customization and modern updates. The property has already been professionally cleaned following tenant move-out, giving you a fresh start from day one. Major i
Key facts
- 7,440 sq ft lot
- Built 1960
- Listed 28 days
Property features AI
Finance
- Other: Ownership listed as owner by contract; Lot about 0.17 acres (approx. 62 x 120)
- Financial info: Lease not considered
Exterior
- Parking: Concrete driveway and off-street parking
- Utilities: Public water; Public sewer; Electricity connected (220 volts)
- Home design: Single-family residence (attached); One story; Property listed as fixer
- Construction: Vinyl siding; Architectural shingle roof; Combination foundation; Built area reported as 864 (above grade)
- Exterior features: Covered front porch; Back yard with some trees; Chain link fencing
Interior
- Kitchen: No kitchen appliances specified
- Bedrooms: Three bedrooms, all on the main level
- Flooring: Carpet; Wood
- Bathrooms: One full bathroom on the main level
- Heating & cooling: Forced air heating; Central air conditioning; Ceiling fans
- Interior features: Carpet and wood flooring; No built-in appliances listed
- Laundry & utility: No laundry appliances specified
Neighborhood map
What this means for you Summary
Snapshot
- This is a 3-bed/1.0-bath single-family listed at $75k.
Deal economics
- At list price, monthly cash flow is $467 ($6k/yr) — positive.
- The deal already cash-flows at list — no discount required.
- Meets the 1% rule at list price ($1k rent vs $75k).
- Recommended offer: $74k (1.5% below list) — sets the bar for market timing.
- Cap rate 13.8% vs local median 7.0% in Granite City — top-decile yield for the area; either an underpriced asset or a hidden risk that comps aren't pricing in. Stress-test before assuming the spread holds.
Location & tenants
- Location reads 65/100 on livability (#623 in IL) — a middle-class / working-renter tenant base. Strengths: cost of living A+, housing A+; Watch: crime F, amenities F, commute F.
- Granite City CUSD 9 (suburban): math 9% / reading 11% proficiency, ranked #570 of 620 in IL (top 92%) — low school quality limits family demand, transient renter base, plan for 1-2y turnover.
- Zoned schools: Granite City High School (math 10% / reading 12%, grade F, #522 of 693 statewide, top 76%, 1,805 students, 0% FRL) — zoned schools average 0% FRL vs 59% district-wide (59 pts lower); this property's tenant base skews higher-income than the district average.
- Market conditions: Rents rising (+1.7%/yr); 194 active listings in the ZIP; 2 comparable units currently listed for rent nearby; 336 units permitted in Madison County in 2024 (0 in 5+ unit buildings).
Forward outlook
- Local home prices are declining (-3.0%/yr); year-one equity from $518 of loan paydown is wiped out by about $2k of value loss. Plan a longer hold.
- Madison County population projected at -18% by 2050 — secular population decline; favor cash flow + early exit over multi-decade hold.
- At projected returns (-3.0% appreciation + 1.7% rent growth), your $21k cash investment doubles in ~5 years — after that, you're playing with house money.
Negotiation context
- It's been on market 28 days — a 2% lower offer ($74k) is reasonable based on typical stale-listing flexibility.
Risks & watch-outs
- Climate carrying-cost: extreme-heat days projected 7→21/yr by 2055 (HVAC capex compounding) — expect insurance premiums to compound above CPI over the hold.
Questions for the listing agent
- Built in 1960 — when were the roof, HVAC, electrical panel, plumbing, and water heater last replaced?
- Is there a deadline driving the sale (1031 exchange, divorce, estate, relocation)? That informs how much negotiation room exists.
- Schools are F-rated, which usually means shorter tenancies and higher turnover. Who's the typical renter profile here, and what's been the actual vacancy rate?
- Crime grade is F in this area — have there been break-ins, vandalism, or insurance claims at this property in the last 3 years? What carrier currently insures it and at what premium?
- What's the average days-on-market for RENTAL listings here right now (not sales)? A rising rental-DOM trend means longer vacancies and softer asking-rent achievability than the comps imply.
- What's the recent tenant-quality profile in this submarket — average credit score on applications, eviction rate, late-payment / NSF rate, and stable-employment percentage? A property-management company in the area should have these aggregated.
- How much new for-sale + rental construction is in the pipeline within 1–3 miles? Heavy new supply typically softens prices + rents 12–24 months out; constrained supply supports both.
Investment metrics
- 1% rule
- 1.73% ✓
- Cap rate
- 13.77%
- Cash-on-cash
- 26.70%
- DSCR
- 2.19
- GRM
- 4.8
CMA / ARV
- ARV (median comp)
- $110,995
- List price
- $74,900
- Delta
- -32.52%
- Verdict
- UNDERPRICED
- Comps
- 20 within 1.0 mi
Show comp detail 12 sales within ~0.75 mi
| Address | Dist | Beds/Ba | Sqft | Sold | Price | $/sf | Match |
|---|---|---|---|---|---|---|---|
| 2428 Sunbury Ave | 0.00mi | 3/1.0 | 864 (0%) | 1mo | $74,900 | $87 | 99 |
| 2912 Ash Ave | 0.21mi | 3/1.0 | 912 (+6%) | 7mo | $115,000 | $126 | 75 |
| 10 Watertown Cir | 0.29mi | 3/1.0 | 928 (+7%) | 0mo | $109,000 | $117 | 74 |
| 1917 Joy Ave | 0.63mi | 3/1.0 | 875 (+1%) | 1mo | $118,900 | $136 | 67 |
| 2824 Birch Ave | 0.38mi | 3/1.0 | 944 (+9%) | 0mo | $105,000 | $111 | 67 |
| 2829 Dale Ave | 0.45mi | 3/1.0 | 944 (+9%) | 2mo | $129,900 | $138 | 62 |
| 1904 Joy Ave | 0.66mi | 2/1.0 (-1) | 875 (+1%) | 0mo | $79,900 | $91 | 62 |
| 2004 Elm Ave | 0.54mi | 3/1.0 | 944 (+9%) | 2mo | $124,900 | $132 | 58 |
| 2729 Dale Ave | 0.51mi | 3/1.0 | 944 (+9%) | 5mo | $135,000 | $143 | 57 |
| 3017 Ramona Dr | 0.64mi | 2/1.0 (-1) | 780 (-10%) | 3mo | $150,000 | $192 | 46 |
| 3140 Aubrey Ave | 0.75mi | 2/1.0 (-1) | 792 (-8%) | 5mo | $59,900 | $76 | 42 |
| 2822 Sunset Dr | 0.53mi | 2/1.0 (-1) | 988 (+14%) | 6mo | $80,000 | $81 | 41 |
Match score weights: distance 35% · size 25% · config 20% · recency 20%. Top-matched comps best support the ARV.
Projected returns pro-forma
-3.0% appreciation · 1.67% rent growth · sell at horizon
- IRR
- 19.0%
- Equity multiple
- 1.76×
- Total profit
- $15,909
- Equity at exit
- $11,168
- IRR
- 26.4%
- Equity multiple
- 3.17×
- Total profit
- $45,452
- Equity at exit
- $6,476
Cash invested: $20,972 (down + closing). Projections, not guarantees.
Landlord ↔ Tenant lean methodology
- Overall (STATE)
- 43 Moderately Tenant-Leaning
- State Illinois
- 43 Moderately Tenant-Leaning · D+7
- County
- — inherits STATE
- City
- — inherits STATE
ZIP-level market 62040
- Home prices YoY
- -21.8%
- Rents YoY
- 1.7%
- Active inventory
- 194
- Price-to-rent
- 4.8×
Monthly cashflow live
- Estimated rent
- $1,297 medium interval (Pro) →
- Mortgage (P&I)
- −$393
- Tax from tax record
- −$134 /mo · $1,611/yr
- Insurance
- −$31
- HOA
- −$0
- Vacancy / Maint / Mgmt
- −$272
- Net cashflow
- $467
Break-even live
UW: 25.0% down · 7.5% · 30yr · 1.5% tax · 5.0% vac · 8.0% maint · 8.0% mgmt
Financing live
Cash to close
- Down payment
- $18,725
- Closing costs
- $2,247
- Reserves months
- —
- Total cash needed
- —
Loan-product check · same deal, 3 products live
Conventional
25% down · 7.5% · 30yr
- Down + closing
- —
- Monthly P&I
- —
- Monthly cashflow
- —
- DSCR
- —
- Eligible?
- —
Personal DTI + credit; lowest rate.
DSCR
20% down · 8.5% · 30yr
- Down + closing
- —
- Monthly P&I
- —
- Monthly cashflow
- —
- DSCR
- —
- Eligible?
- —
No personal income docs; deal must DSCR.
Hard money
10% down · 12.0% · 12mo
- Down + closing
- —
- Monthly P&I
- —
- Monthly cashflow
- —
- DSCR
- —
- Eligible?
- —
Short-term bridge; refi at stabilization.
Rent comps 2 comps
| Address | Beds | Baths | Sqft | Rent | $/sqft | DOM | Units | Dist |
|---|---|---|---|---|---|---|---|---|
| 4404 Wabash Ave Granite City, IL | 2.0 | 1.0 | 864 | $1,025 | $1.19 | 3d | 1 | 1.44mi |
| 2415 Jerden Ave Granite City, IL | 3.0 | 1.0 | 970 | $1,400 | $1.44 | 4d | 1 | 1.49mi |
Listing history 4 events
-
2026-05-19historical Active Under Contract 896-char remark
-
2026-05-15price $74,900 896-char remark
-
2026-05-08price $79,900 896-char remark
-
2026-04-28$85,000 Active 896-char remark
ⓘ Source: listings_history table (triggers on properties + properties_extension) + one-shot
backfill from property_details.listing_events for pre-trigger history.
Tax reassessment forecast IL · Partial reset (capped growth)
- Current annual tax
- $1,611 · $134/mo
- Projected year-2 tax
- $1,656 · $138/mo
- Expected delta
- +$44/yr (+$4/mo · 2.8%)
ⓘ Screening estimate from a state-policy table — verify with the county assessor before closing.
Climate risk First Street
- Flood 1/10 Low FEMA zone X · 0% chance over 30 yrs
- Wildfire 1/10 Low
- Heat 6/10 Major 7 d/yr ≥108°F today · 21 d/yr by 30 yrs out
- Wind 2/10 Low 100% chance of damaging wind over 30 yrs
- Air quality 4/10 Moderate 4 unhealthy d/yr today · 5 by 30 yrs out
Nearby sold comps map
Loading sold comps map…
Walkable amenities ~0.75 mi
Loading nearby amenities…
Taxation est. · year 1
- Rental income
- $15,567
- − Mortgage interest
- −$4,196
- − Property taxes
- −$1,611
- − Insurance
- −$374
- − Repairs & maintenance
- −$1,245
- − Management
- −$1,245
- − Depreciation
- −$2,179
- Taxable income
- $4,716
- Est. tax owed @ 24.0%
- −$1,132
- After-tax cash flow
- $4,467/yr
For passive investors: Depreciation is non-cash, so a rental often shows a tax loss while cash-flowing — sheltering income. Rental losses are passive: they offset passive income freely, and up to $25,000/yr can offset ordinary (W-2) income if you actively participate and your MAGI is under $100k (phasing out to $0 by $150k); unused losses carry forward. On sale, claimed depreciation is recaptured at up to 25%, and gains may owe capital-gains tax (a 1031 exchange can defer both). Figures are a year-1 estimate at your 24.0% rate — not tax advice; consult a CPA.
Schools (NCES district)
- District
- Granite City CUSD 9
- NCES district ID
- 1717280
- Math proficiency
- 9% ▼ -4.00%
- Reading proficiency
- 11% ▼ -7.00%
- Median HH income
- $45,082
- Composite
- 9.15/100
- National rank
- #9864
- State rank
- #570 of 620 in IL
Livability — Granite City
- Score
- 65/100
- State rank
- #623
- US rank
- #12751
Category grades
Schools grade is shown separately in the Schools card above.
Census & demographics
- Census place
- Granite City, IL
- County
- Madison County · 189,064 people
- City population
- 40,404
- Metro
- St. Louis, MO-IL
- Population (ZIP)
- 40,404
- Household income
- $60,031
- Rent vs Own
- Severe rent burden
- 923.0
Population outlook (Madison County) Hauer SSP2
- Today (2025)
- 258,371 people
- By 2030
- 251,523 · -2.7%
- By 2040
- 233,640 · -9.6%
- By 2050
- 213,042 · -17.5%
- By 2075
- 165,255 · -36.0%
- By 2100
- 123,953 · -52.0%
Race, ethnicity, and origin ACS 2023
- Neighborhood character
- Predominantly White (76%)
- Race & ethnicity
- White 76% Hispanic / Latino 9% Black 9% Two or more races 7% Asian 1%
- Hispanic origin (detail)
- Mexican 7%
- Common ancestry
- Romanian 2% Lithuanian 2% Serbian 2%
- Foreign-born
- 3% · Canada, Vietnam
- Languages at home
- 93% English-only · Spanish 5%
Political lean MEDSL · Madison
- 2024 margin
- R (+13.3) · D 42.5% · R 55.8% · Other 1.8%
- 2008→2024 swing
- -22.5pp toward R · 2008: 9.2pp · 2024: -13.3pp
- All cycles
- 2024: R+13.3 2020: R+13.2 2016: R+15.6 2012: R+1.4 2008: D+9.2
Not yet ingested
- Civics
- —
Market trends
- HPI YoY
- ▼ -56.88%
- Current HPI
- 204.4612
- Rent YoY
- ▲ 1.67%
- Metro
- St. Louis, MO-IL
- State GDP YoY
- ▲ 1.59%
- F500 in state
- 60
Industry mix (Fortune 500 HQ in IL)
| Industry | F500 HQs | Revenue |
|---|---|---|
| Insurance | 4 | $201B |
|
||
| Consumer Goods | 4 | $87B |
|
||
| Industrial Machinery | 3 | $64B |
|
||
| Healthcare | 2 | $55B |
|
||
| Retail / Pharmacy | 1 | $148B |
|
||
| Agriculture / Food | 1 | $86B |
|
||
Price history
-14.7% since first listed7 events — show timeline
- 2026-06-08 Sold (Public Records) $72,500 Public Records
- 2026-06-01 Sold (MLS) — MARIS as Distributed by MLS Grid
- 2026-05-26 Pending — MARIS as Distributed by MLS Grid
- 2026-05-19 Contingent — MARIS as Distributed by MLS Grid
- 2026-05-15 Price Changed $74,900 MARIS as Distributed by MLS Grid
- 2026-05-08 Price Changed $79,900 MARIS as Distributed by MLS Grid
- 2026-04-28 Listed $85,000 MARIS as Distributed by MLS Grid
Property tax history
+3.8%/yrLatest (2024): $1,611 · +5.3% YoY. Source: county tax records.
Cash-flow waterfall
monthlySold comps — $/sqft
last 12 mo · ≤1 miLoading sold comps…