1831 W Blackhawk Ct · Citrus Springs, FL
Flood risk 1/10 · Minimal
- FEMA flood zone
- X (unshaded)
- Chance of flooding over 30 yrs
- 0.0%
- Est. flood insurance / yr
- $507 – $1,088
Fire risk 4/10 · Minor
- Est. fire insurance / yr
- $947 – $1,759
Heat risk 9/10 · Severe
- Hot days now (above 107°F)
- 7 days/yr
- Hot days in 30 yrs
- 23 days/yr
Wind risk 9/10 · Severe
- Chance of severe wind over 30 yrs
- 99.0%
Air-quality risk 2/10 · Minimal
- Unhealthy air days now
- 0 days/yr
- Unhealthy air days in 30 yrs
- 1 days/yr
Risk factors via First Street. Map © Google.
Why this score? — see what drove the F grade
The composite is a weighted blend of 9 inputs, each scored 0–100. Each bar is that input's sub-score; the figure is the points it added to the 100-point composite (weight × sub-score).
- ARV discount +7.5/15.0
- Cash flow +6.9/30.0
- Schools +4.1/10.0
- Livability +3.4/5.0
- Rent growth +2.5/5.0
- Condition / age +2.5/5.0
- 1% rule +1.8/10.0
- DSCR +1.1/10.0
- Appreciation +0.1/10.0
$289,990
🖨 Deal sheet (PDF) 📄 Offer letter ✓ Due diligence
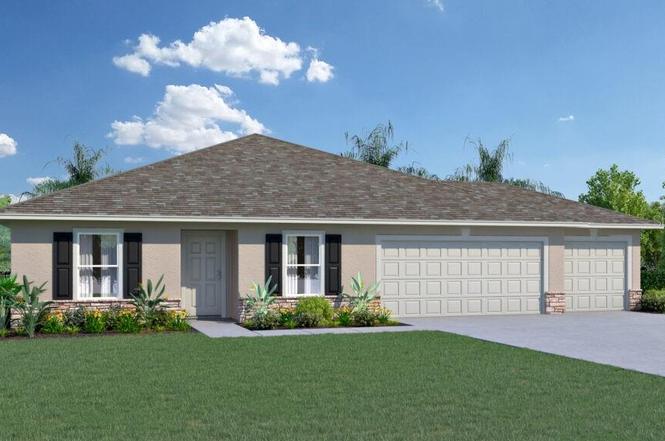
Listing remarks
MOVE IN READY! AVAILABLE NOW! The stunning Sylvester floor plan offers four spacious bedrooms, two full bathrooms, a rare three-car garage, and 1,806 square feet of beautifully designed living space. This open-concept home features a bright and welcoming great room that flows effortlessly into a modern kitchen, where a gorgeous walk-around island creates the perfect centerpiece for entertaining and everyday living. The split-bedroom layout offers maximum privacy, with the owner’s suite thoughtfully positioned on one side of the home and three additional bedrooms on the other. This is the perfect setup for families, guests, or even a home office. With a full one-year builder warrantie
Key facts
- 0.31 acre lot
- 3 garage spots
- Built 2026
Property features AI
Finance
- Other: Lot size about 0.31 acres (0.25–0.5 range); Concrete road access; Homestead not indicated; Zoned PDR; Home warranty included
Exterior
- Parking: Attached garage with 3 spaces
- Utilities: Public water; Septic tank; Electricity available and connected; Sewer available and connected; Underground utilities; Water available and connected
- Home design: Single family residence; One level; Faces south; New construction; Completed condition
- Construction: Block and stucco construction; Shingle roof; Slab foundation; Built by Holiday Builders (model: Sylvester)
- Exterior features: Rear porch
Interior
- Kitchen: Dishwasher; Range; Microwave; Electric water heater
- Bedrooms: 4 bedrooms
- Flooring: Carpet; Tile
- Bathrooms: 2 full bathrooms
- Heating & cooling: Electric heating; Central air
- Interior features: Solid wood cabinets; Split bedroom floorplan; Sliding doors
- Laundry & utility: Inside laundry
Neighborhood map
What this means for you Summary
Snapshot
- This is a 4-bed/2.0-bath land listed at $290k.
Deal economics
- At list price, monthly cash flow is $-436 ($-5k/yr) — negative.
- To cash-flow at today's rent, offer at most $227k (21.7% below list).
- To meet the 1% rule (rent ≥ 1% of price), the offer needs to be $199k (31.5% below list).
- Recommended offer: $199k (31.5% below list) — sets the bar for 1% rule.
Location & tenants
- Location reads 68/100 on livability (#521 in FL) — a middle-class / working-renter tenant base. Strengths: cost of living A+, housing A+; Watch: health & safety C-, employment D+, amenities F.
- Citrus (rural): math 49% / reading 50% proficiency, ranked #44 of 73 in FL (top 60%) — families likely to look elsewhere, expect single-tenant / working-renter base with shorter leases.
- Zoned schools: Citrus Springs Elementary School (math 52% / reading 48%, grade D+, #1,070 of 2,144 statewide, top 51%, 817 students, 71% FRL); Citrus Springs Middle School (math 55% / reading 54%, grade B-, #183 of 571 statewide, top 34%, 821 students, 59% FRL); Crystal River High School (math 31% / reading 44%, grade F, #336 of 667 statewide, top 51%, 1,249 students, 56% FRL) — zoned schools at 62% FRL track the district average.
- Market conditions: 1247 active listings in the ZIP; 19 comparable units currently listed for rent nearby; rentals at typical pace (median 23d on market — plan ~3-4 weeks tenant-placement turnaround); 2,443 units permitted in Citrus County in 2024 (0 in 5+ unit buildings).
- This rent runs 35% of the median local income ($69k/yr) — at the standard rent-burdened threshold; future hikes will face affordability resistance.
Forward outlook
- Local home prices are declining (-3.0%/yr); year-one equity from $2k of loan paydown is wiped out by about $9k of value loss. Plan a longer hold.
- Citrus County population projected to shrink 10% by 2050 — rents likely to lag national; underwrite the cash flow, not the appreciation.
Negotiation context
- It's been on market 156 days — a 12% lower offer ($255k) is reasonable based on typical stale-listing flexibility.
- 2 sale attempts with the ask held roughly flat each time — persistent listings suggest the price (not the market) is what's stuck; bring a comps-based counter.
- Current owner paid $10k; list at $290k implies a 2800% gain — meaningful room to come down on a strong offer.
Risks & watch-outs
- Climate carrying-cost: severe wind risk, 99% chance of damaging wind over 30y; extreme-heat days projected 7→23/yr by 2055 (HVAC capex compounding) — expect insurance premiums to compound above CPI over the hold.
Questions for the listing agent
- What do current leases actually rent for vs. the listed asking? Can we see a recent rent roll and the last 12 months of T-12 income?
- It's been on market 156 days. Have you received any prior offers? Is the seller open to a 32% concession, seller financing, or rate buy-down credit?
- Why hasn't it sold? Are there any deal-killer items the seller is aware of (foundation, flood, title, zoning, code violations)?
- Is there a deadline driving the sale (1031 exchange, divorce, estate, relocation)? That informs how much negotiation room exists.
- The area grade is low — what's the realistic commute time and amenity access for the typical tenant pool here? Any planned neighborhood developments (good or bad) we should know about?
- What's the average days-on-market for RENTAL listings here right now (not sales)? A rising rental-DOM trend means longer vacancies and softer asking-rent achievability than the comps imply.
- What's the recent tenant-quality profile in this submarket — average credit score on applications, eviction rate, late-payment / NSF rate, and stable-employment percentage? A property-management company in the area should have these aggregated.
- How much new for-sale + rental construction is in the pipeline within 1–3 miles? Heavy new supply typically softens prices + rents 12–24 months out; constrained supply supports both.
Investment metrics
- 1% rule
- 0.68% ✗
- Cap rate
- 4.49%
- Cash-on-cash
- -6.44%
- DSCR
- 0.71
- GRM
- 12.2
CMA / ARV
No comps found within radius.
Projected returns pro-forma
-3.0% appreciation · 3.0% rent growth · sell at horizon
- IRR
- -27.4%
- Equity multiple
- 0.08×
- Total profit
- $-74,722
- Equity at exit
- $43,238
- IRR
- -25.5%
- Equity multiple
- -0.24×
- Total profit
- $-100,692
- Equity at exit
- $25,073
Cash invested: $81,197 (down + closing). Projections, not guarantees.
Landlord ↔ Tenant lean methodology
- Overall (STATE)
- 87 Strongly Landlord-Friendly
- State Florida
- 87 Strongly Landlord-Friendly · R+3
- County
- — inherits STATE
- City
- — inherits STATE
ZIP-level market 34434
- Home prices YoY
- -2.9%
- Active inventory
- 1247
- Price-to-rent
- 12.2×
Monthly cashflow live
- Estimated rent
- $1,985 high interval (Pro) →
- Mortgage (P&I)
- −$1,521
- Tax est. 1.5%
- −$362 /mo · $4,350/yr
- Insurance
- −$121
- HOA
- −$0
- Vacancy / Maint / Mgmt
- −$417
- Net cashflow
- $-436
Break-even live
Sensitivity live
| Price | -10% $-235 | -5% $-336 | +0% $-436 | +5% $-536 | +10% $-636 |
|---|---|---|---|---|---|
| Rent | -10% $-593 | -5% $-514 | +0% $-436 | +5% $-357 | +10% $-279 |
| Rate | -1.0pp $-290 | -0.5pp $-362 | base $-436 | +0.5pp $-511 | +1.0pp $-587 |
UW: 25.0% down · 7.5% · 30yr · 1.5% tax · 5.0% vac · 8.0% maint · 8.0% mgmt
Financing live
Cash to close
- Down payment
- $72,498
- Closing costs
- $8,700
- Reserves months
- —
- Total cash needed
- —
Loan-product check · same deal, 3 products live
Conventional
25% down · 7.5% · 30yr
- Down + closing
- —
- Monthly P&I
- —
- Monthly cashflow
- —
- DSCR
- —
- Eligible?
- —
Personal DTI + credit; lowest rate.
DSCR
20% down · 8.5% · 30yr
- Down + closing
- —
- Monthly P&I
- —
- Monthly cashflow
- —
- DSCR
- —
- Eligible?
- —
No personal income docs; deal must DSCR.
Hard money
10% down · 12.0% · 12mo
- Down + closing
- —
- Monthly P&I
- —
- Monthly cashflow
- —
- DSCR
- —
- Eligible?
- —
Short-term bridge; refi at stabilization.
Rent comps 19 comps
| Address | Beds | Baths | Sqft | Rent | $/sqft | DOM | Units | Dist |
|---|---|---|---|---|---|---|---|---|
| 1924 W Roseboro Dr Dunnellon, FL | 4.0 | 2.0 | 1449 | $1,795 | $1.24 | 23d | 1 | 0.10mi |
| 10990 N Adler Dr Citrus Springs, FL | 4.0 | 2.0 | 1833 | $2,100 | $1.15 | 23d | 1 | 0.59mi |
| 10872 N Frantz Ave Citrus Springs, FL | 4.0 | 2.0 | 1449 | $1,815 | $1.25 | 23d | 1 | 0.60mi |
| 2315 W Striblin Dr Citrus Springs, FL | 4.0 | 2.5 | 2172 | $2,050 | $0.94 | 23d | 1 | 0.86mi |
| 1150 W G Martinelli Blvd Citrus Springs, FL | 3.0 | 2.0 | 1276 | $1,600 | $1.25 | 23d | 1 | 0.87mi |
| 9995 N Sandree Dr Citrus Springs, FL | 3.0 | 2.0 | 1453 | $1,895 | $1.30 | 23d | 1 | 0.91mi |
| 11112 N Easter Ter Citrus Springs, FL | 4.0 | 2.0 | 1800 | $1,800 | $1.00 | 23d | 1 | 0.95mi |
| 11128 N Easter Ter Citrus Springs, FL | 4.0 | 2.0 | 1800 | $1,800 | $1.00 | 23d | 1 | 0.96mi |
| 2799 W Sheila Dr Citrus Springs, FL | 4.0 | 2.0 | 1449 | $1,815 | $1.25 | 23d | 1 | 1.03mi |
| 2186 W G Martinelli Blvd Citrus Springs, FL | 3.0 | 2.0 | 1448 | $1,950 | $1.35 | 23d | 1 | 1.04mi |
| 9676 N Jourden Dr Citrus Springs, FL | 3.0 | 2.0 | 1353 | $1,750 | $1.29 | 23d | 1 | 1.09mi |
| 9475 N Camel Dr Dunnellon, FL | 3.0 | 2.0 | 1670 | $1,800 | $1.08 | 23d | 1 | 1.12mi |
| 2955 W Pintado Dr Citrus Springs, FL | 4.0 | 2.5 | 2054 | $2,095 | $1.02 | 23d | 1 | 1.15mi |
| 2963 W Sheila Dr Citrus Springs, FL | 4.0 | 3.0 | 1952 | $1,850 | $0.95 | 23d | 1 | 1.17mi |
| 11127 N Trigger Ter Citrus Springs, FL | 3.0 | 2.0 | 1409 | $1,795 | $1.27 | 23d | 1 | 1.24mi |
| 9730 N Elkcam Blvd Citrus Springs, FL | 4.0 | 2.0 | 1672 | $1,785 | $1.07 | 23d | 1 | 1.27mi |
| 9298 N Mendoza Way Citrus Springs, FL | 3.0 | 2.0 | 1350 | $1,800 | $1.33 | 23d | 1 | 1.34mi |
| 11745 W Shenandoah Way Citrus Springs, FL | 4.0 | 3.0 | 1836 | $1,745 | $0.95 | 23d | 1 | 1.49mi |
| 9305 N Citrus Springs Blvd Citrus Springs, FL | 3.0 | 2.0 | 1411 | $1,800 | $1.28 | 23d | 1 | 1.49mi |
Listing history 20 events
-
2026-06-21days on market $289,990 Active 156 DOM
-
2026-06-19days on market $289,990 Active 154 DOM
-
2026-06-18days on market $289,990 Active 153 DOM
-
2026-06-17days on market $289,990 Active 152 DOM
-
2026-06-16days on market $289,990 Active 151 DOM
-
2026-06-15days on market $289,990 Active 150 DOM
-
2026-06-14days on market $289,990 Active 148 DOM
-
2026-06-13pricedays on market $289,990 Active 147 DOM
-
2026-06-09days on market $279,990 Active 144 DOM
-
2026-06-08days on market $279,990 Active 143 DOM
-
2026-06-03days on market $279,990 Active 138 DOM
-
2026-06-02days on market $279,990 Active 137 DOM
-
2026-06-01days on market $279,990 Active 136 DOM
-
2026-05-31days on market $279,990 Active 135 DOM
-
2026-05-30days on market $279,990 Active 134 DOM
-
2026-05-21status Active
-
2026-04-17status Pending
-
2026-02-13price $279,990
-
2025-12-13$284,990 Active
-
2024-03-15soldstatus $10,000
ⓘ Source: listings_history table (triggers on properties + properties_extension) + one-shot
backfill from property_details.listing_events for pre-trigger history.
Climate risk First Street
- Flood 1/10 Low FEMA zone X (unshaded) · 0% chance over 30 yrs
- Wildfire 4/10 Moderate
- Heat 9/10 Extreme 7 d/yr ≥107°F today · 23 d/yr by 30 yrs out
- Wind 9/10 Extreme 99% chance of damaging wind over 30 yrs
- Air quality 2/10 Low 0 unhealthy d/yr today · 1 by 30 yrs out
Nearby sold comps map
Loading sold comps map…
Walkable amenities ~0.75 mi
Loading nearby amenities…
Taxation est. · year 1
- Rental income
- $23,820
- − Mortgage interest
- −$16,244
- − Property taxes
- −$4,350
- − Insurance
- −$1,450
- − Repairs & maintenance
- −$1,906
- − Management
- −$1,906
- − Depreciation
- −$8,436
- Taxable loss
- −$10,471
- Est. tax savings @ 24.0%
- +$2,513
- After-tax cash flow
- $-2,718/yr
For passive investors: Depreciation is non-cash, so a rental often shows a tax loss while cash-flowing — sheltering income. Rental losses are passive: they offset passive income freely, and up to $25,000/yr can offset ordinary (W-2) income if you actively participate and your MAGI is under $100k (phasing out to $0 by $150k); unused losses carry forward. On sale, claimed depreciation is recaptured at up to 25%, and gains may owe capital-gains tax (a 1031 exchange can defer both). Figures are a year-1 estimate at your 24.0% rate — not tax advice; consult a CPA.
Schools (NCES district)
- District
- Citrus
- NCES district ID
- 1200270
- Math proficiency
- 49% ▼ -10.00%
- Reading proficiency
- 50% ▼ -6.00%
- Median HH income
- $38,618
- Composite
- 41.28/100
- National rank
- #3519
- State rank
- #44 of 73 in FL
Livability — Citrus Springs
- Score
- 68/100
- State rank
- #521
- US rank
- #9598
Category grades
Schools grade is shown separately in the Schools card above.
Census & demographics
- Census place
- Citrus Springs, FL
- County
- Citrus County · 111,314 people
- City population
- 10,730
- Metro
- Homosassa Springs, FL
- Population (ZIP)
- 11,074
- Household income
- $68,939
- Rent vs Own
- Severe rent burden
- 171.0
Population outlook (Citrus County) Hauer SSP2
- Today (2025)
- 138,622 people
- By 2030
- 136,886 · -1.3%
- By 2040
- 132,009 · -4.8%
- By 2050
- 125,196 · -9.7%
- By 2075
- 108,570 · -21.7%
- By 2100
- 84,454 · -39.1%
Race, ethnicity, and origin ACS 2023
- Neighborhood character
- Predominantly White (78%)
- Race & ethnicity
- White 78% Two or more races 11% Hispanic / Latino 9% Black 6%
- Hispanic origin (detail)
- Mexican 3% Puerto Rican 4%
- Common ancestry
- Iranian 3% Romanian 2% Slovak 2%
- Foreign-born
- 4% · Canada
- Languages at home
- 93% English-only · Spanish 5% German/W. Germanic 1% Other Indo-European 1%
Political lean MEDSL · Citrus
- 2024 margin
- Solid R (+45.9) · D 26.8% · R 72.6%
- 2008→2024 swing
- -29.8pp toward R · 2008: -16.1pp · 2024: -45.9pp
- All cycles
- 2024: R+45.9 2020: R+41.0 2016: R+39.7 2012: R+21.9 2008: R+16.1
Not yet ingested
- Civics
- —
Market trends
- HPI YoY
- ▼ -9.70%
- Current HPI
- 328.2164
- Rent YoY
- —
- Metro
- Homosassa Springs, FL
- State GDP YoY
- ▲ 3.28%
- F500 in state
- 36
Industry mix (Fortune 500 HQ in FL)
| Industry | F500 HQs | Revenue |
|---|---|---|
| Industrial Technology | 2 | $29B |
|
||
| Insurance | 2 | $17B |
|
||
| Retail | 1 | $60B |
|
||
| Technology Distribution | 1 | $58B |
|
||
| Homebuilding | 1 | $35B |
|
||
| Technology Manufacturing | 1 | $35B |
|
||
Price history
+2699.9% since first listed5 events — show timeline
- 2026-05-21 Relisted — Stellar MLS as Distributed by MLS Grid
- 2026-04-17 Pending — Stellar MLS as Distributed by MLS Grid
- 2026-02-13 Price Changed $279,990 Stellar MLS as Distributed by MLS Grid
- 2025-12-13 Listed $284,990 Stellar MLS as Distributed by MLS Grid
- 2024-03-15 Sold (Public Records) $10,000 Public Records
Property tax history
+17.8%/yrLatest (2025): $314 · +121.2% YoY. Source: county tax records.
Cash-flow waterfall
monthlySold comps — $/sqft
last 12 mo · ≤1 miLoading sold comps…