467 SE Midway Dr Unit A · Silver Springs Shores, FL
Flood risk 1/10 · Minimal
- FEMA flood zone
- X (unshaded)
- Chance of flooding over 30 yrs
- 0.0%
- Est. flood insurance / yr
- $507 – $1,088
Fire risk 4/10 · Minor
- Est. fire insurance / yr
- $947 – $1,759
Heat risk 8/10 · Major
- Hot days now (above 108°F)
- 7 days/yr
- Hot days in 30 yrs
- 21 days/yr
Wind risk 9/10 · Severe
- Chance of severe wind over 30 yrs
- 99.0%
Air-quality risk 3/10 · Minor
- Unhealthy air days now
- 3 days/yr
- Unhealthy air days in 30 yrs
- 4 days/yr
Risk factors via First Street. Map © Google.
Why this score? — see what drove the D grade
The composite is a weighted blend of 9 inputs, each scored 0–100. Each bar is that input's sub-score; the figure is the points it added to the 100-point composite (weight × sub-score).
- Cash flow +8.0/30.0
- Appreciation +8.0/10.0
- ARV discount +7.5/15.0
- 1% rule +5.9/10.0
- Schools +3.6/10.0
- Livability +3.4/5.0
- Rent growth +2.5/5.0
- Condition / age +2.5/5.0
- DSCR +2.1/10.0
$129,900
🖨 Deal sheet (PDF) 📄 Offer letter ✓ Due diligence
Listing remarks MLS
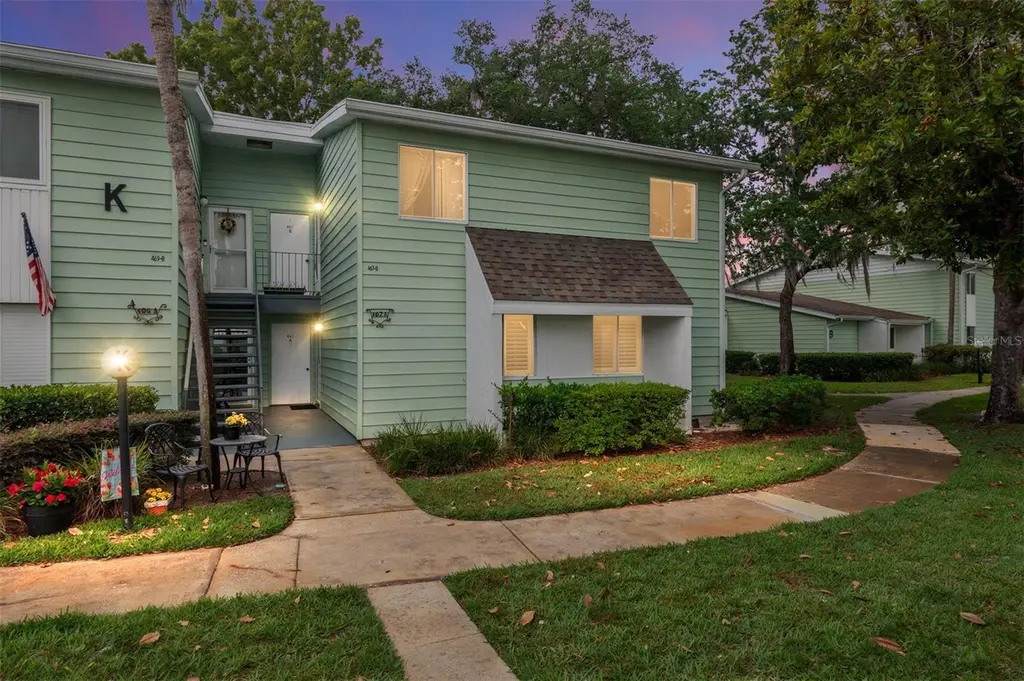
Move-in ready, immaculate Fairways groundfloor condo with a rare extra large deeded back patio overlooking a beautiful pond and golfcourse! Freshly painted, very nice carpet and tile, newer windows on the tiled lanai, and the furniture is negotiable! Sellers are realistic and motivated! Dues include lawn maint. , trash, cable, pest cntrl, & condo insurance. Sellers are even including a Home Warranty!
Key facts
- No rear neighbors
- Community pool
- Peaceful lake views
Tags
Property features AI
Finance
- Other: Association: Bosshardt Property/Carrie Roy
- Financial info: Total annual HOA/fees $4,020; Lease restrictions apply
- HOA & community: Monthly association fee of $335; Association covers cable TV, structure maintenance, grounds maintenance, sewer, and trash; Association approval required; Senior community; Pets allowed with size limit
Exterior
- Parking: Paved access/drive
- Security: Smoke detector(s)
- Utilities: Public water; Public sewer; Cable available
- Home design: Condominium; One-level living; Building faces east
- Construction: Stucco construction; Shingle roof; Built on a slab
- Exterior features: Cleared and paved lot; Other exterior features; Pool (community)
Interior
- Kitchen: Dishwasher; Range; Refrigerator
- Bedrooms: 2 bedrooms
- Flooring: Bamboo; Carpet; Tile
- Bathrooms: 2 full bathrooms
- Heating & cooling: Central heating; Central air
- Interior features: Ceiling fans; Smoke detector(s)
- Laundry & utility: Inside laundry; Washer; Dryer; Slab foundation
Neighborhood map
What this means for you Summary
Snapshot
- This is a 2-bed/2.0-bath condo listed at $130k.
Deal economics
- At list price, monthly cash flow is $-130 ($-2k/yr) — negative.
- To cash-flow at today's rent, offer at most $107k (17.7% below list).
- Meets the 1% rule at list price ($1k rent vs $130k).
- Recommended offer: $107k (17.7% below list) — sets the bar for cash-flow.
Location & tenants
- Location reads 68/100 on livability (#527 in FL) — a middle-class / working-renter tenant base. Strengths: cost of living A+, housing A+, health & safety A-; Watch: crime C-, employment D, amenities F.
- Marion (rural): math 42% / reading 43% proficiency, ranked #61 of 73 in FL (top 84%) — families likely to look elsewhere, expect single-tenant / working-renter base with shorter leases; 61% free/reduced lunch — lower-income household profile, screen leases tightly.
- Zoned schools: Greenway Elementary School (math 33% / reading 35%, grade F, #1,744 of 2,144 statewide, top 82%, 736 students, 67% FRL); Lake Weir Middle School (math 37% / reading 33%, grade F, #416 of 571 statewide, top 74%, 1,207 students, 76% FRL); Lake Weir High School (math 23% / reading 34%, grade F, #458 of 667 statewide, top 69%, 1,483 students, 68% FRL).
- Market conditions: Rents flat; 683 active listings in the ZIP; 33 comparable units currently listed for rent nearby; rentals at typical pace (median 23d on market — plan ~3-4 weeks tenant-placement turnaround); 7,071 units permitted in Marion County in 2024 (534 in 5+ unit buildings).
Forward outlook
- In year one you build about $9k of equity ($898 loan paydown + $8k appreciation (5.9% local appreciation)).
- Marion County population projected at +13% by 2050 — modest demand growth; plan on rents tracking national, not racing it.
- By year 5, paydown + projected appreciation supports a ~$38k cash-out refi (75% LTV) — recoverable capital for the next deal without selling this one.
Negotiation context
- Only 6 days on market — expect competitive offers; lowballing is unlikely to land.
- 3 sale attempts since 21y ago with the ask held roughly flat each time — persistent listings suggest the price (not the market) is what's stuck; bring a comps-based counter.
- Current owner paid $65k; list at $130k implies a 100% gain — meaningful room to come down on a strong offer.
Risks & watch-outs
- Watch-outs: HOA is 24% of rent.
- Climate carrying-cost: severe wind risk, 99% chance of damaging wind over 30y; extreme-heat days projected 7→21/yr by 2055 (HVAC capex compounding) — expect insurance premiums to compound above CPI over the hold.
Questions for the listing agent
- What do current leases actually rent for vs. the listed asking? Can we see a recent rent roll and the last 12 months of T-12 income?
- Built in 1972 — when were the roof, HVAC, electrical panel, plumbing, and water heater last replaced?
- What does the HOA fee cover, when was the last increase, and are there any pending special assessments or reserve-fund shortfalls?
- Any open or pending special assessments — roof, HVAC, plumbing, elevator, façade? What's the per-unit balance and payoff schedule, and is the seller paying it off at close or rolling it to the buyer?
- Is there a deadline driving the sale (1031 exchange, divorce, estate, relocation)? That informs how much negotiation room exists.
- Schools are F-rated, which usually means shorter tenancies and higher turnover. Who's the typical renter profile here, and what's been the actual vacancy rate?
- The area grade is low — what's the realistic commute time and amenity access for the typical tenant pool here? Any planned neighborhood developments (good or bad) we should know about?
- What's the average days-on-market for RENTAL listings here right now (not sales)? A rising rental-DOM trend means longer vacancies and softer asking-rent achievability than the comps imply.
- What's the recent tenant-quality profile in this submarket — average credit score on applications, eviction rate, late-payment / NSF rate, and stable-employment percentage? A property-management company in the area should have these aggregated.
- How much new apartment / multifamily construction is in the pipeline within 1–3 miles? Heavy new supply (>2% of stock underway) typically softens rents 12–24 months out; light construction supports rent growth.
Investment metrics
- 1% rule
- 1.09% ✓
- Cap rate
- 5.09%
- Cash-on-cash
- -4.30%
- DSCR
- 0.81
- GRM
- 7.6
CMA / ARV
No comps found within radius.
Projected returns pro-forma
5.93% appreciation · 0.17% rent growth · sell at horizon
- IRR
- 10.3%
- Equity multiple
- 1.69×
- Total profit
- $25,007
- Equity at exit
- $81,107
- IRR
- 10.4%
- Equity multiple
- 3.02×
- Total profit
- $73,570
- Equity at exit
- $146,609
Cash invested: $36,372 (down + closing). Projections, not guarantees.
Landlord ↔ Tenant lean methodology
- Overall (STATE)
- 87 Strongly Landlord-Friendly
- State Florida
- 87 Strongly Landlord-Friendly · R+3
- County
- — inherits STATE
- City
- — inherits STATE
ZIP-level market 34472
- Home prices YoY
- 2.4%
- Rents YoY
- 0.2%
- Active inventory
- 683
- Price-to-rent
- 7.6×
Monthly cashflow live
- Estimated rent
- $1,417 high interval (Pro) →
- Mortgage (P&I)
- −$681
- Tax from tax record
- −$179 /mo · $2,148/yr
- Insurance
- −$54
- HOA
- −$335
- Vacancy / Maint / Mgmt
- −$298
- Net cashflow
- $-130
Break-even live
Sensitivity live
| Price | -10% $-57 | -5% $-93 | +0% $-130 | +5% $-167 | +10% $-204 |
|---|---|---|---|---|---|
| Rent | -10% $-242 | -5% $-186 | +0% $-130 | +5% $-74 | +10% $-18 |
| Rate | -1.0pp $-65 | -0.5pp $-97 | base $-130 | +0.5pp $-164 | +1.0pp $-198 |
UW: 25.0% down · 7.5% · 30yr · 1.5% tax · 5.0% vac · 8.0% maint · 8.0% mgmt
Financing live
Cash to close
- Down payment
- $32,475
- Closing costs
- $3,897
- Reserves months
- —
- Total cash needed
- —
Loan-product check · same deal, 3 products live
Conventional
25% down · 7.5% · 30yr
- Down + closing
- —
- Monthly P&I
- —
- Monthly cashflow
- —
- DSCR
- —
- Eligible?
- —
Personal DTI + credit; lowest rate.
DSCR
20% down · 8.5% · 30yr
- Down + closing
- —
- Monthly P&I
- —
- Monthly cashflow
- —
- DSCR
- —
- Eligible?
- —
No personal income docs; deal must DSCR.
Hard money
10% down · 12.0% · 12mo
- Down + closing
- —
- Monthly P&I
- —
- Monthly cashflow
- —
- DSCR
- —
- Eligible?
- —
Short-term bridge; refi at stabilization.
Rent comps 33 comps
| Address | Beds | Baths | Sqft | Rent | $/sqft | DOM | Units | Dist |
|---|---|---|---|---|---|---|---|---|
| 608 Midway Dr Unit A Ocala, FL | 2.0 | 1.5 | 1054 | $1,500 | $1.42 | 15d | 1 | 0.18mi |
| 454 Fairways Cir Ocala, FL | 2.0 | 2.0 | 837 | $1,200 | $1.43 | 23d | 1 | 0.26mi |
| 454 Fairways Cir Unit B204 Ocala, FL | 2.0 | 2.0 | 837 | $1,289 | $1.54 | 23d | 1 | 0.26mi |
| 454 Fairways Cir Unit B203 Ocala, FL | 2.0 | 2.0 | 850 | $1,375 | $1.62 | 23d | 1 | 0.26mi |
| 567 Midway Trak Unit H201 Ocala, FL | 3.0 | 2.0 | 1029 | $1,350 | $1.31 | 15d | 1 | 0.29mi |
| 510 Fairways Cir Unit A Ocala, FL | 2.0 | 2.0 | 1000 | $1,299 | $1.30 | 23d | 1 | 0.31mi |
| 548 Fairways Cir Unit C102 Ocala, FL | 2.0 | 2.0 | 850 | $1,400 | $1.65 | 23d | 1 | 0.31mi |
| 520 Fairways Cir Unit A Ocala, FL | 2.0 | 1.5 | 1027 | $1,100 | $1.07 | 23d | 1 | 0.32mi |
| 582 Fairways Cir Unit A Ocala, FL | 2.0 | 2.0 | 1304 | $1,500 | $1.15 | 23d | 1 | 0.32mi |
| 576 Fairways Ln Unit M104 Ocala, FL | 2.0 | 2.0 | 837 | $1,250 | $1.49 | 23d | 1 | 0.34mi |
| 681 Midway Dr Unit A Ocala, FL | 2.0 | 2.0 | 1000 | $1,250 | $1.25 | 15d | 1 | 0.34mi |
| 681 Midway Dr Unit A Ocala, FL | 2.0 | 2.0 | 1000 | $1,250 | $1.25 | 23d | 1 | 0.34mi |
| 553 Fairways Cir Unit B Ocala, FL | 2.0 | 2.0 | 1304 | $1,700 | $1.30 | 15d | 1 | 0.37mi |
| 532 Bahia Cir Unit A Ocala, FL | 2.0 | 1.5 | 1027 | $1,300 | $1.27 | 23d | 1 | 0.39mi |
| 561 Fairways Cir Unit A Ocala, FL | 2.0 | 1.5 | 1031 | $1,250 | $1.21 | 23d | 1 | 0.39mi |
| 549 Fairways Dr Unit A Ocala, FL | 2.0 | 2.0 | 1072 | $1,200 | $1.12 | 23d | 1 | 0.41mi |
| 593 Fairways Cir Unit A Ocala, FL | 2.0 | 1.5 | 1031 | $1,200 | $1.16 | 23d | 1 | 0.47mi |
| 633 Silver Pass Unit B Ocala, FL | 2.0 | 2.0 | 1072 | $1,500 | $1.40 | 23d | 1 | 0.48mi |
| 7817 Midway Drive Ter Unit A103 Ocala, FL | 1.0 | 1.0 | 729 | $1,300 | $1.78 | 23d | 1 | 0.57mi |
| 544 Silver Crse Ocala, FL | 2.0 | 1.0 | 904 | $1,395 | $1.54 | 15d | 1 | 0.63mi |
| 708 Bahia Cir Ocala, FL | 3.0 | 2.0 | 1352 | $1,500 | $1.11 | 23d | 1 | 0.70mi |
| 54 Pine Trak Unit 104F Ocala, FL | 2.0 | 2.0 | 832 | $1,300 | $1.56 | 23d | 1 | 1.02mi |
| 58 Pine Trak Unit 104D Ocala, FL | 2.0 | 2.0 | 832 | $1,050 | $1.26 | 23d | 1 | 1.04mi |
| 62 Pine Trak Ocala, FL | 2.0 | 2.0 | 832 | $1,250 | $1.50 | 23d | 1 | 1.07mi |
| 9337 Bahia Rd Ocala, FL | 3.0 | 2.0 | 1402 | $1,765 | $1.26 | 15d | 1 | 1.13mi |
| 162 Bahia Terrace Dr Ocala, FL | 2.0 | 2.0 | 984 | $1,375 | $1.40 | 23d | 1 | 1.14mi |
| 43 Bahia Pass Ocala, FL | 3.0 | 2.0 | 1188 | $1,475 | $1.24 | 23d | 1 | 1.17mi |
| 478 Water Pl Ocala, FL | 3.0 | 2.0 | 1228 | $1,650 | $1.34 | 23d | 1 | 1.19mi |
| 455 Water Rd Ocala, FL | 3.0 | 2.0 | 1275 | $1,450 | $1.14 | 15d | 1 | 1.30mi |
| 7184 Hemlock Loop Ocala, FL | 3.0 | 2.0 | 1392 | $1,675 | $1.20 | 23d | 1 | 1.31mi |
| 446 Water Rd Ocala, FL | 3.0 | 2.0 | 1248 | $1,425 | $1.14 | 23d | 1 | 1.32mi |
| 308 Hickory Course Radl Ocala, FL | 3.0 | 2.0 | 1397 | $1,650 | $1.18 | 23d | 1 | 1.37mi |
| 12 Spring Loop Ocala, FL | 2.0 | 1.0 | 900 | $1,350 | $1.50 | 15d | 1 | 1.47mi |
HOA detail condo
- Monthly dues
- $335 · $4,020/yr
- Likely covers
- trashcable
- Assessments
- None detected in remarks — confirm with the listing agent.
Listing history 11 events
-
2026-05-11status Pending
-
2026-05-04$129,900 Active
-
2018-03-06soldstatus $65,000
-
2011-07-14soldstatus $43,500
-
2011-07-08soldstatus $43,500 408-char remark
Show marketing remark (408 chars)
Move-in ready, immaculate Fairways groundfloor condo with a rare extra large deeded back patio overlooking a beautiful pond and golfcourse! Freshly painted, very nice carpet and tile, newer windows on the tiled lanai, and the furniture is negotiable! Sellers are realistic and motivated! Dues include lawn maint. , trash, cable, pest cntrl, & condo insurance. Sellers are even including a Home Warranty!
-
2011-03-03$53,000 408-char remark
Show marketing remark (408 chars)
Move-in ready, immaculate Fairways groundfloor condo with a rare extra large deeded back patio overlooking a beautiful pond and golfcourse! Freshly painted, very nice carpet and tile, newer windows on the tiled lanai, and the furniture is negotiable! Sellers are realistic and motivated! Dues include lawn maint. , trash, cable, pest cntrl, & condo insurance. Sellers are even including a Home Warranty!
-
2005-10-26historical
-
2005-09-12soldstatus $96,500
-
2005-07-26$96,500
-
1997-07-09soldstatus $29,000
-
1979-10-01soldstatus $38,500
ⓘ Source: listings_history table (triggers on properties + properties_extension) + one-shot
backfill from property_details.listing_events for pre-trigger history.
Tax reassessment forecast FL · Resets to sale price
- Current annual tax
- $2,148 · $179/mo
- Projected year-2 tax
- $2,148 · $179/mo
- Expected delta
- $0/yr ($0/mo · 0.0%)
ⓘ Screening estimate from a state-policy table — verify with the county assessor before closing.
Climate risk First Street
- Flood 1/10 Low FEMA zone X (unshaded) · 0% chance over 30 yrs
- Wildfire 4/10 Moderate
- Heat 8/10 Severe 7 d/yr ≥108°F today · 21 d/yr by 30 yrs out
- Wind 9/10 Extreme 99% chance of damaging wind over 30 yrs
- Air quality 3/10 Moderate 3 unhealthy d/yr today · 4 by 30 yrs out
Nearby sold comps map
Loading sold comps map…
Walkable amenities ~0.75 mi
Loading nearby amenities…
Taxation est. · year 1
- Rental income
- $17,000
- − Mortgage interest
- −$7,276
- − Property taxes
- −$2,148
- − Insurance
- −$650
- − Repairs & maintenance
- −$1,360
- − Management
- −$1,360
- − HOA
- −$4,020
- − Depreciation
- −$3,779
- Taxable loss
- −$3,593
- Est. tax savings @ 24.0%
- +$862
- After-tax cash flow
- $-700/yr
For passive investors: Depreciation is non-cash, so a rental often shows a tax loss while cash-flowing — sheltering income. Rental losses are passive: they offset passive income freely, and up to $25,000/yr can offset ordinary (W-2) income if you actively participate and your MAGI is under $100k (phasing out to $0 by $150k); unused losses carry forward. On sale, claimed depreciation is recaptured at up to 25%, and gains may owe capital-gains tax (a 1031 exchange can defer both). Figures are a year-1 estimate at your 24.0% rate — not tax advice; consult a CPA.
Schools (NCES district)
- District
- Marion
- NCES district ID
- 1201260
- Math proficiency
- 42% ▼ -7.00%
- Reading proficiency
- 43% ▼ -4.00%
- Median HH income
- $40,015
- Composite
- 35.61/100
- National rank
- #4890
- State rank
- #61 of 73 in FL
Livability — Silver Springs Shores
- Score
- 68/100
- State rank
- #527
- US rank
- #9854
Category grades
Schools grade is shown separately in the Schools card above.
Census & demographics
- Census place
- Silver Springs Shores, FL
- County
- Marion County · 315,796 people
- City population
- 34,665
- Metro
- Ocala, FL
- Population (ZIP)
- 35,851
- Household income
- $64,208
- Rent vs Own
- Severe rent burden
- 655.0
Population outlook (Marion County) Hauer SSP2
- Today (2025)
- 365,905 people
- By 2030
- 376,768 · +3.0%
- By 2040
- 396,555 · +8.4%
- By 2050
- 412,723 · +12.8%
- By 2075
- 446,090 · +21.9%
- By 2100
- 436,193 · +19.2%
Race, ethnicity, and origin ACS 2023
- Neighborhood character
- Diverse neighborhood (Simpson 0.65)
- Race & ethnicity
- White 50% Hispanic / Latino 25% Black 21% Two or more races 18% Asian 2%
- Hispanic origin (detail)
- Mexican 2% Puerto Rican 14% Cuban 3%
- Common ancestry
- Romanian 2% Iranian 1% Lithuanian 1%
- Foreign-born
- 11% · Canada, Jamaica, China
- Languages at home
- 78% English-only · Spanish 19% Other Indo-European 1%
Political lean MEDSL · Marion
- 2024 margin
- Solid R (+31.6) · D 33.8% · R 65.5%
- 2008→2024 swing
- -20.0pp toward R · 2008: -11.6pp · 2024: -31.6pp
- All cycles
- 2024: R+31.6 2020: R+25.9 2016: R+26.2 2012: R+16.2 2008: R+11.6
Not yet ingested
- Civics
- —
Market trends
- HPI YoY
- ▲ 5.93%
- Current HPI
- 255.0714
- Rent YoY
- ▲ 0.17%
- Metro
- Ocala, FL
- State GDP YoY
- ▲ 3.28%
- F500 in state
- 36
Industry mix (Fortune 500 HQ in FL)
| Industry | F500 HQs | Revenue |
|---|---|---|
| Industrial Technology | 2 | $29B |
|
||
| Insurance | 2 | $17B |
|
||
| Retail | 1 | $60B |
|
||
| Technology Distribution | 1 | $58B |
|
||
| Homebuilding | 1 | $35B |
|
||
| Technology Manufacturing | 1 | $35B |
|
||
Price history
+237.4% since first listed11 events — show timeline
- 2026-05-11 Pending — Stellar MLS as Distributed by MLS Grid
- 2026-05-04 Listed $129,900 Stellar MLS as Distributed by MLS Grid
- 2018-03-06 Sold (Public Records) $65,000 Public Records
- 2011-07-14 Sold (Public Records) $43,500 Public Records
- 2011-07-08 Sold (MLS) $43,500 Stellar MLS as Distributed by MLS Grid
- 2011-03-03 Listed $53,000 Stellar MLS as Distributed by MLS Grid
- 2005-10-26 Listing Removed — Stellar MLS as Distributed by MLS Grid
- 2005-09-12 Sold (Public Records) $96,500 Public Records
- 2005-07-26 Listed $96,500 Stellar MLS as Distributed by MLS Grid
- 1997-07-09 Sold (Public Records) $29,000 Public Records
- 1979-10-01 Sold (Public Records) $38,500 Public Records
Property tax history
+8.9%/yrLatest (2025): $2,148 · +14.2% YoY. Source: county tax records.
Cash-flow waterfall
monthlySold comps — $/sqft
last 12 mo · ≤1 miLoading sold comps…