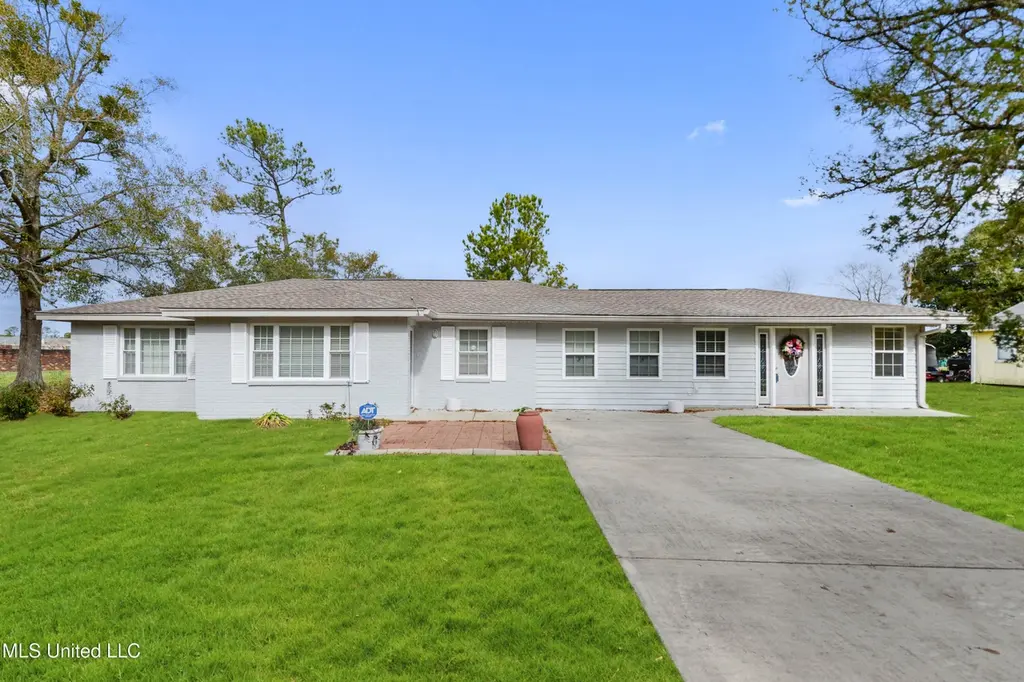
633 Keller St · Bay St. Louis, MS
Flood risk 1/10 · Minimal
- FEMA flood zone
- X (shaded)
- Chance of flooding over 30 yrs
- 0.0%
- Est. flood insurance / yr
- $507 – $1,088
Fire risk 1/10 · Minimal
- Est. fire insurance / yr
- $1,241 – $2,305
Heat risk 10/10 · Severe
- Hot days now (above 107°F)
- 7 days/yr
- Hot days in 30 yrs
- 22 days/yr
Wind risk 10/10 · Severe
- Chance of severe wind over 30 yrs
- 99.0%
Air-quality risk 1/10 · Minimal
- Unhealthy air days now
- 0 days/yr
- Unhealthy air days in 30 yrs
- 0 days/yr
Risk factors via First Street. Map © Google.
Why this score? — see what drove the C grade
The composite is a weighted blend of 9 inputs, each scored 0–100. Each bar is that input's sub-score; the figure is the points it added to the 100-point composite (weight × sub-score).
- Cash flow +19.8/30.0
- ARV discount +15.0/15.0
- DSCR +6.3/10.0
- 1% rule +4.6/10.0
- Schools +3.9/10.0
- Rent growth +2.5/5.0
- Livability +2.5/5.0
- Condition / age +2.5/5.0
- Appreciation +0.0/10.0
$219,500
🖨 Deal sheet 📄 Offer letter ✓ Due diligence
Listing remarks
Nestled under the majestic canopy of live oak trees, this delightful mid-century home offers an inviting blend of space and comfort. The property boasts approximately 1,602 square feet of living space on a rare double lot, providing plenty of room to relax and entertain. Step inside to find a freshly painted interior featuring a spacious living room that invites natural light, a dedicated dining area, and 3 comfortable bedrooms alongside 2 full baths. The home also offers a versatile space that is ideal for use as a home office, studio, or creative workspace. The property includes a storage barn and a partially fenced yard, perfect for gardening, outdoor hobbies, or simply enjoying the sere
Key facts
- Double lot
- Storage barn
- Home office
Tags
Property features AI
Finance
- HOA & community: Near entertainment
Exterior
- Parking: Driveway
- Utilities: Public water; Public sewer; Electricity connected; Cable available; Sewer connected; Water connected
- Home design: Single-family house; One level
- Construction: Brick construction; Asphalt shingle roof; Slab foundation; Built (year per assessor)
- Exterior features: City lot
Interior
- Kitchen: Refrigerator; Water heater
- Flooring: Ceramic tile
- Bathrooms: 2 full bathrooms
- Heating & cooling: Electric heating; Central air conditioning; Ceiling fans
- Interior features: Ceiling fans
- Laundry & utility: Washer hookup; Electric dryer hookup; Laundry room inside the home
Neighborhood map
What this means for you Summary
Snapshot
- This is a 3-bed/2.0-bath single-family listed at $220k.
Deal economics
- At list price, monthly cash flow is $259 ($3k/yr) — positive.
- The deal already cash-flows at list — no discount required.
- To meet the 1% rule (rent ≥ 1% of price), the offer needs to be $210k (4.4% below list).
- Recommended offer: $200k (9.0% below list) — sets the bar for market timing.
- Cap rate 7.7% vs local median 1.9% in Bay St. Louis — top-decile yield for the area; either an underpriced asset or a hidden risk that comps aren't pricing in. Stress-test before assuming the spread holds.
Location & tenants
- Location reads: area grade C — affects rentability + tenant quality, not the cash-flow math above.
- Bay St Louis Waveland School District (suburban): math 51% / reading 43% proficiency, ranked #21 of 130 in MS (top 16%) — families likely to look elsewhere, expect single-tenant / working-renter base with shorter leases; 74% free/reduced lunch — lower-income household profile, screen leases tightly.
- Market conditions: 601 active listings in the ZIP; 3 comparable units currently listed for rent nearby; rentals leasing fast (median 14d on market — plan ~1-2 weeks tenant-placement turnaround); 248 units permitted in Hancock County in 2024 (0 in 5+ unit buildings).
Forward outlook
- Local home prices are declining (-3.0%/yr); year-one equity from $2k of loan paydown is wiped out by about $7k of value loss. Plan a longer hold.
- Hancock County population projected at +20% by 2050 — long-run rental-demand tailwind backs the buy-and-hold thesis.
Negotiation context
- It's been on market 92 days — a 9% lower offer ($200k) is reasonable based on typical stale-listing flexibility.
- 8 sale attempts since 5y ago with the ask held roughly flat each time — persistent listings suggest the price (not the market) is what's stuck; bring a comps-based counter.
Risks & watch-outs
- Climate carrying-cost: severe wind risk, 99% chance of damaging wind over 30y; extreme-heat days projected 7→22/yr by 2055 (HVAC capex compounding) — expect insurance premiums to compound above CPI over the hold.
Questions for the listing agent
- It's been on market 92 days. Have you received any prior offers? Is the seller open to a 9% concession, seller financing, or rate buy-down credit?
- Built in 1970 — when were the roof, HVAC, electrical panel, plumbing, and water heater last replaced?
- Why hasn't it sold? Are there any deal-killer items the seller is aware of (foundation, flood, title, zoning, code violations)?
- Is there a deadline driving the sale (1031 exchange, divorce, estate, relocation)? That informs how much negotiation room exists.
- What's the average days-on-market for RENTAL listings here right now (not sales)? A rising rental-DOM trend means longer vacancies and softer asking-rent achievability than the comps imply.
- What's the recent tenant-quality profile in this submarket — average credit score on applications, eviction rate, late-payment / NSF rate, and stable-employment percentage? A property-management company in the area should have these aggregated.
- How much new for-sale + rental construction is in the pipeline within 1–3 miles? Heavy new supply typically softens prices + rents 12–24 months out; constrained supply supports both.
Investment metrics
- 1% rule
- 0.96% ✗
- Cap rate
- 7.71%
- Cash-on-cash
- 5.07%
- DSCR
- 1.23
- GRM
- 8.7
CMA / ARV
- ARV (on-the-fly)
- $278,124
- Comps found
- 12
Show comp detail 12 sales within ~0.75 mi
| Address | Dist | Beds/Ba | Sqft | Sold | Price | $/sf | Match |
|---|---|---|---|---|---|---|---|
| 438 Ballentine St | 0.37mi | 3/2.0 | 1,060 (-2%) | 11mo | $274,000 | $258 | 71 |
| 520 Bookter St | 0.38mi | 2/1.0 (-1) | 1,066 (-1%) | 3mo | $219,900 | $206 | 69 |
| 253 Sycamore St | 0.67mi | 3/2.0 | 1,048 (-3%) | 4mo | $445,000 | $425 | 60 |
| 866 Washington St | 0.47mi | 3/2.0 | 1,162 (+8%) | 10mo | $292,000 | $251 | 57 |
| 104 Boudin Ln | 0.58mi | 2/2.0 (-1) | 1,149 (+7%) | 1mo | $325,000 | $283 | 56 |
| 534 Saint John St | 0.33mi | 2/2.0 (-1) | 1,210 (+12%) | 6mo | $269,000 | $222 | 54 |
| 542 Demontluzin Ave | 0.47mi | 3/1.0 | 989 (-8%) | 12mo | $275,000 | $278 | 50 |
| 544 Demontluzin Ave | 0.46mi | 2/1.0 (-1) | 1,198 (+11%) | 2mo | $159,900 | $133 | 49 |
| 515 Spanish Acres Dr | 0.62mi | 3/1.5 | 1,178 (+9%) | 8mo | $159,000 | $135 | 47 |
| 298 Union St | 0.72mi | 3/2.0 | 1,176 (+9%) | 7mo | $324,300 | $276 | 45 |
| 401 Third St | 0.74mi | 4/2.0 (+1) | 1,204 (+12%) | 1mo | $229,000 | $190 | 40 |
| 406 Easterbrook St | 0.64mi | 2/2.0 (-1) | 1,209 (+12%) | 8mo | $407,900 | $337 | 38 |
Match score weights: distance 35% · size 25% · config 20% · recency 20%. Top-matched comps best support the ARV.
Projected returns pro-forma
-3.0% appreciation · 3.0% rent growth · sell at horizon
- IRR
- -8.5%
- Equity multiple
- 0.69×
- Total profit
- $-19,087
- Equity at exit
- $32,728
- IRR
- 1.0%
- Equity multiple
- 1.07×
- Total profit
- $4,486
- Equity at exit
- $18,978
Cash invested: $61,460 (down + closing). Projections, not guarantees.
Landlord ↔ Tenant lean methodology
- Overall (STATE)
- 90 Strongly Landlord-Friendly
- State Mississippi
- 90 Strongly Landlord-Friendly · R+11
- County
- — inherits STATE
- City
- — inherits STATE
ZIP-level market 39520
- Active inventory
- 601
- Price-to-rent
- 8.7×
Monthly cashflow live
- Estimated rent
- $2,098 medium interval (Pro) →
- Mortgage (P&I)
- −$1,151
- Tax from tax record
- −$155 /mo · $1,866/yr
- Insurance
- −$91
- HOA
- −$0
- Vacancy / Maint / Mgmt
- −$441
- Net cashflow
- $259
Break-even live
UW: 25.0% down · 7.5% · 30yr · 1.5% tax · 5.0% vac · 8.0% maint · 8.0% mgmt
Financing live
Cash to close
- Down payment
- $54,875
- Closing costs
- $6,585
- Reserves months
- —
- Total cash needed
- —
Loan-product check · same deal, 3 products live
Conventional
25% down · 7.5% · 30yr
- Down + closing
- —
- Monthly P&I
- —
- Monthly cashflow
- —
- DSCR
- —
- Eligible?
- —
Personal DTI + credit; lowest rate.
DSCR
20% down · 8.5% · 30yr
- Down + closing
- —
- Monthly P&I
- —
- Monthly cashflow
- —
- DSCR
- —
- Eligible?
- —
No personal income docs; deal must DSCR.
Hard money
10% down · 12.0% · 12mo
- Down + closing
- —
- Monthly P&I
- —
- Monthly cashflow
- —
- DSCR
- —
- Eligible?
- —
Short-term bridge; refi at stabilization.
Rent comps 3 comps
| Address | Beds | Baths | Sqft | Rent | $/sqft | DOM | Units | Dist |
|---|---|---|---|---|---|---|---|---|
| 216 Carre Ct Bay Saint Louis, MS | 3.0 | 2.5 | 1480 | $2,500 | $1.69 | 13d | 1 | 0.72mi |
| 699 Dunbar Ave Bay Saint Louis, MS | 2.0 | 2.0 | 1000 | $2,200 | $2.20 | 21d | 1 | 0.77mi |
| 117 Demontluzin Ave Bay Saint Louis, MS | 1.0–2.0 | 1.0 | 875 | $1,300 | $1.49 | 11d | 1 | 1.22mi |
Listing history 35 events
-
2026-06-18days on market $219,500 Active 92 DOM
-
2026-06-17days on market $219,500 Active 91 DOM
-
2026-06-16days on market $219,500 Active 90 DOM
-
2026-06-15days on market $219,500 Active 89 DOM
-
2026-06-13days on market $219,500 Active 87 DOM
-
2026-06-12days on market $219,500 Active 86 DOM
-
2026-06-09days on market $219,500 Active 83 DOM
-
2026-06-08days on market $219,500 Active 82 DOM
-
2026-06-07days on market $219,500 Active 80 DOM
-
2026-06-04days on market $219,500 Active 77 DOM
-
2026-06-02days on market $219,500 Active 76 DOM
-
2026-06-01days on market $219,500 Active 75 DOM
-
2026-05-31days on market $219,500 Active 74 DOM
-
2026-04-29price $219,500
-
2026-03-18$225,000 Active
-
2026-01-06historical
-
2026-01-05status Active
-
2025-12-31historical
-
2025-07-30$225,000 Active
-
2025-06-17historical
-
2025-01-17$225,000 Active
-
2024-11-26historical
-
2024-06-22price $289,900
-
2024-05-30$305,000 Active
-
2022-10-09historical
-
2022-08-18price $188,000
-
2022-06-25$192,000 Active
-
2022-03-02soldstatus
-
2022-02-25soldstatus Closed
-
2022-02-16historical
-
2022-02-14$179,000
-
2022-01-25soldstatus Closed
-
2022-01-06status Pending
-
2021-12-22price $150,000
-
2021-09-09$159,000 Active
ⓘ Source: listings_history table (triggers on properties + properties_extension) + one-shot
backfill from property_details.listing_events for pre-trigger history.
Tax reassessment forecast MS · Resets to sale price
- Current annual tax
- $1,866 · $155/mo
- Projected year-2 tax
- $1,866 · $155/mo
- Expected delta
- $0/yr ($0/mo · -0.0%)
ⓘ Screening estimate from a state-policy table — verify with the county assessor before closing.
Climate risk First Street
- Flood 1/10 Low FEMA zone X (shaded) · 0% chance over 30 yrs
- Wildfire 1/10 Low
- Heat 10/10 Extreme 7 d/yr ≥107°F today · 22 d/yr by 30 yrs out
- Wind 10/10 Extreme 99% chance of damaging wind over 30 yrs
- Air quality 1/10 Low 0 unhealthy d/yr today · 0 by 30 yrs out
Nearby sold comps map
Loading sold comps map…
Walkable amenities ~0.75 mi
Loading nearby amenities…
Taxation est. · year 1
- Rental income
- $25,176
- − Mortgage interest
- −$12,295
- − Property taxes
- −$1,866
- − Insurance
- −$1,098
- − Repairs & maintenance
- −$2,014
- − Management
- −$2,014
- − Depreciation
- −$6,385
- Taxable loss
- −$496
- Est. tax savings @ 24.0%
- +$119
- After-tax cash flow
- $3,232/yr
For passive investors: Depreciation is non-cash, so a rental often shows a tax loss while cash-flowing — sheltering income. Rental losses are passive: they offset passive income freely, and up to $25,000/yr can offset ordinary (W-2) income if you actively participate and your MAGI is under $100k (phasing out to $0 by $150k); unused losses carry forward. On sale, claimed depreciation is recaptured at up to 25%, and gains may owe capital-gains tax (a 1031 exchange can defer both). Figures are a year-1 estimate at your 24.0% rate — not tax advice; consult a CPA.
Schools (NCES district)
- District
- Bay St Louis Waveland School District
- NCES district ID
- 2800570
- Math proficiency
- 51% ▲ 4.00%
- Reading proficiency
- 43% ▼ -3.00%
- Median HH income
- $38,774
- Composite
- 39.27/100
- National rank
- #3998
- State rank
- #21 of 130 in MS
Livability — Bay St. Louis
No livability data for this city. (Only ~50 U.S. cities are tracked.)
Census & demographics
- Census place
- Bay St. Louis, MS
- Population (ZIP)
- 15,471
Population outlook (Hancock County) Hauer SSP2
- Today (2025)
- 52,161 people
- By 2030
- 54,753 · +5.0%
- By 2040
- 59,242 · +13.6%
- By 2050
- 62,417 · +19.7%
- By 2075
- 68,168 · +30.7%
- By 2100
- 69,212 · +32.7%
Race, ethnicity, and origin ACS 2023
- Neighborhood character
- Predominantly White (80%)
- Race & ethnicity
- White 80% Black 11% Two or more races 6% Hispanic / Latino 3% Asian 1%
- Common ancestry
- Lithuanian 15% Romanian 2% Serbian 2%
- Foreign-born
- 3% · Canada, China
- Languages at home
- 96% English-only · Spanish 2% Chinese 1%
Political lean MEDSL · Hancock
- 2024 margin
- Solid R (+58.7) · D 20.1% · R 78.8% · Other 1.1%
- 2008→2024 swing
- -4.4pp toward R · 2008: -54.2pp · 2024: -58.7pp
- All cycles
- 2024: R+58.7 2020: R+55.5 2016: R+59.4 2012: R+52.8 2008: R+54.2
Not yet ingested
- Civics
- —
Market trends
- HPI YoY
- ▼ -169.80%
- Current HPI
- 227.2103
- Rent YoY
- —
- Metro
- —
- State GDP YoY
- —
- F500 in state
- 0
Price history
+38.1% since first listed22 events — show timeline
- 2026-04-29 Price Changed $219,500 MLSU
- 2026-03-18 Listed $225,000 MLSU
- 2026-01-06 Listing Removed — MLSU
- 2026-01-05 Relisted — MLSU
- 2025-12-31 Listing Removed — MLSU
- 2025-07-30 Listed $225,000 MLSU
- 2025-06-17 Listing Removed — MLSU
- 2025-01-17 Listed $225,000 MLSU
- 2024-11-26 Listing Removed — MLSU
- 2024-06-22 Price Changed $289,900 MLSU
- 2024-05-30 Listed $305,000 MLSU
- 2022-10-09 Listing Removed — MLSU
- 2022-08-18 Price Changed $188,000 MLSU
- 2022-06-25 Listed $192,000 MLSU
- 2022-03-02 Sold (Public Records) — Public Records
- 2022-02-25 Sold (MLS) — MLSU
- 2022-02-16 Listing Removed — MLSU
- 2022-02-14 Listed $179,000 MLSU
- 2022-01-25 Sold (MLS) — MLSU
- 2022-01-06 Pending — MLSU
- 2021-12-22 Price Changed $150,000 MLSU
- 2021-09-09 Listed $159,000 MLSU
Property tax history
+28.9%/yrLatest (2025): $1,866 · +0.0% YoY. Source: county tax records.
Cash-flow waterfall
monthlySold comps — $/sqft
last 12 mo · ≤1 miLoading sold comps…