282 Rodney St #3 · New York, NY
Flood risk 1/10 · Minimal
- FEMA flood zone
- X (unshaded)
- Chance of flooding over 30 yrs
- 0.0%
- Est. flood insurance / yr
- $507 – $1,088
Fire risk 1/10 · Minimal
- Est. fire insurance / yr
- $691 – $1,283
Heat risk 7/10 · Major
- Hot days now (above 99°F)
- 7 days/yr
- Hot days in 30 yrs
- 15 days/yr
Wind risk 6/10 · Moderate
- Chance of severe wind over 30 yrs
- 27.0%
Air-quality risk 4/10 · Minor
- Unhealthy air days now
- 5 days/yr
- Unhealthy air days in 30 yrs
- 7 days/yr
Risk factors via First Street. Map © Google.
Why this score? — see what drove the D grade
The composite is a weighted blend of 9 inputs, each scored 0–100. Each bar is that input's sub-score; the figure is the points it added to the 100-point composite (weight × sub-score).
- Appreciation +10.0/10.0
- ARV discount +7.5/15.0
- Cash flow +5.9/30.0
- Schools +5.0/10.0
- Rent growth +4.0/5.0
- Livability +3.8/5.0
- Condition / age +2.5/5.0
- 1% rule +1.3/10.0
- DSCR +0.3/10.0
$1,025,000
🖨 Deal sheet (PDF) 📄 Offer letter ✓ Due diligence
Listing remarks
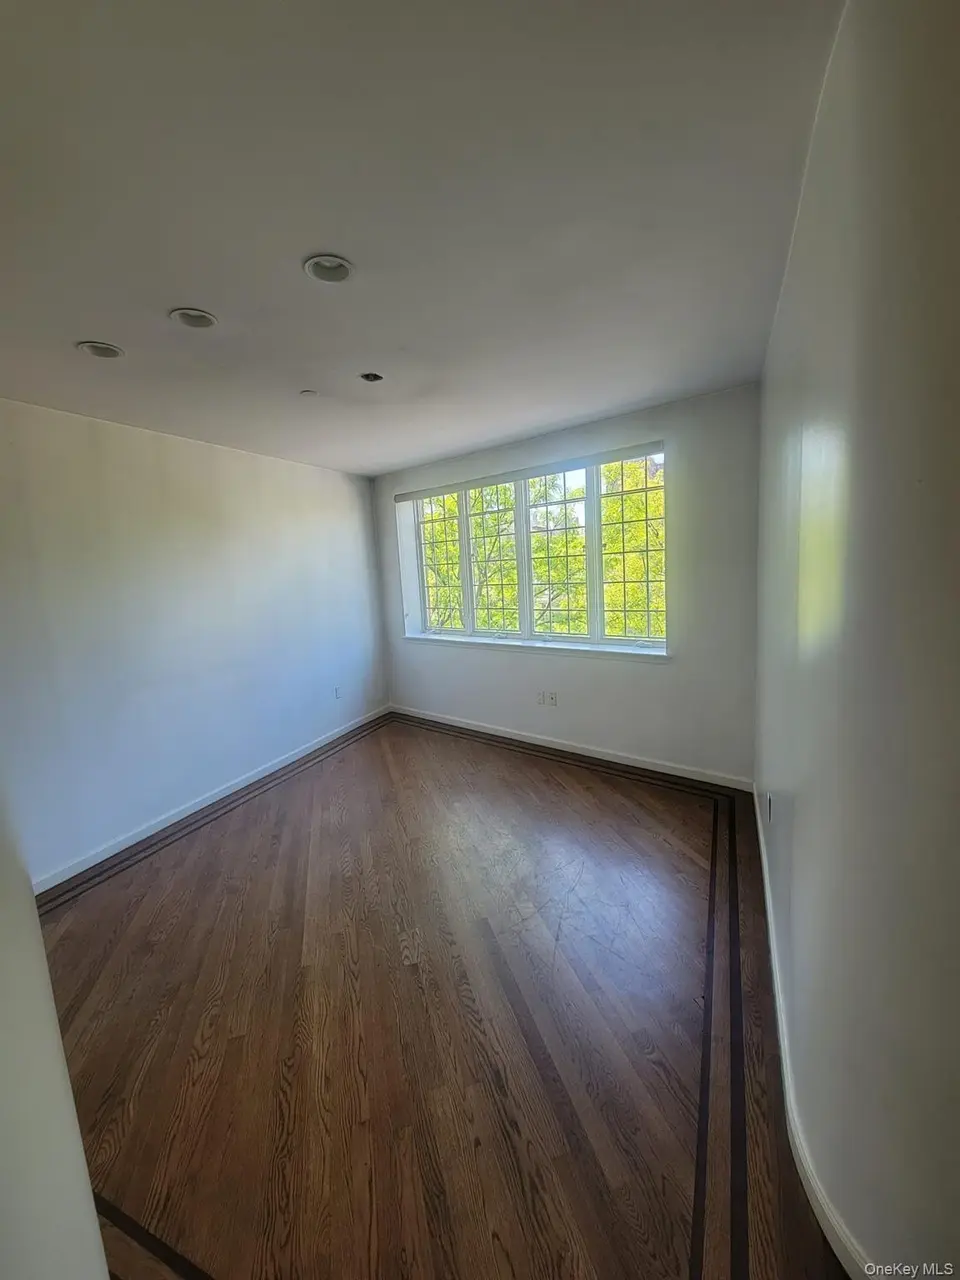
Spacious and well-maintained 3-bedroom apartment in a private walk-up building, located in the heart of Williamsburg. This bright unit offers over 1,200 sqft of living space with a functional layout, generous room sizes, and great natural light throughout. The apartment is in very nice condition and is move-in ready. Features include: • 3 large bedrooms • separate living/dining layout • Private porch • laundry room • Additional large storage space • Well-kept walk-up building (no elevator) Ideal for end users looking for space and comfort in a prime Williamsburgh location.
Key facts
- Private porch
- Laundry room
- Large storage space
Tags
Property features AI
Exterior
- Parking: On-street parking; No carport
- Utilities: Public sewer; Electricity connected; Natural gas connected; Water connected
- Home design: Condominium
- Construction: Brick construction
- Exterior features: Brick exterior; Not waterfront
Interior
- Kitchen: No appliances included
- Bedrooms: Entry level 3
- Bathrooms: 1 full bathroom; 1 half bathroom
- Heating & cooling: Natural gas heating; Other heating; Central air conditioning
- Interior features: Other interior features; Basement with storage space; Attic storage
- Laundry & utility: No laundry appliances listed
Neighborhood map
What this means for you Summary
Snapshot
- This is a 3-bed/1.5-bath condo listed at $1.02M.
Deal economics
- At list price, monthly cash flow is $-2k ($-24k/yr) — negative.
- To cash-flow at today's rent, offer at most $735k (28.3% below list).
- To meet the 1% rule (rent ≥ 1% of price), the offer needs to be $643k (37.3% below list).
- Recommended offer: $643k (37.3% below list) — sets the bar for 1% rule.
- Cap rate 3.9% vs local median 2.6% in New York — top-decile yield for the area; either an underpriced asset or a hidden risk that comps aren't pricing in. Stress-test before assuming the spread holds.
Location & tenants
- Location reads 75/100 on livability (#268 in NY, #4,188 nationally) — a middle-class / working-renter tenant base. Strengths: amenities A+, commute A+, health & safety A; Watch: crime F, cost of living F.
- Zoned schools: Elm Tree Elementary School (math 27% / reading 52%, grade F, #1,444 of 2,108 statewide, top 71%, 806 students, 94% FRL); Is 318 Eugenio Maria De Hostos (math 54% / reading 74%, grade A-, #121 of 729 statewide, top 17%, 1,069 students, 64% FRL); Midwood High School (math 94% / reading 96%, grade A+, #83 of 1,100 statewide, top 8%, 4,062 students, 73% FRL).
- Market conditions: Rents rising fast (+6.1%/yr); 135 active listings in the ZIP; 9 comparable units currently listed for rent nearby; rentals at typical pace (median 27d on market — plan ~3-4 weeks tenant-placement turnaround); solid renter incomes; 10,063 units permitted in Kings County in 2024 (9,789 in 5+ unit buildings).
- At $6,432/mo this rent would consume 72% of the median local household income ($108k/yr) (locally 5879% of renters already pay >50% of income on rent) — very limited rent-growth headroom before tenants either downsize or default.
Forward outlook
- In year one you build about $110k of equity ($7k loan paydown + $102k appreciation (10.0% local appreciation)).
- Kings County population projected at +13% by 2050 — modest demand growth; plan on rents tracking national, not racing it.
- By year 2, paydown + projected appreciation supports a ~$176k cash-out refi (75% LTV) — recoverable capital for the next deal without selling this one.
Negotiation context
- It's been on market 26 days — a 2% lower offer ($1.01M) is reasonable based on typical stale-listing flexibility.
Risks & watch-outs
- Climate carrying-cost: major wind risk, 27% chance of damaging wind over 30y; extreme-heat days projected 7→15/yr by 2055 (HVAC capex compounding) — expect insurance premiums to compound above CPI over the hold.
Questions for the listing agent
- What do current leases actually rent for vs. the listed asking? Can we see a recent rent roll and the last 12 months of T-12 income?
- Any open or pending special assessments — roof, HVAC, plumbing, elevator, façade? What's the per-unit balance and payoff schedule, and is the seller paying it off at close or rolling it to the buyer?
- Is there a deadline driving the sale (1031 exchange, divorce, estate, relocation)? That informs how much negotiation room exists.
- Schools are B-rated — typically a magnet for longer-tenancy family renters. What's the average tenant stay here, and is there a school-zone premium baked into asking?
- Crime grade is F in this area — have there been break-ins, vandalism, or insurance claims at this property in the last 3 years? What carrier currently insures it and at what premium?
- The area grade is low — what's the realistic commute time and amenity access for the typical tenant pool here? Any planned neighborhood developments (good or bad) we should know about?
- What's the average days-on-market for RENTAL listings here right now (not sales)? A rising rental-DOM trend means longer vacancies and softer asking-rent achievability than the comps imply.
- What's the recent tenant-quality profile in this submarket — average credit score on applications, eviction rate, late-payment / NSF rate, and stable-employment percentage? A property-management company in the area should have these aggregated.
- How much new apartment / multifamily construction is in the pipeline within 1–3 miles? Heavy new supply (>2% of stock underway) typically softens rents 12–24 months out; light construction supports rent growth.
Investment metrics
- 1% rule
- 0.63% ✗
- Cap rate
- 3.95%
- Cash-on-cash
- -8.37%
- DSCR
- 0.63
- GRM
- 13.3
CMA / ARV
No comps found within radius.
Projected returns pro-forma
10.0% appreciation · 6.06% rent growth · sell at horizon
- IRR
- 19.2%
- Equity multiple
- 2.57×
- Total profit
- $451,199
- Equity at exit
- $923,401
- IRR
- 18.3%
- Equity multiple
- 6.14×
- Total profit
- $1,476,055
- Equity at exit
- $1,991,350
Cash invested: $287,000 (down + closing). Projections, not guarantees.
Landlord ↔ Tenant lean methodology
- Overall (CITY)
- 0 Strongly Tenant-Friendly
- State New York
- 15 Strongly Tenant-Friendly · D+10
- County
- — inherits STATE
- City New York
- 0 Strongly Tenant-Friendly · D+34
ZIP-level market 11211
- Home prices YoY
- 2.6%
- Rents YoY
- 6.1%
- Active inventory
- 135
- Price-to-rent
- 13.3×
Monthly cashflow live
- Estimated rent
- $6,432 high interval (Pro) →
- Mortgage (P&I)
- −$5,375
- Tax est. 1.5%
- −$1,281 /mo · $15,375/yr
- Insurance
- −$427
- HOA
- −$0
- Vacancy / Maint / Mgmt
- −$1,351
- Net cashflow
- $-2,003
Break-even live
Sensitivity live
| Price | -10% $-1,294 | -5% $-1,648 | +0% $-2,003 | +5% $-2,357 | +10% $-2,711 |
|---|---|---|---|---|---|
| Rent | -10% $-2,511 | -5% $-2,257 | +0% $-2,003 | +5% $-1,749 | +10% $-1,495 |
| Rate | -1.0pp $-1,486 | -0.5pp $-1,742 | base $-2,003 | +0.5pp $-2,268 | +1.0pp $-2,538 |
UW: 25.0% down · 7.5% · 30yr · 1.5% tax · 5.0% vac · 8.0% maint · 8.0% mgmt
Financing live
Cash to close
- Down payment
- $256,250
- Closing costs
- $30,750
- Reserves months
- —
- Total cash needed
- —
Loan-product check · same deal, 3 products live
Conventional
25% down · 7.5% · 30yr
- Down + closing
- —
- Monthly P&I
- —
- Monthly cashflow
- —
- DSCR
- —
- Eligible?
- —
Personal DTI + credit; lowest rate.
DSCR
20% down · 8.5% · 30yr
- Down + closing
- —
- Monthly P&I
- —
- Monthly cashflow
- —
- DSCR
- —
- Eligible?
- —
No personal income docs; deal must DSCR.
Hard money
10% down · 12.0% · 12mo
- Down + closing
- —
- Monthly P&I
- —
- Monthly cashflow
- —
- DSCR
- —
- Eligible?
- —
Short-term bridge; refi at stabilization.
Rent comps 9 comps
| Address | Beds | Baths | Sqft | Rent | $/sqft | DOM | Units | Dist |
|---|---|---|---|---|---|---|---|---|
| 250 Union Ave #2119 Brooklyn, NY | 1.0–2.0 | 1.0 | 590 | $4,900 | $8.31 | 26d | 2 | 0.35mi |
| 482 Kent Ave Brooklyn, NY | 2.0 | 1.0–2.0 | 750 | $8,290 | $11.05 | 1d | 3 | 0.63mi |
| 478 Kent Ave Brooklyn, NY | 2.0 | 1.0–2.0 | 775 | $7,530 | $9.72 | 4d | 3 | 0.63mi |
| 68 Gold St New York, NY | 1.0–2.0 | 1.0 | 700 | $7,050 | $10.07 | 26d | 2 | 1.37mi |
| 375 Vernon Ave Brooklyn, NY | 4.0 | 2.0 | 645 | $1,210 | $1.88 | 22d | 1 | 1.37mi |
| 1088 Bedford Ave Brooklyn, NY | 4.0 | 1.0 | 1200 | $1,190 | $0.99 | 26d | 1 | 1.41mi |
| 72 Van Buren St Brooklyn, NY | 3.0 | 1.0 | 1000 | $1,180 | $1.18 | 26d | 1 | 1.45mi |
| 72 Van Buren St Brooklyn, NY | 4.0 | 1.0 | 544 | $1,170 | $2.15 | 7d | 1 | 1.45mi |
| 285 Kingsland Ave #2078 Brooklyn, NY | 1.0–2.0 | 1.0–2.0 | 725 | $6,380 | $8.80 | 26d | 2 | 1.49mi |
HOA detail condo
- Monthly dues
- $0 · $0/yr
- Assessments
- None detected in remarks — confirm with the listing agent.
Listing history 2 events
-
2026-05-31days on market $1,025,000 Active 26 DOM
-
2026-05-05$1,025,000 Active
ⓘ Source: listings_history table (triggers on properties + properties_extension) + one-shot
backfill from property_details.listing_events for pre-trigger history.
Climate risk First Street
- Flood 1/10 Low FEMA zone X (unshaded) · 0% chance over 30 yrs
- Wildfire 1/10 Low
- Heat 7/10 Severe 7 d/yr ≥99°F today · 15 d/yr by 30 yrs out
- Wind 6/10 Major 27% chance of damaging wind over 30 yrs
- Air quality 4/10 Moderate 5 unhealthy d/yr today · 7 by 30 yrs out
Nearby sold comps map
Loading sold comps map…
Walkable amenities ~0.75 mi
Loading nearby amenities…
Taxation est. · year 1
- Rental income
- $77,179
- − Mortgage interest
- −$57,416
- − Property taxes
- −$15,375
- − Insurance
- −$5,125
- − Repairs & maintenance
- −$6,174
- − Management
- −$6,174
- − Depreciation
- −$29,818
- Taxable loss
- −$42,904
- Est. tax savings @ 24.0%
- +$10,297
- After-tax cash flow
- $-13,734/yr
For passive investors: Depreciation is non-cash, so a rental often shows a tax loss while cash-flowing — sheltering income. Rental losses are passive: they offset passive income freely, and up to $25,000/yr can offset ordinary (W-2) income if you actively participate and your MAGI is under $100k (phasing out to $0 by $150k); unused losses carry forward. On sale, claimed depreciation is recaptured at up to 25%, and gains may owe capital-gains tax (a 1031 exchange can defer both). Figures are a year-1 estimate at your 24.0% rate — not tax advice; consult a CPA.
Schools (NCES district)
No district data.
Livability — New York
- Score
- 75/100
- State rank
- #268
- US rank
- #4188
Category grades
Schools grade is shown separately in the Schools card above.
Census & demographics
- Census place
- New York, NY
- County
- Kings County · 2,614,986 people
- City population
- 7,731,280
- Metro
- New York-Newark-Jersey City, NY-NJ-PA
- Population (ZIP)
- 65,314
- Household income
- $107,506
- Rent vs Own
- Severe rent burden
- 5879.0
Population outlook (Kings County) Hauer SSP2
- Today (2025)
- 2,847,441 people
- By 2030
- 2,937,006 · +3.1%
- By 2040
- 3,095,491 · +8.7%
- By 2050
- 3,228,968 · +13.4%
- By 2075
- 3,321,723 · +16.7%
- By 2100
- 3,111,387 · +9.3%
Race, ethnicity, and origin ACS 2023
- Neighborhood character
- Diverse neighborhood (Simpson 0.58)
- Race & ethnicity
- White 59% Hispanic / Latino 26% Two or more races 9% Asian 7% Black 4%
- Hispanic origin (detail)
- Mexican 3% Puerto Rican 10% Dominican 6%
- Common ancestry
- Italian 4% Romanian 3% Lithuanian 2%
- Foreign-born
- 23% · Canada, China, Jamaica
- Languages at home
- 50% English-only · Spanish 21% German/W. Germanic 17% Other Indo-European 3%
Political lean MEDSL · Kings
- 2024 margin
- Solid D (+44.0) · D 72.0% · R 28.0%
- 2008→2024 swing
- -15.5pp toward R · 2008: 59.4pp · 2024: 44.0pp
- All cycles
- 2024: D+44.0 2020: D+54.8 2016: D+61.8 2012: D+63.9 2008: D+59.4
Not yet ingested
- Civics
- —
Market trends
- HPI YoY
- ▲ 14.72%
- Current HPI
- 588.2538
- Rent YoY
- ▲ 6.06%
- Metro
- New York-Newark-Jersey City, NY-NJ-PA
- State GDP YoY
- ▲ 2.60%
- F500 in state
- 92
Industry mix (Fortune 500 HQ in NY)
| Industry | F500 HQs | Revenue |
|---|---|---|
| Financial Services | 10 | $950B |
|
||
| Consumer Goods | 9 | $162B |
|
||
| Insurance | 4 | $225B |
|
||
| Telecommunications | 2 | $144B |
|
||
| Pharmaceuticals | 2 | $112B |
|
||
| Media / Entertainment | 2 | $69B |
|
||
Price history
1 event — show timeline
- 2026-05-05 Listed $1,025,000 OneKey® MLS as Distributed by MLS Grid
Property tax history
-16.5%/yrLatest (2024): $457 · +1.9% YoY. Source: county tax records.
Cash-flow waterfall
monthlySold comps — $/sqft
last 12 mo · ≤1 miLoading sold comps…