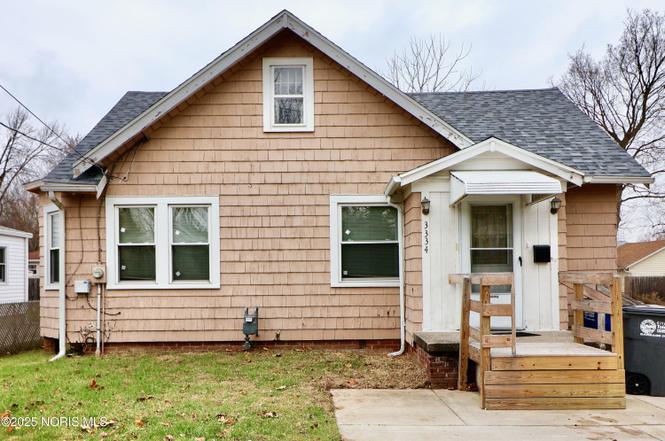
3334 Thelma Dr · Toledo, OH
Flood risk 1/10 · Minimal
- FEMA flood zone
- X (unshaded)
- Chance of flooding over 30 yrs
- 0.0%
- Est. flood insurance / yr
- $473 – $860
Fire risk 1/10 · Minimal
- Est. fire insurance / yr
- $713 – $1,323
Heat risk 3/10 · Minor
- Hot days now (above 101°F)
- 7 days/yr
- Hot days in 30 yrs
- 16 days/yr
Wind risk 2/10 · Minimal
- Chance of severe wind over 30 yrs
- —
Air-quality risk 2/10 · Minimal
- Unhealthy air days now
- 1 days/yr
- Unhealthy air days in 30 yrs
- 3 days/yr
Risk factors via First Street. Map © Google.
Why this score? — see what drove the B- grade
The composite is a weighted blend of 9 inputs, each scored 0–100. Each bar is that input's sub-score; the figure is the points it added to the 100-point composite (weight × sub-score).
- Cash flow +25.8/30.0
- ARV discount +15.0/15.0
- DSCR +8.6/10.0
- 1% rule +6.5/10.0
- Schools +3.5/10.0
- Rent growth +3.3/5.0
- Livability +3.3/5.0
- Condition / age +2.5/5.0
- Appreciation +0.0/10.0
$129,900
🖨 Deal sheet 📄 Offer letter ✓ Due diligence
Listing remarks
Turn this adorable bungalow into Home Sweet Home with your decorating skills! Updates galore include new roof, HVAC, concrete driveway, wiring, plumbing, remodeled bath with step-in shower, more. You'll find hardwood floors under the carpeting. The huge upstairs bedroom with walk-in closet could be turned into 2 bedrooms. Bonus: sold with . 22 acres of vacant land next door. Great value, act fast!!
Key facts
- Hvac
- Remodeled bath
- Step-in shower
Tags
Property features AI
Exterior
- Parking: Driveway with space for 2 vehicles
- Utilities: Cable connected; Electricity connected; Natural gas connected; Public water; Sanitary sewer
- Home design: Single family residence; Residential property; One and one-half levels; No attached units; No common walls; Located at 3334 Thelma Dr, Toledo, OH 43613; Subdivision: Brock Place
- Construction: Wood siding; Other foundation
- Exterior features: Covered patio; Shingle roof
Interior
- Kitchen: Kitchen on main level
- Bedrooms: Primary bedroom on main level; Second bedroom on upper level
- Flooring: Carpet; Wood
- Bathrooms: 1 full bathroom
- Heating & cooling: Forced air heating; Central air conditioning; Circuit breaker electrical
- Interior features: Walk-in closet(s); Basement
- Laundry & utility: Laundry in basement
Neighborhood map
What this means for you Summary
Snapshot
- This is a 2-bed/1.0-bath single-family listed at $130k.
Deal economics
- At list price, monthly cash flow is $314 ($4k/yr) — positive.
- The deal already cash-flows at list — no discount required.
- Meets the 1% rule at list price ($1k rent vs $130k).
- Recommended offer: $114k (12.0% below list) — sets the bar for market timing.
- Cap rate 9.2% vs local median 7.6% in Toledo — meaningfully above typical; check what's discounted (condition, days-on-market, listing class) to confirm the premium yield is real.
Location & tenants
- Location reads 66/100 on livability (#645 in OH) — a middle-class / working-renter tenant base. Strengths: cost of living A+, housing A+, health & safety A+; Watch: amenities C-, crime F, commute F.
- Washington Local (urban): math 37% / reading 47% proficiency, ranked #528 of 656 in OH (top 80%) — families likely to look elsewhere, expect single-tenant / working-renter base with shorter leases.
- Zoned schools: Hiawatha Elementary School (math 37% / reading 52%, grade F, #991 of 1,584 statewide, top 64%, 345 students, 49% FRL); Whitmer High School (math 38% / reading 48%, grade F, #494 of 781 statewide, top 63%, 2,247 students, 42% FRL) — zoned schools at 46% FRL track the district average.
- Market conditions: Rents rising (+3.3%/yr); 111 active listings in the ZIP; 6 comparable units currently listed for rent nearby; rentals at typical pace (median 21d on market — plan ~3-4 weeks tenant-placement turnaround); 415 units permitted in Lucas County in 2024 (122 in 5+ unit buildings).
Forward outlook
- Local home prices are declining (-3.0%/yr); year-one equity from $898 of loan paydown is wiped out by about $4k of value loss. Plan a longer hold.
- Lucas County population projected at -16% by 2050 — secular population decline; favor cash flow + early exit over multi-decade hold.
- At projected returns (-3.0% appreciation + 3.3% rent growth), your $36k cash investment doubles in ~10 years — after that, you're playing with house money.
Negotiation context
- It's been on market 154 days — a 12% lower offer ($114k) is reasonable based on typical stale-listing flexibility.
- 9 sale attempts since 23y ago; this cycle's ask has dropped $20k (13%) from the opening price — seller is motivated, your offer sets the floor, not the list.
- Current owner paid $63k; list at $130k implies a 106% gain — meaningful room to come down on a strong offer.
Risks & watch-outs
- Watch-outs: built in 1927 — expect roof / HVAC / electrical / plumbing capex.
Questions for the listing agent
- It's been on market 154 days. Have you received any prior offers? Is the seller open to a 12% concession, seller financing, or rate buy-down credit?
- Built in 1927 — when were the roof, HVAC, electrical panel, plumbing, and water heater last replaced?
- Why hasn't it sold? Are there any deal-killer items the seller is aware of (foundation, flood, title, zoning, code violations)?
- Is there a deadline driving the sale (1031 exchange, divorce, estate, relocation)? That informs how much negotiation room exists.
- Schools are D-rated, which usually means shorter tenancies and higher turnover. Who's the typical renter profile here, and what's been the actual vacancy rate?
- Crime grade is F in this area — have there been break-ins, vandalism, or insurance claims at this property in the last 3 years? What carrier currently insures it and at what premium?
- What's the average days-on-market for RENTAL listings here right now (not sales)? A rising rental-DOM trend means longer vacancies and softer asking-rent achievability than the comps imply.
- What's the recent tenant-quality profile in this submarket — average credit score on applications, eviction rate, late-payment / NSF rate, and stable-employment percentage? A property-management company in the area should have these aggregated.
- How much new for-sale + rental construction is in the pipeline within 1–3 miles? Heavy new supply typically softens prices + rents 12–24 months out; constrained supply supports both.
Investment metrics
- 1% rule
- 1.15% ✓
- Cap rate
- 9.19%
- Cash-on-cash
- 10.35%
- DSCR
- 1.46
- GRM
- 7.2
CMA / ARV
- ARV (on-the-fly)
- $230,736
- Comps found
- 12
Show comp detail 12 sales within ~0.75 mi
| Address | Dist | Beds/Ba | Sqft | Sold | Price | $/sf | Match |
|---|---|---|---|---|---|---|---|
| 5907 Gany Mede Dr | 0.29mi | 3/2.0 (+1) | 1,632 (-2%) | 12mo | $206,500 | $127 | 64 |
| 6280 Secor Rd | 0.14mi | 3/2.0 (+1) | 1,540 (-8%) | 11mo | $268,000 | $174 | 62 |
| 6111 Meteor Ave | 0.61mi | 2/1.5 | 1,688 (+1%) | 8mo | $169,000 | $100 | 61 |
| 3640 Brock Dr | 0.41mi | 3/2.0 (+1) | 1,740 (+4%) | 10mo | $240,000 | $138 | 56 |
| 5909 Merle St | 0.74mi | 2/1.5 | 1,742 (+4%) | 0mo | $60,000 | $34 | 56 |
| 5949 Murnen Rd | 0.24mi | 3/1.5 (+1) | 1,914 (+14%) | 2mo | $190,000 | $99 | 56 |
| 6399 Whiteford Center Rd | 0.55mi | 2/1.0 | 1,520 (-9%) | 6mo | $175,000 | $115 | 54 |
| 2823 Provincetowne Dr | 0.66mi | 3/1.5 (+1) | 1,534 (-8%) | 7mo | $252,000 | $164 | 42 |
| 6031 Meteor Ave | 0.61mi | 3/2.0 (+1) | 1,530 (-8%) | 10mo | $245,000 | $160 | 40 |
| 6704 Summerlyn Lakes Dr | 0.62mi | 2/2.0 | 1,438 (-14%) | 7mo | $340,000 | $236 | 38 |
| 3658 Judy Dr | 0.60mi | 3/1.0 (+1) | 1,482 (-11%) | 13mo | $215,500 | $145 | 37 |
| 6027 Merle St | 0.70mi | 3/1.5 (+1) | 1,452 (-13%) | 14mo | $175,000 | $121 | 26 |
Match score weights: distance 35% · size 25% · config 20% · recency 20%. Top-matched comps best support the ARV.
Projected returns pro-forma
-3.0% appreciation · 3.3% rent growth · sell at horizon
- IRR
- -0.4%
- Equity multiple
- 0.98×
- Total profit
- $-614
- Equity at exit
- $19,369
- IRR
- 9.5%
- Equity multiple
- 1.74×
- Total profit
- $27,085
- Equity at exit
- $11,231
Cash invested: $36,372 (down + closing). Projections, not guarantees.
Landlord ↔ Tenant lean methodology
- Overall (STATE)
- 73 Landlord-Friendly
- State Ohio
- 73 Landlord-Friendly · R+6
- County
- — inherits STATE
- City
- — inherits STATE
ZIP-level market 43613
- Home prices YoY
- -20.7%
- Rents YoY
- 3.3%
- Active inventory
- 111
- Price-to-rent
- 7.2×
Monthly cashflow live
- Estimated rent
- $1,499 high interval (Pro) →
- Mortgage (P&I)
- −$681
- Tax from tax record
- −$135 /mo · $1,624/yr
- Insurance
- −$54
- HOA
- −$0
- Vacancy / Maint / Mgmt
- −$315
- Net cashflow
- $314
Break-even live
UW: 25.0% down · 7.5% · 30yr · 1.5% tax · 5.0% vac · 8.0% maint · 8.0% mgmt
Financing live
Cash to close
- Down payment
- $32,475
- Closing costs
- $3,897
- Reserves months
- —
- Total cash needed
- —
Loan-product check · same deal, 3 products live
Conventional
25% down · 7.5% · 30yr
- Down + closing
- —
- Monthly P&I
- —
- Monthly cashflow
- —
- DSCR
- —
- Eligible?
- —
Personal DTI + credit; lowest rate.
DSCR
20% down · 8.5% · 30yr
- Down + closing
- —
- Monthly P&I
- —
- Monthly cashflow
- —
- DSCR
- —
- Eligible?
- —
No personal income docs; deal must DSCR.
Hard money
10% down · 12.0% · 12mo
- Down + closing
- —
- Monthly P&I
- —
- Monthly cashflow
- —
- DSCR
- —
- Eligible?
- —
Short-term bridge; refi at stabilization.
Rent comps 6 comps
| Address | Beds | Baths | Sqft | Rent | $/sqft | DOM | Units | Dist |
|---|---|---|---|---|---|---|---|---|
| 3145 Brock Dr Toledo, OH | 3.0 | 2.0 | 1100 | $1,600 | $1.45 | 14d | 1 | 0.24mi |
| 6022 Clover Ln Toledo, OH | 3.0 | 2.0 | 1296 | $1,750 | $1.35 | 21d | 1 | 0.72mi |
| 7076 Middlebury Dr Lambertville, MI | 3.0 | 2.0 | 1248 | $2,495 | $2.00 | 14d | 1 | 1.20mi |
| 2527 Arletta St Toledo, OH | 2.0 | 1.0 | 1100 | $1,100 | $1.00 | 43d | 1 | 1.36mi |
| 2338 Bodette Ave Toledo, OH | 3.0 | 2.0 | 1150 | $1,800 | $1.57 | 21d | 1 | 1.39mi |
| 2347 Bucklew Dr Toledo, OH | 3.0 | 2.0 | 1200 | $1,600 | $1.33 | 14d | 1 | 1.47mi |
Listing history 21 events
-
2026-04-24status Pending
-
2026-03-17price $129,900
-
2026-01-13price $139,900
-
2025-11-21$149,900 Active
-
2008-08-05soldstatus $63,000
-
2007-08-20historical
-
2007-04-17$94,900
-
2007-03-28historical
-
2006-09-27$98,900
-
2006-03-27soldstatus $69,999
-
2006-02-20$69,999
-
2006-01-31historical
-
2005-10-24$74,999
-
2005-08-18historical
-
2005-07-18$91,000
-
2005-07-18historical
-
2005-02-18$97,900
-
2004-09-23historical
-
2004-06-30$99,900
-
2003-10-07historical
-
2003-07-28$99,900
ⓘ Source: listings_history table (triggers on properties + properties_extension) + one-shot
backfill from property_details.listing_events for pre-trigger history.
Tax reassessment forecast OH · Partial reset (capped growth)
- Current annual tax
- $1,624 · $135/mo
- Projected year-2 tax
- $1,825 · $152/mo
- Expected delta
- +$201/yr (+$17/mo · 12.4%)
ⓘ Screening estimate from a state-policy table — verify with the county assessor before closing.
Climate risk First Street
- Flood 1/10 Low FEMA zone X (unshaded) · 0% chance over 30 yrs
- Wildfire 1/10 Low
- Heat 3/10 Moderate 7 d/yr ≥101°F today · 16 d/yr by 30 yrs out
- Wind 2/10 Low
- Air quality 2/10 Low 1 unhealthy d/yr today · 3 by 30 yrs out
Nearby sold comps map
Loading sold comps map…
Walkable amenities ~0.75 mi
Loading nearby amenities…
Taxation est. · year 1
- Rental income
- $17,990
- − Mortgage interest
- −$7,276
- − Property taxes
- −$1,624
- − Insurance
- −$650
- − Repairs & maintenance
- −$1,439
- − Management
- −$1,439
- − Depreciation
- −$3,779
- Taxable income
- $1,782
- Est. tax owed @ 24.0%
- −$428
- After-tax cash flow
- $3,336/yr
For passive investors: Depreciation is non-cash, so a rental often shows a tax loss while cash-flowing — sheltering income. Rental losses are passive: they offset passive income freely, and up to $25,000/yr can offset ordinary (W-2) income if you actively participate and your MAGI is under $100k (phasing out to $0 by $150k); unused losses carry forward. On sale, claimed depreciation is recaptured at up to 25%, and gains may owe capital-gains tax (a 1031 exchange can defer both). Figures are a year-1 estimate at your 24.0% rate — not tax advice; consult a CPA.
Schools (NCES district)
- District
- Washington Local
- NCES district ID
- 3904823
- Math proficiency
- 37% ▼ -20.00%
- Reading proficiency
- 47% ▼ -11.00%
- Median HH income
- $42,105
- Composite
- 35.36/100
- National rank
- #4957
- State rank
- #528 of 656 in OH
Livability — Toledo
- Score
- 66/100
- State rank
- #645
- US rank
- #11442
Category grades
Schools grade is shown separately in the Schools card above.
Census & demographics
- Census place
- Toledo, OH
- County
- Lucas County · 380,724 people
- City population
- 280,811
- Metro
- Toledo, OH
- Population (ZIP)
- 30,780
- Household income
- $64,384
- Rent vs Own
- Severe rent burden
- 917.0
Population outlook (Lucas County) Hauer SSP2
- Today (2025)
- 420,751 people
- By 2030
- 410,187 · -2.5%
- By 2040
- 384,019 · -8.7%
- By 2050
- 355,125 · -15.6%
- By 2075
- 291,683 · -30.7%
- By 2100
- 233,670 · -44.5%
Race, ethnicity, and origin ACS 2023
- Neighborhood character
- Predominantly White (71%)
- Race & ethnicity
- White 71% Black 15% Two or more races 10% Hispanic / Latino 7%
- Hispanic origin (detail)
- Mexican 5%
- Common ancestry
- Romanian 9% Lithuanian 3% Slovak 1%
- Foreign-born
- 2% · Canada
- Languages at home
- 95% English-only · Spanish 3% Arabic 1%
Political lean MEDSL · Lucas
- 2024 margin
- D (+12.6) · D 55.8% · R 43.2%
- 2008→2024 swing
- -18.9pp toward R · 2008: 31.4pp · 2024: 12.6pp
- All cycles
- 2024: D+12.6 2020: D+16.8 2016: D+17.4 2012: D+30.4 2008: D+31.4
Not yet ingested
- Civics
- —
Market trends
- HPI YoY
- ▼ -62.37%
- Current HPI
- 239.1345
- Rent YoY
- ▲ 3.30%
- Metro
- Toledo, OH
- State GDP YoY
- ▲ 1.98%
- F500 in state
- 48
Industry mix (Fortune 500 HQ in OH)
| Industry | F500 HQs | Revenue |
|---|---|---|
| Insurance | 3 | $145B |
|
||
| Industrial Machinery | 3 | $49B |
|
||
| Financial Services | 3 | $24B |
|
||
| Consumer Goods | 2 | $93B |
|
||
| Aerospace / Defense | 2 | $47B |
|
||
| Utilities | 2 | $33B |
|
||
Price history
+30.0% since first listed21 events — show timeline
- 2026-04-24 Pending — NORIS
- 2026-03-17 Price Changed $129,900 NORIS
- 2026-01-13 Price Changed $139,900 NORIS
- 2025-11-21 Listed $149,900 NORIS
- 2008-08-05 Sold (Public Records) $63,000 Public Records
- 2007-08-20 Listing Removed — NORIS
- 2007-04-17 Listed $94,900 NORIS
- 2007-03-28 Listing Removed — NORIS
- 2006-09-27 Listed $98,900 NORIS
- 2006-03-27 Sold (MLS) $69,999 NORIS
- 2006-02-20 Listed $69,999 NORIS
- 2006-01-31 Listing Removed — NORIS
- 2005-10-24 Listed $74,999 NORIS
- 2005-08-18 Listing Removed — NORIS
- 2005-07-18 Listing Removed — NORIS
- 2005-07-18 Listed $91,000 NORIS
- 2005-02-18 Listed $97,900 NORIS
- 2004-09-23 Listing Removed — NORIS
- 2004-06-30 Listed $99,900 NORIS
- 2003-10-07 Listing Removed — NORIS
- 2003-07-28 Listed $99,900 NORIS
Property tax history
+2.4%/yrLatest (2025): $1,624 · +0.7% YoY. Source: county tax records.
Cash-flow waterfall
monthlySold comps — $/sqft
last 12 mo · ≤1 miLoading sold comps…