 Multi-family
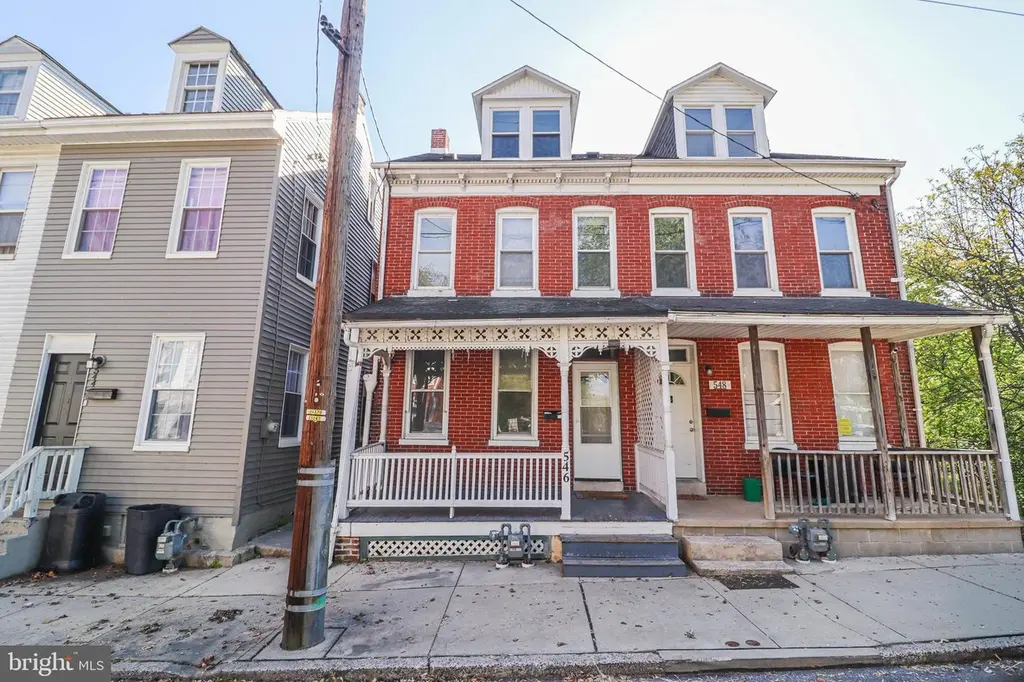
546 Smith St · York, PA
Flood risk 9/10 · Severe
- FEMA flood zone
- A
- Chance of flooding over 30 yrs
- 0.99%
- Est. flood insurance / yr
- $946 – $6,584
Fire risk 1/10 · Minimal
- Est. fire insurance / yr
- $511 – $949
Heat risk 5/10 · Moderate
- Hot days now (above 103°F)
- 7 days/yr
- Hot days in 30 yrs
- 15 days/yr
Wind risk 4/10 · Minor
- Chance of severe wind over 30 yrs
- 10.0%
Air-quality risk 3/10 · Minor
- Unhealthy air days now
- 3 days/yr
- Unhealthy air days in 30 yrs
- 5 days/yr
Risk factors via First Street. Map © Google.
Why this score? — see what drove the B- grade
The composite is a weighted blend of 9 inputs, each scored 0–100. Each bar is that input's sub-score; the figure is the points it added to the 100-point composite (weight × sub-score).
- Cash flow +30.0/30.0
- 1% rule +10.0/10.0
- DSCR +10.0/10.0
- ARV discount +7.5/15.0
- Rent growth +4.1/5.0
- Livability +3.8/5.0
- Condition / age +2.5/5.0
- Schools +0.8/10.0
- Appreciation +0.0/10.0
$179,900
🖨 Deal sheet 📄 Offer letter ✓ Due diligence
Multi-family units
County records classify this as Multi-Family (2-4 Unit). Listing-text estimate: 1 unit. estimate disagrees with records
Listing remarks MLS
Why rent when you can buy? Solidly built 3-bedroom 1.5 bath brick duplex home. Very spacious, fenced-in backyard, Possible 4th bedroom, or office located on the upper level, rear bedroom with balcony access. Solid brick construction freshly painted throughout. Updated energy efficient replacement windows throughout the whole home. This home is move-in ready, see it today!
Key facts
- Built 1900
- Listed 3 days
Neighborhood map
What this means for you Summary
Snapshot
- This is a 3-bed/1.5-bath multifamily listed at $180k.
Deal economics
- At list price, monthly cash flow is $824 ($10k/yr) — positive.
- The deal already cash-flows at list — no discount required.
- Meets the 1% rule at list price ($3k rent vs $180k).
- Cap rate 13.9% vs local median 5.0% in York — top-decile yield for the area; either an underpriced asset or a hidden risk that comps aren't pricing in. Stress-test before assuming the spread holds.
Location & tenants
- Location reads 75/100 on livability (#427 in PA, #3,987 nationally) — a middle-class / working-renter tenant base. Strengths: cost of living A+, health & safety A+, housing A; Watch: amenities D+, crime F, employment F.
- York City SD (urban): math 4% / reading 16% proficiency, ranked #534 of 539 in PA (top 99%) — low school quality limits family demand, transient renter base, plan for 1-2y turnover; 72% free/reduced lunch — lower-income household profile, screen leases tightly.
- Market conditions: Rents rising fast (+6.4%/yr); 249 active listings in the ZIP; 40 comparable units currently listed for rent nearby; rentals at typical pace (median 21d on market — plan ~3-4 weeks tenant-placement turnaround); solid renter incomes; 1,328 units permitted in York County in 2024 (338 in 5+ unit buildings).
- This rent runs 45% of the median local income ($79k/yr) — at the standard rent-burdened threshold; future hikes will face affordability resistance.
Forward outlook
- Local home prices are declining (-3.0%/yr); year-one equity from $1k of loan paydown is wiped out by about $5k of value loss. Plan a longer hold.
- At projected returns (-3.0% appreciation + 6.4% rent growth), your $50k cash investment doubles in ~6 years — after that, you're playing with house money.
Negotiation context
- Only 3 days on market — expect competitive offers; lowballing is unlikely to land.
- 6 sale attempts since 20y ago; this cycle's ask is 6% above the opening price — seller raised mid-cycle; expect resistance to lowballs.
- Current owner paid $55k; list at $180k implies a 227% gain — meaningful room to come down on a strong offer.
Risks & watch-outs
- Watch-outs: flood insurance adds $314/mo; built in 1900 — expect roof / HVAC / electrical / plumbing capex.
- Climate carrying-cost: in FEMA flood zone A (mandatory federal flood insurance); extreme-heat days projected 7→15/yr by 2055 (HVAC capex compounding) — expect insurance premiums to compound above CPI over the hold.
Questions for the listing agent
- Built in 1900 — when were the roof, HVAC, electrical panel, plumbing, and water heater last replaced?
- What's the actual annual flood-insurance premium (NFIP or private), and is the property in a SFHA with mandatory coverage?
- Is there a deadline driving the sale (1031 exchange, divorce, estate, relocation)? That informs how much negotiation room exists.
- Crime grade is F in this area — have there been break-ins, vandalism, or insurance claims at this property in the last 3 years? What carrier currently insures it and at what premium?
- What's the average days-on-market for RENTAL listings here right now (not sales)? A rising rental-DOM trend means longer vacancies and softer asking-rent achievability than the comps imply.
- What's the recent tenant-quality profile in this submarket — average credit score on applications, eviction rate, late-payment / NSF rate, and stable-employment percentage? A property-management company in the area should have these aggregated.
- How much new apartment / multifamily construction is in the pipeline within 1–3 miles? Heavy new supply (>2% of stock underway) typically softens rents 12–24 months out; light construction supports rent growth.
Investment metrics
- 1% rule
- 1.63% ✓
- Cap rate
- 13.88%
- Cash-on-cash
- 27.11%
- DSCR
- 2.21
- GRM
- 5.1
CMA / ARV
No comps found within radius.
Projected returns pro-forma
-3.0% appreciation · 6.38% rent growth · sell at horizon
- IRR
- 16.0%
- Equity multiple
- 1.67×
- Total profit
- $33,871
- Equity at exit
- $26,824
- IRR
- 27.2%
- Equity multiple
- 3.84×
- Total profit
- $143,304
- Equity at exit
- $15,554
Cash invested: $50,372 (down + closing). Projections, not guarantees.
Landlord ↔ Tenant lean methodology
- Overall (STATE)
- 62 Landlord-Friendly
- State Pennsylvania
- 62 Landlord-Friendly · EVEN
- County
- — inherits STATE
- City
- — inherits STATE
ZIP-level market 17404
- Rents YoY
- 6.4%
- Active inventory
- 249
- Price-to-rent
- 15.3×
Monthly cashflow live
- Estimated rent
- $2,935 medium interval (Pro) →
- Mortgage (P&I)
- −$943
- Tax from tax record
- −$162 /mo · $1,946/yr
- Insurance
- −$75
- Flood insurance flood zone
- −$314 /mo · $3,765/yr
- HOA
- −$0
- Vacancy / Maint / Mgmt
- −$616
- Net cashflow
- $824
Break-even live
3-unit breakdown (identical units grouped — click to expand)
| Units | Beds | Baths | Est. rent |
|---|---|---|---|
| 3× units | 2 | 1 | $2,934 |
| #1 | 2 | 1 | $978 |
| #2 | 2 | 1 | $978 |
| #3 | 2 | 1 | $978 |
| Total (3 units) | $2,935 | ||
UW: 25.0% down · 7.5% · 30yr · 1.5% tax · 5.0% vac · 8.0% maint · 8.0% mgmt
Financing live
Cash to close
- Down payment
- $44,975
- Closing costs
- $5,397
- Reserves months
- —
- Total cash needed
- —
Loan-product check · same deal, 3 products live
Conventional
25% down · 7.5% · 30yr
- Down + closing
- —
- Monthly P&I
- —
- Monthly cashflow
- —
- DSCR
- —
- Eligible?
- —
Personal DTI + credit; lowest rate.
DSCR
20% down · 8.5% · 30yr
- Down + closing
- —
- Monthly P&I
- —
- Monthly cashflow
- —
- DSCR
- —
- Eligible?
- —
No personal income docs; deal must DSCR.
Hard money
10% down · 12.0% · 12mo
- Down + closing
- —
- Monthly P&I
- —
- Monthly cashflow
- —
- DSCR
- —
- Eligible?
- —
Short-term bridge; refi at stabilization.
Rent comps 40 comps
| Address | Beds | Baths | Sqft | Rent | $/sqft | DOM | Units | Dist |
|---|---|---|---|---|---|---|---|---|
| 428 Smith St York, PA | 3.0 | 1.0 | 1522 | $1,350 | $0.89 | 13d | 1 | 0.09mi |
| 289 Union St York, PA | 4.0 | 1.0 | 1450 | $1,600 | $1.10 | 44d | 1 | 0.21mi |
| 133 Stevens Ave York, PA | 3.0 | 1.0 | 1200 | $1,300 | $1.08 | 44d | 1 | 0.23mi |
| 334 N Beaver St York, PA | 3.0 | 1.0 | 1140 | $1,050 | $0.92 | 13d | 1 | 0.25mi |
| 175 W Gay Ave York, PA | 1.0–2.0 | 1.0 | 1219 | $1,650 | $1.35 | 13d | 2 | 0.35mi |
| 314 W Gay Ave York, PA | 3.0 | 1.0 | 1060 | $1,250 | $1.18 | 21d | 1 | 0.36mi |
| 216 Park Pl York, PA | 4.0 | 1.0 | 1192 | $1,350 | $1.13 | 13d | 1 | 0.39mi |
| 251 N George St York, PA | 2.0 | 2.0 | 1100 | $1,595 | $1.45 | 13d | 1 | 0.41mi |
| 450 Madison Ave York, PA | 1.0–2.0 | 1.0 | 862 | $1,250 | $1.45 | 13d | 1 | 0.43mi |
| 231 Roosevelt Ave York, PA | 3.0 | 1.5 | 1584 | $1,750 | $1.10 | 13d | 1 | 0.43mi |
| 113 Arch St York, PA | 4.0 | 1.0 | 1188 | $1,200 | $1.01 | 13d | 1 | 0.46mi |
| 720 Elm Ter York, PA | 3.0 | 1.5 | 1200 | $1,950 | $1.62 | 21d | 1 | 0.50mi |
| 631 Roosevelt Ave Unit 2 York, PA | 3.0 | 1.0 | 1170 | $1,150 | $0.98 | 13d | 1 | 0.51mi |
| 28 N George St Unit H York, PA | 2.0 | 2.0 | 1400 | $1,550 | $1.11 | 44d | 1 | 0.57mi |
| 588 Company St York, PA | 3.0 | 1.5 | 1416 | $1,475 | $1.04 | 44d | 1 | 0.65mi |
| 231 Franklin Way York, PA | 3.0 | 1.0 | 920 | $1,195 | $1.30 | 13d | 1 | 0.69mi |
| 132 N West St York, PA | 4.0 | 1.0 | 1560 | $1,600 | $1.03 | 13d | 1 | 0.69mi |
| 245 Franklin Way York, PA | 2.0 | 2.0 | 1240 | $1,150 | $0.93 | 13d | 1 | 0.70mi |
| 42 Laurel St York, PA | 3.0 | 1.0 | 1136 | $1,375 | $1.21 | 21d | 1 | 0.71mi |
| 132 S Beaver St Apt 4 York, PA | 2.0 | 2.0 | 1000 | $1,250 | $1.25 | 44d | 1 | 0.73mi |
| 339 E Market St Unit 1 York, PA | 4.0 | 1.5 | 1600 | $1,650 | $1.03 | 21d | 1 | 0.90mi |
| 466 W College Ave York, PA | 3.0 | 1.0 | 1068 | $1,295 | $1.21 | 44d | 1 | 0.92mi |
| 813 Madison Ave York, PA | 2.0 | 1.5 | 1100 | $1,175 | $1.07 | 13d | 1 | 0.92mi |
| 1301 N Duke St York, PA | 2.0 | 1.5 | 1520 | $1,475 | $0.97 | 44d | 1 | 0.92mi |
| 446 Wallace St York, PA | 3.0 | 1.0 | 1092 | $1,295 | $1.19 | 21d | 1 | 0.93mi |
| 208 Liberty Ct York, PA | 3.0 | 1.0 | 1096 | $1,195 | $1.09 | 44d | 1 | 1.06mi |
| 648 W College Ave York, PA | 3.0 | 1.0 | 1100 | $1,275 | $1.16 | 44d | 1 | 1.08mi |
| 631 Wallace St Unit 631 York, PA | 4.0 | 1.0 | 1545 | $1,325 | $0.86 | 13d | 1 | 1.09mi |
| 443 S Duke St York, PA | 3.0 | 1.0 | 1028 | $1,225 | $1.19 | 44d | 1 | 1.11mi |
| 444 S Duke St York, PA | 3.0 | 1.0 | 1200 | $1,200 | $1.00 | 44d | 1 | 1.11mi |
| 514 S Duke St York, PA | 3.0 | 1.0 | 1289 | $1,625 | $1.26 | 21d | 1 | 1.16mi |
| 720 Chestnut St Apt 2 York, PA | 4.0 | 1.0 | 1400 | $1,300 | $0.93 | 13d | 1 | 1.20mi |
| 925 W College Ave York, PA | 4.0 | 1.0 | 1660 | $1,425 | $0.86 | 13d | 1 | 1.22mi |
| 30 N Franklin St York, PA | 3.0 | 1.0 | 1400 | $1,395 | $1.00 | 44d | 1 | 1.23mi |
| 119 W Jackson St York, PA | 4.0 | 1.0 | 1800 | $1,395 | $0.78 | 44d | 1 | 1.28mi |
| 626 S Queen St York, PA | 3.0 | 1.0 | 1526 | $1,225 | $0.80 | 21d | 1 | 1.31mi |
| 537 W Jackson St York, PA | 3.0 | 2.0 | 1795 | $1,795 | $1.00 | 13d | 1 | 1.34mi |
| 433 Piedmont Cir York, PA | 1.0–3.0 | 1.0–1.5 | 850 | $1,655 | $1.95 | 13d | 2 | 1.34mi |
| 433 Piedmont Cir York, PA | 3.0 | 1.5 | 1000 | $1,656 | $1.66 | 44d | 1 | 1.34mi |
| 715 Vander Ave York, PA | 3.0 | 1.0 | 1180 | $1,295 | $1.10 | 13d | 1 | 1.42mi |
Listing history 17 events
-
2026-04-26status Pending
-
2026-04-23price $179,900
-
2026-04-23$170,000 Active
-
2020-10-22soldstatus $55,000
-
2020-10-14soldstatus $55,000 Closed 374-char remark
Show marketing remark (374 chars)
Why rent when you can buy? Solidly built 3-bedroom 1.5 bath brick duplex home. Very spacious, fenced-in backyard, Possible 4th bedroom, or office located on the upper level, rear bedroom with balcony access. Solid brick construction freshly painted throughout. Updated energy efficient replacement windows throughout the whole home. This home is move-in ready, see it today!
-
2020-09-27status Pending 374-char remark
Show marketing remark (374 chars)
Why rent when you can buy? Solidly built 3-bedroom 1.5 bath brick duplex home. Very spacious, fenced-in backyard, Possible 4th bedroom, or office located on the upper level, rear bedroom with balcony access. Solid brick construction freshly painted throughout. Updated energy efficient replacement windows throughout the whole home. This home is move-in ready, see it today!
-
2020-09-25$55,000 Active 374-char remark
Show marketing remark (374 chars)
Why rent when you can buy? Solidly built 3-bedroom 1.5 bath brick duplex home. Very spacious, fenced-in backyard, Possible 4th bedroom, or office located on the upper level, rear bedroom with balcony access. Solid brick construction freshly painted throughout. Updated energy efficient replacement windows throughout the whole home. This home is move-in ready, see it today!
-
2014-07-23historical
-
2014-05-06$37,900
-
2014-03-11historical
-
2013-06-30historical
-
2013-03-11$39,900
-
2012-11-30$39,900
-
2007-01-02soldstatus $38,500
-
2006-12-28soldstatus $38,500
-
2006-12-22historical
-
2006-12-07$39,999
ⓘ Source: listings_history table (triggers on properties + properties_extension) + one-shot
backfill from property_details.listing_events for pre-trigger history.
Tax reassessment forecast PA · Partial reset (capped growth)
- Current annual tax
- $1,946 · $162/mo
- Projected year-2 tax
- $2,394 · $200/mo
- Expected delta
- +$448/yr (+$37/mo · 23.0%)
ⓘ Screening estimate from a state-policy table — verify with the county assessor before closing.
Climate risk First Street
- Flood 9/10 Extreme FEMA zone A · 99% chance over 30 yrs
- Wildfire 1/10 Low
- Heat 5/10 Major 7 d/yr ≥103°F today · 15 d/yr by 30 yrs out
- Wind 4/10 Moderate 10% chance of damaging wind over 30 yrs
- Air quality 3/10 Moderate 3 unhealthy d/yr today · 5 by 30 yrs out
Nearby sold comps map
Loading sold comps map…
Walkable amenities ~0.75 mi
Loading nearby amenities…
Taxation est. · year 1
- Rental income
- $35,220
- − Mortgage interest
- −$10,077
- − Property taxes
- −$1,946
- − Insurance
- −$4,664
- − Repairs & maintenance
- −$2,818
- − Management
- −$2,818
- − Depreciation
- −$5,233
- Taxable income
- $7,664
- Est. tax owed @ 24.0%
- −$1,839
- After-tax cash flow
- $8,053/yr
For passive investors: Depreciation is non-cash, so a rental often shows a tax loss while cash-flowing — sheltering income. Rental losses are passive: they offset passive income freely, and up to $25,000/yr can offset ordinary (W-2) income if you actively participate and your MAGI is under $100k (phasing out to $0 by $150k); unused losses carry forward. On sale, claimed depreciation is recaptured at up to 25%, and gains may owe capital-gains tax (a 1031 exchange can defer both). Figures are a year-1 estimate at your 24.0% rate — not tax advice; consult a CPA.
Schools (NCES district)
- District
- York City SD
- NCES district ID
- 4226820
- Math proficiency
- 4% ▼ -7.00%
- Reading proficiency
- 16% ▼ -9.00%
- Median HH income
- $29,470
- Composite
- 7.61/100
- National rank
- #9943
- State rank
- #534 of 539 in PA
Livability — York
- Score
- 75/100
- State rank
- #427
- US rank
- #3987
Category grades
Schools grade is shown separately in the Schools card above.
Census & demographics
- Census place
- York, PA
- County
- York County · 278,806 people
- City population
- 184,764
- Metro
- York-Hanover, PA
- Population (ZIP)
- 39,374
- Household income
- $78,506
- Rent vs Own
- Severe rent burden
- 722.0
Population outlook (York County) Hauer SSP2
- Today (2025)
- 454,205 people
- By 2030
- 457,407 · +0.7%
- By 2040
- 457,529 · +0.7%
- By 2050
- 448,261 · -1.3%
- By 2075
- 427,388 · -5.9%
- By 2100
- 384,218 · -15.4%
Race, ethnicity, and origin ACS 2023
- Neighborhood character
- Majority White (65%)
- Race & ethnicity
- White 65% Hispanic / Latino 19% Black 12% Two or more races 8%
- Hispanic origin (detail)
- Mexican 2% Puerto Rican 9% Dominican 4%
- Common ancestry
- Romanian 2% Slovak 2% Lithuanian 1%
- Foreign-born
- 6% · Canada, Vietnam
- Languages at home
- 85% English-only · Spanish 12% Russian/Polish/Slavic 1%
Political lean MEDSL · York
- 2024 margin
- Strong R (+25.3) · D 36.9% · R 62.1%
- 2008→2024 swing
- -11.7pp toward R · 2008: -13.6pp · 2024: -25.3pp
- All cycles
- 2024: R+25.3 2020: R+24.6 2016: R+29.3 2012: R+21.2 2008: R+13.6
Not yet ingested
- Civics
- —
Market trends
- HPI YoY
- ▼ -135.44%
- Current HPI
- 237.5683
- Rent YoY
- ▲ 6.38%
- Metro
- York-Hanover, PA
- State GDP YoY
- ▲ 1.68%
- F500 in state
- 34
Industry mix (Fortune 500 HQ in PA)
| Industry | F500 HQs | Revenue |
|---|---|---|
| Healthcare | 2 | $309B |
|
||
| Insurance | 2 | $27B |
|
||
| Telecommunications / Media | 1 | $124B |
|
||
| Industrial Distribution | 1 | $22B |
|
||
| Financial Services | 1 | $20B |
|
||
| Chemicals / Materials | 1 | $18B |
|
||
Price history
+349.8% since first listed17 events — show timeline
- 2026-04-26 Pending — BRIGHT MLS
- 2026-04-23 Price Changed $179,900 BRIGHT MLS
- 2026-04-23 Listed $170,000 BRIGHT MLS
- 2020-10-22 Sold (Public Records) $55,000 Public Records
- 2020-10-14 Sold (MLS) $55,000 BRIGHT MLS
- 2020-09-27 Pending — BRIGHT MLS
- 2020-09-25 Listed $55,000 BRIGHT MLS
- 2014-07-23 Listing Removed — BRIGHT MLS
- 2014-05-06 Listed $37,900 BRIGHT MLS
- 2014-03-11 Listing Removed — BRIGHT MLS
- 2013-06-30 Listing Removed — BRIGHT MLS
- 2013-03-11 Listed $39,900 BRIGHT MLS
- 2012-11-30 Listed $39,900 BRIGHT MLS
- 2007-01-02 Sold (Public Records) $38,500 Public Records
- 2006-12-28 Sold (MLS) $38,500 BRIGHT MLS
- 2006-12-22 Listing Removed — BRIGHT MLS
- 2006-12-07 Listed $39,999 BRIGHT MLS
Property tax history
-2.0%/yrLatest (2025): $1,946 · +0.9% YoY. Source: county tax records.
Cash-flow waterfall
monthlySold comps — $/sqft
last 12 mo · ≤1 miLoading sold comps…