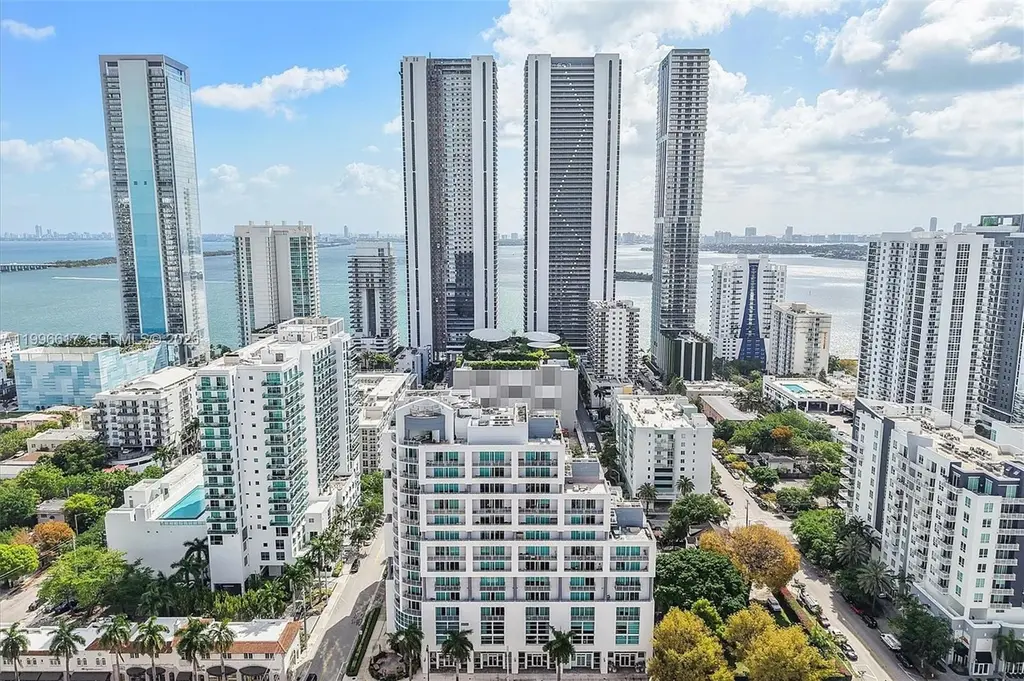
350 NE 24th St #814 · Miami, FL
Flood risk No data
- FEMA flood zone
- —
- Chance of flooding over 30 yrs
- —
- Est. flood insurance / yr
- —
Fire risk No data
- Est. fire insurance / yr
- —
Heat risk No data
- Hot days now (above threshold)
- —
- Hot days in 30 yrs
- —
Wind risk No data
- Chance of severe wind over 30 yrs
- —
Air-quality risk No data
- Unhealthy air days now
- —
- Unhealthy air days in 30 yrs
- —
Risk factors via First Street. Map © Google.
Why this score? — see what drove the C- grade
The composite is a weighted blend of 9 inputs, each scored 0–100. Each bar is that input's sub-score; the figure is the points it added to the 100-point composite (weight × sub-score).
- Cash flow +15.0/30.0
- ARV discount +7.5/15.0
- 1% rule +7.4/10.0
- Appreciation +5.1/10.0
- DSCR +4.6/10.0
- Schools +4.2/10.0
- Livability +3.9/5.0
- Rent growth +3.2/5.0
- Condition / age +2.5/5.0
$315,000
🖨 Deal sheet 📄 Offer letter ✓ Due diligence
Listing remarks
City 24 Condo at Edgewater. Beautiful 1 Bedroom 1 Bath in a Full-service Boutique Building. Open Kitchen with Quartz Countertops and Stainless Steel Appliances. Volume Ceilings, Washer/dryer in Unit. Spectacular Pool Deck with Tropical Landscaping Overlooking the Vibrant Neighborhood. 24-hour Lobby Attendant, Pool, Spa, Gym, Sauna, Club Room, Billiard Room, Yoga Room, Business Center, Covered Assigned Parking, On-site Management. Close to Wynwood, Midtown, Design District, Brickell, Airport, and South Beach. A Modern Luxury Boutique Building in Walkable Edgewater.
Key facts
- Quartz countertops
- Open kitchen
- Washer dryer in unit
Tags
Property features AI
Finance
- Other: Building name: CITY 24
Exterior
- Parking: Garage available
- Security: Doorman; Concierge
- Home design: Condominium; High-rise building (15 floors total)
- Construction: Building contains 119 units
- Exterior features: Private balcony; On-site swimming pool
Interior
- Bedrooms: 1 bedroom
- Bathrooms: 1 bathroom
- Interior features: Doorman and concierge building services; Elevator access; Private balcony; Building fitness center; Swimming pool
- Laundry & utility: Washer and dryer in unit
Neighborhood map
What this means for you Summary
Snapshot
- This is a 1-bed/1.0-bath condo listed at $315k.
Deal economics
- At list price, monthly cash flow is $101 ($1k/yr) — positive.
- The deal already cash-flows at list — no discount required.
- Meets the 1% rule at list price ($4k rent vs $315k).
- Cap rate 6.7% vs local median 1.9% in Miami — top-decile yield for the area; either an underpriced asset or a hidden risk that comps aren't pricing in. Stress-test before assuming the spread holds.
Location & tenants
- Location reads 78/100 on livability (#177 in FL, #2,724 nationally) — a middle-class / working-renter tenant base. Strengths: amenities A+, commute A+, health & safety A+; Watch: employment C-, crime F, cost of living F.
- Miami-Dade (suburban): math 45% / reading 54% proficiency, ranked #40 of 73 in FL (top 55%) — families likely to look elsewhere, expect single-tenant / working-renter base with shorter leases; 64% free/reduced lunch — lower-income household profile, screen leases tightly.
- Market conditions: Rents rising (+2.7%/yr); 757 active listings in the ZIP; 1 comparable units currently listed for rent nearby; solid renter incomes; 10,051 units permitted in Miami-Dade County in 2024 (7,758 in 5+ unit buildings).
- At $3,911/mo this rent would consume 50% of the median local household income ($94k/yr) (locally 3106% of renters already pay >50% of income on rent) — very limited rent-growth headroom before tenants either downsize or default.
Forward outlook
- In year one you build about $3k of equity ($2k loan paydown + $856 appreciation (0.3% local appreciation)).
- Miami-Dade County population projected at +28% by 2050 — long-run rental-demand tailwind backs the buy-and-hold thesis.
- By year 9, paydown + projected appreciation supports a ~$33k cash-out refi (75% LTV) — recoverable capital for the next deal without selling this one.
Negotiation context
- Only 9 days on market — expect competitive offers; lowballing is unlikely to land.
Risks & watch-outs
- Watch-outs: HOA is 21% of rent.
Questions for the listing agent
- What does the HOA fee cover, when was the last increase, and are there any pending special assessments or reserve-fund shortfalls?
- Any open or pending special assessments — roof, HVAC, plumbing, elevator, façade? What's the per-unit balance and payoff schedule, and is the seller paying it off at close or rolling it to the buyer?
- Is there a deadline driving the sale (1031 exchange, divorce, estate, relocation)? That informs how much negotiation room exists.
- Schools are B-rated — typically a magnet for longer-tenancy family renters. What's the average tenant stay here, and is there a school-zone premium baked into asking?
- Crime grade is F in this area — have there been break-ins, vandalism, or insurance claims at this property in the last 3 years? What carrier currently insures it and at what premium?
- What's the average days-on-market for RENTAL listings here right now (not sales)? A rising rental-DOM trend means longer vacancies and softer asking-rent achievability than the comps imply.
- What's the recent tenant-quality profile in this submarket — average credit score on applications, eviction rate, late-payment / NSF rate, and stable-employment percentage? A property-management company in the area should have these aggregated.
- How much new apartment / multifamily construction is in the pipeline within 1–3 miles? Heavy new supply (>2% of stock underway) typically softens rents 12–24 months out; light construction supports rent growth.
Investment metrics
- 1% rule
- 1.24% ✓
- Cap rate
- 6.68%
- Cash-on-cash
- 1.37%
- DSCR
- 1.06
- GRM
- 6.7
CMA / ARV
No comps found within radius.
Projected returns pro-forma
0.27% appreciation · 2.73% rent growth · sell at horizon
- IRR
- 0.2%
- Equity multiple
- 1.01×
- Total profit
- $737
- Equity at exit
- $95,772
- IRR
- 5.4%
- Equity multiple
- 1.60×
- Total profit
- $52,784
- Equity at exit
- $118,617
Cash invested: $88,200 (down + closing). Projections, not guarantees.
Landlord ↔ Tenant lean methodology
- Overall (STATE)
- 87 Strongly Landlord-Friendly
- State Florida
- 87 Strongly Landlord-Friendly · R+3
- County
- — inherits STATE
- City
- — inherits STATE
ZIP-level market 33137
- Home prices YoY
- 0.1%
- Rents YoY
- 2.7%
- Active inventory
- 757
- Price-to-rent
- 6.7×
Monthly cashflow live
- Estimated rent
- $3,911 medium interval (Pro) →
- Mortgage (P&I)
- −$1,652
- Tax est. 1.5%
- −$394 /mo · $4,725/yr
- Insurance
- −$131
- HOA est. from 2 same-building comps
- −$812
- Vacancy / Maint / Mgmt
- −$821
- Net cashflow
- $101
Break-even live
UW: 25.0% down · 7.5% · 30yr · 1.5% tax · 5.0% vac · 8.0% maint · 8.0% mgmt
Financing live
Cash to close
- Down payment
- $78,750
- Closing costs
- $9,450
- Reserves months
- —
- Total cash needed
- —
Loan-product check · same deal, 3 products live
Conventional
25% down · 7.5% · 30yr
- Down + closing
- —
- Monthly P&I
- —
- Monthly cashflow
- —
- DSCR
- —
- Eligible?
- —
Personal DTI + credit; lowest rate.
DSCR
20% down · 8.5% · 30yr
- Down + closing
- —
- Monthly P&I
- —
- Monthly cashflow
- —
- DSCR
- —
- Eligible?
- —
No personal income docs; deal must DSCR.
Hard money
10% down · 12.0% · 12mo
- Down + closing
- —
- Monthly P&I
- —
- Monthly cashflow
- —
- DSCR
- —
- Eligible?
- —
Short-term bridge; refi at stabilization.
Rent comps 1 comps
| Address | Beds | Baths | Sqft | Rent | $/sqft | DOM | Units | Dist |
|---|---|---|---|---|---|---|---|---|
| 2900 Biscayne Blvd Miami, FL | 3.0 | 1.0–3.5 | 1260 | $8,110 | $6.44 | 1d | 13 | 0.31mi |
HOA detail condo
- Monthly dues
- $0 · $0/yr
- Likely covers
- waterlandscapingpoolgymparking
- Assessments
- None detected in remarks — confirm with the listing agent.
Listing history 7 events
-
2026-06-18days on market $315,000 Coming Soon 9 DOM
-
2026-06-17days on market $315,000 Coming Soon 8 DOM
-
2026-06-16days on market $315,000 Coming Soon 7 DOM
-
2026-06-15days on market $315,000 Coming Soon 6 DOM
-
2026-06-13days on market $315,000 Coming Soon 4 DOM
-
2026-06-10remarks 570-char remark
-
2026-06-10$315,000 Coming Soon 1 DOM
ⓘ Source: listings_history table (triggers on properties + properties_extension) + one-shot
backfill from property_details.listing_events for pre-trigger history.
Nearby sold comps map
Loading sold comps map…
Walkable amenities ~0.75 mi
Loading nearby amenities…
Taxation est. · year 1
- Rental income
- $46,929
- − Mortgage interest
- −$17,645
- − Property taxes
- −$4,725
- − Insurance
- −$1,575
- − Repairs & maintenance
- −$3,754
- − Management
- −$3,754
- − HOA
- −$9,744
- − Depreciation
- −$9,164
- Taxable loss
- −$3,432
- Est. tax savings @ 24.0%
- +$824
- After-tax cash flow
- $2,031/yr
For passive investors: Depreciation is non-cash, so a rental often shows a tax loss while cash-flowing — sheltering income. Rental losses are passive: they offset passive income freely, and up to $25,000/yr can offset ordinary (W-2) income if you actively participate and your MAGI is under $100k (phasing out to $0 by $150k); unused losses carry forward. On sale, claimed depreciation is recaptured at up to 25%, and gains may owe capital-gains tax (a 1031 exchange can defer both). Figures are a year-1 estimate at your 24.0% rate — not tax advice; consult a CPA.
Schools (NCES district)
- District
- Miami-Dade
- NCES district ID
- 1200390
- Math proficiency
- 45% ▼ -16.00%
- Reading proficiency
- 54% ▼ -5.00%
- Median HH income
- $43,928
- Composite
- 41.76/100
- National rank
- #3397
- State rank
- #40 of 73 in FL
Livability — Miami
- Score
- 78/100
- State rank
- #177
- US rank
- #2724
Category grades
Schools grade is shown separately in the Schools card above.
Census & demographics
- Census place
- Miami, FL
- County
- Miami-Dade County · 2,697,751 people
- City population
- 827,308
- Metro
- Miami-Fort Lauderdale-Pompano Beach, FL
- Population (ZIP)
- 29,414
- Household income
- $94,036
- Rent vs Own
- Severe rent burden
- 3106.0
Population outlook (Miami-Dade County) Hauer SSP2
- Today (2025)
- 3,126,439 people
- By 2030
- 3,325,765 · +6.4%
- By 2040
- 3,697,561 · +18.3%
- By 2050
- 4,012,134 · +28.3%
- By 2075
- 4,605,612 · +47.3%
- By 2100
- 4,866,598 · +55.7%
Race, ethnicity, and origin ACS 2023
- Neighborhood character
- Diverse neighborhood (Simpson 0.63)
- Race & ethnicity
- Hispanic / Latino 54% Two or more races 25% White 24% Black 16% Asian 2%
- Hispanic origin (detail)
- Mexican 1% Puerto Rican 5% Cuban 10% Dominican 3% Salvadoran 3%
- Common ancestry
- Hispanic 8% Estonian 2% Lithuanian 2%
- Foreign-born
- 47% · Canada, Jamaica, Dominican Republic
- Languages at home
- 34% English-only · Spanish 49% French/Haitian/Cajun 8% Other Indo-European 5%
Political lean MEDSL · Miami-Dade
- 2024 margin
- R (+11.4) · D 43.9% · R 55.4%
- 2008→2024 swing
- -27.6pp toward R · 2008: 16.1pp · 2024: -11.4pp
- All cycles
- 2024: R+11.4 2020: D+7.3 2016: D+29.6 2012: D+23.7 2008: D+16.1
Not yet ingested
- Civics
- —
Market trends
- HPI YoY
- ▲ 0.27%
- Current HPI
- 385.1514
- Rent YoY
- ▲ 2.73%
- Metro
- Miami-Fort Lauderdale-Pompano Beach, FL
- State GDP YoY
- ▲ 3.28%
- F500 in state
- 36
Industry mix (Fortune 500 HQ in FL)
| Industry | F500 HQs | Revenue |
|---|---|---|
| Industrial Technology | 2 | $29B |
|
||
| Insurance | 2 | $17B |
|
||
| Retail | 1 | $60B |
|
||
| Technology Distribution | 1 | $58B |
|
||
| Homebuilding | 1 | $35B |
|
||
| Technology Manufacturing | 1 | $35B |
|
||
Cash-flow waterfall
monthlySold comps — $/sqft
last 12 mo · ≤1 miLoading sold comps…