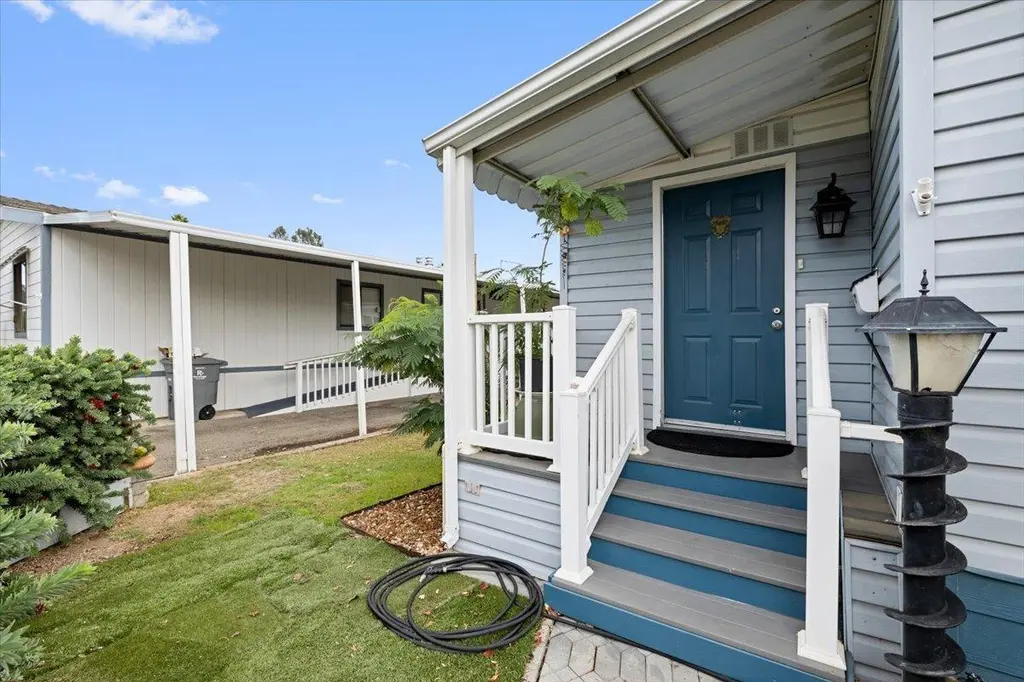
5505 S Grove St #119 · Rocklin, CA
Flood risk 1/10 · Minimal
- FEMA flood zone
- X (unshaded)
- Chance of flooding over 30 yrs
- 0.0%
- Est. flood insurance / yr
- $507 – $1,088
Fire risk 8/10 · Major
- Est. fire insurance / yr
- $659 – $1,223
Heat risk 7/10 · Major
- Hot days now (above 104°F)
- 7 days/yr
- Hot days in 30 yrs
- 16 days/yr
Wind risk 1/10 · Minimal
- Chance of severe wind over 30 yrs
- —
Air-quality risk 10/10 · Severe
- Unhealthy air days now
- 32 days/yr
- Unhealthy air days in 30 yrs
- 38 days/yr
Risk factors via First Street. Map © Google.
Why this score? — see what drove the B- grade
The composite is a weighted blend of 9 inputs, each scored 0–100. Each bar is that input's sub-score; the figure is the points it added to the 100-point composite (weight × sub-score).
- Cash flow +30.0/30.0
- DSCR +10.0/10.0
- 1% rule +9.8/10.0
- ARV discount +5.1/15.0
- Schools +5.0/10.0
- Livability +3.7/5.0
- Rent growth +3.2/5.0
- Condition / age +2.5/5.0
- Appreciation +0.0/10.0
$155,000
🖨 Deal sheet 📄 Offer letter ✓ Due diligence
Listing remarks
Welcome to your dream home! Fantastic double-wide in 55+ Rocklin Estates Mobile Home Park. This beautifully re-done and lovingly maintained 2-bedroom, 2- bathroom home has been completely updated and upgraded throughout over the past 5 years with tasteful luxury. The kitchen offers quartz countertops, a single large, extra deep gray stone sink, and stainless-steel appliances. Luxury Vinyl Plank flooring runs throughout the home. Oversize Master Suite with large closet and tastefully re-done bathroom with quartz countertops and step-in shower with fiberglass shower pan. Second bathroom offers a soaking tub, and quartz countertops. Large sunroom at entrance to home and off of living area. Mos
Key facts
- Quartz countertops
- Soaking tub
- Updated and upgraded
Tags
Neighborhood map
What this means for you Summary
Snapshot
- This is a 2-bed/2.0-bath manufactured listed at $155k.
Deal economics
- At list price, monthly cash flow is $747 ($9k/yr) — positive.
- The deal already cash-flows at list — no discount required.
- Meets the 1% rule at list price ($2k rent vs $155k).
- Recommended offer: $136k (12.0% below list) — sets the bar for market timing.
- Cap rate 12.1% vs local median 2.7% in Rocklin — top-decile yield for the area; either an underpriced asset or a hidden risk that comps aren't pricing in. Stress-test before assuming the spread holds.
Location & tenants
- Location reads 74/100 on livability (#136 in CA, #4,755 nationally) — a middle-class / working-renter tenant base. Strengths: schools A+, employment A+, housing A+; Watch: commute D+, amenities F, cost of living F.
- Rocklin Unified (suburban): math 44% / reading 65% proficiency, ranked #96 of 517 in CA (top 19%) — acceptable for families but not a draw, mixed tenant base, ~2y average lease; only 14% free/reduced lunch — higher-income household profile.
- Market conditions: Rents rising (+2.9%/yr); 159 active listings in the ZIP; 16 comparable units currently listed for rent nearby; rentals leasing fast (median 12d on market — plan ~1-2 weeks tenant-placement turnaround); solid renter incomes; 3,535 units permitted in Placer County in 2024 (689 in 5+ unit buildings).
Forward outlook
- Local home prices are declining (-3.0%/yr); year-one equity from $1k of loan paydown is wiped out by about $5k of value loss. Plan a longer hold.
- Placer County population projected at +20% by 2050 — long-run rental-demand tailwind backs the buy-and-hold thesis.
- At projected returns (-3.0% appreciation + 2.9% rent growth), your $43k cash investment doubles in ~6 years — after that, you're playing with house money.
Negotiation context
- It's been on market 149 days — a 12% lower offer ($136k) is reasonable based on typical stale-listing flexibility.
Risks & watch-outs
- Climate carrying-cost: severe wildfire risk; extreme-heat days projected 7→16/yr by 2055 (HVAC capex compounding) — expect insurance premiums to compound above CPI over the hold.
Questions for the listing agent
- It's been on market 149 days. Have you received any prior offers? Is the seller open to a 12% concession, seller financing, or rate buy-down credit?
- Built in 1967 — when were the roof, HVAC, electrical panel, plumbing, and water heater last replaced?
- Why hasn't it sold? Are there any deal-killer items the seller is aware of (foundation, flood, title, zoning, code violations)?
- Is there a deadline driving the sale (1031 exchange, divorce, estate, relocation)? That informs how much negotiation room exists.
- Schools are A-rated — typically a magnet for longer-tenancy family renters. What's the average tenant stay here, and is there a school-zone premium baked into asking?
- What's the average days-on-market for RENTAL listings here right now (not sales)? A rising rental-DOM trend means longer vacancies and softer asking-rent achievability than the comps imply.
- What's the recent tenant-quality profile in this submarket — average credit score on applications, eviction rate, late-payment / NSF rate, and stable-employment percentage? A property-management company in the area should have these aggregated.
- How much new for-sale + rental construction is in the pipeline within 1–3 miles? Heavy new supply typically softens prices + rents 12–24 months out; constrained supply supports both.
Investment metrics
- 1% rule
- 1.48% ✓
- Cap rate
- 12.07%
- Cash-on-cash
- 20.65%
- DSCR
- 1.92
- GRM
- 5.6
CMA / ARV
- ARV (median comp)
- $147,229
- List price
- $155,000
- Delta
- 5.28%
- Verdict
- FAIR
- Comps
- 20 within 1.0 mi
Show comp detail 12 sales within ~0.75 mi
| Address | Dist | Beds/Ba | Sqft | Sold | Price | $/sf | Match |
|---|---|---|---|---|---|---|---|
| 4140 Lakeside Dr | 0.10mi | 2/2.0 | 1,248 (+4%) | 1mo | $55,000 | $44 | 88 |
| 5505 South Grv #60 | 0.00mi | 2/2.0 | 1,152 (-4%) | 12mo | $125,000 | $109 | 84 |
| 4212 Rockwood St | 0.21mi | 2/2.0 | 1,141 (-5%) | 0mo | $158,600 | $139 | 82 |
| 5505 S Grove St #113 | 0.00mi | 3/2.0 (+1) | 1,164 (-3%) | 15mo | $112,000 | $96 | 77 |
| 4267 Fernwood St | 0.25mi | 2/2.0 | 1,248 (+4%) | 6mo | $130,000 | $104 | 76 |
| 4288 Fernwood St #48 | 0.25mi | 2/2.0 | 1,152 (-4%) | 15mo | $65,000 | $56 | 69 |
| 5505 S Grove St #88 | 0.10mi | 2/2.0 | 1,314 (+10%) | 13mo | $90,000 | $68 | 69 |
| 5505 S Grove St #15 | 0.00mi | 3/2.0 (+1) | 1,293 (+8%) | 20mo | $169,000 | $131 | 66 |
| 4264 Fernwood St #54 | 0.24mi | 3/2.0 (+1) | 1,300 (+8%) | 8mo | $100,000 | $77 | 63 |
| 5505 S Grove St #51 | 0.00mi | 3/2.0 (+1) | 1,380 (+15%) | 10mo | $135,000 | $98 | 62 |
| 4311 Oakwood St | 0.30mi | 2/2.0 | 1,296 (+8%) | 16mo | $115,000 | $89 | 59 |
| 4319 Oakwood St | 0.31mi | 2/2.0 | 1,368 (+14%) | 10mo | $151,000 | $110 | 54 |
Match score weights: distance 35% · size 25% · config 20% · recency 20%. Top-matched comps best support the ARV.
Projected returns pro-forma
-3.0% appreciation · 2.93% rent growth · sell at horizon
- IRR
- 12.9%
- Equity multiple
- 1.51×
- Total profit
- $22,321
- Equity at exit
- $23,111
- IRR
- 21.8%
- Equity multiple
- 2.85×
- Total profit
- $80,161
- Equity at exit
- $13,402
Cash invested: $43,400 (down + closing). Projections, not guarantees.
Landlord ↔ Tenant lean methodology
- Overall (STATE)
- 18 Strongly Tenant-Friendly
- State California
- 18 Strongly Tenant-Friendly · D+13
- County
- — inherits STATE
- City
- — inherits STATE
ZIP-level market 95677
- Rents YoY
- 2.9%
- Active inventory
- 159
- Price-to-rent
- 5.6×
Monthly cashflow live
- Estimated rent
- $2,301 high interval (Pro) →
- Mortgage (P&I)
- −$813
- Tax est. 1.5%
- −$194 /mo · $2,325/yr
- Insurance
- −$65
- HOA
- −$0
- Vacancy / Maint / Mgmt
- −$483
- Net cashflow
- $747
Break-even live
UW: 25.0% down · 7.5% · 30yr · 1.5% tax · 5.0% vac · 8.0% maint · 8.0% mgmt
Financing live
Cash to close
- Down payment
- $38,750
- Closing costs
- $4,650
- Reserves months
- —
- Total cash needed
- —
Loan-product check · same deal, 3 products live
Conventional
25% down · 7.5% · 30yr
- Down + closing
- —
- Monthly P&I
- —
- Monthly cashflow
- —
- DSCR
- —
- Eligible?
- —
Personal DTI + credit; lowest rate.
DSCR
20% down · 8.5% · 30yr
- Down + closing
- —
- Monthly P&I
- —
- Monthly cashflow
- —
- DSCR
- —
- Eligible?
- —
No personal income docs; deal must DSCR.
Hard money
10% down · 12.0% · 12mo
- Down + closing
- —
- Monthly P&I
- —
- Monthly cashflow
- —
- DSCR
- —
- Eligible?
- —
Short-term bridge; refi at stabilization.
Rent comps 16 comps
| Address | Beds | Baths | Sqft | Rent | $/sqft | DOM | Units | Dist |
|---|---|---|---|---|---|---|---|---|
| 5415 S Grove St Rocklin, CA | 1.0–2.0 | 1.0 | 765 | $2,100 | $2.75 | 1d | 6 | 0.08mi |
| 5800 Woodside Dr Rocklin, CA | 1.0–2.0 | 1.0–2.0 | 850 | $2,239 | $2.63 | 3d | 4 | 0.42mi |
| 4769 Racetrack Cir Rocklin, CA | 3.0 | 2.0 | 1148 | $2,950 | $2.57 | 43d | 1 | 0.63mi |
| 6250 Westwood Dr Rocklin, CA | 2.0 | 1.0 | 827 | $1,995 | $2.41 | 23d | 1 | 1.01mi |
| 6260 Westwood Dr Rocklin, CA | 2.0 | 1.0 | 827 | $1,995 | $2.41 | 22d | 1 | 1.02mi |
| 6260 Westwood Dr Rocklin, CA | 2.0 | 1.0 | 828 | $1,995 | $2.41 | 12d | 1 | 1.02mi |
| 3041 Twin Creeks Ln Rocklin, CA | 3.0 | 2.0 | 986 | $2,695 | $2.73 | 23d | 1 | 1.27mi |
| 5902 Springview Dr Rocklin, CA | 2.0 | 2.0 | 840 | $2,099 | $2.50 | 14d | 1 | 1.28mi |
| 5902 Springview Dr Rocklin, CA | 2.0 | 2.0 | 840 | $2,199 | $2.62 | 23d | 1 | 1.28mi |
| 5051 El Don Dr Rocklin, CA | 2.0 | 2.0 | 1125 | $2,270 | $2.02 | 1d | 7 | 1.31mi |
| 1501 Cobble Creek Cir Rocklin, CA | 1.0–2.0 | 1.0–2.0 | 881 | $2,300 | $2.61 | 1d | 7 | 1.32mi |
| 5953 Springview Dr Rocklin, CA | 2.0 | 1.5–2.0 | 840 | $2,083 | $2.48 | 3d | 6 | 1.35mi |
| 6115 Brookside Cir Rocklin, CA | 3.0 | 3.0 | 1150 | $2,814 | $2.45 | 23d | 1 | 1.42mi |
| 6115 Brookside Cir Rocklin, CA | 3.0 | 3.0 | 1150 | $2,783 | $2.42 | 2d | 1 | 1.42mi |
| 6115 Brookside Cir Rocklin, CA | 2.0 | 3.0 | 1102 | $2,706 | $2.46 | 4d | 1 | 1.42mi |
| 5180 Rocklin Rd Rocklin, CA | 1.0–2.0 | 1.0–2.0 | 857 | $2,552 | $2.98 | 1d | 9 | 1.44mi |
Listing history 13 events
-
2026-06-17days on market $155,000 Active 149 DOM
-
2026-06-16days on market $155,000 Active 148 DOM
-
2026-06-15days on market $155,000 Active 147 DOM
-
2026-06-13days on market $155,000 Active 145 DOM
-
2026-06-13days on market $155,000 Active 144 DOM
-
2026-06-09days on market $155,000 Active 141 DOM
-
2026-06-08days on market $155,000 Active 140 DOM
-
2026-06-07days on market $155,000 Active 139 DOM
-
2026-06-05days on market $155,000 Active 136 DOM
-
2026-06-03days on market $155,000 Active 135 DOM
-
2026-06-02days on market $155,000 Active 134 DOM
-
2026-06-01days on market $155,000 Active 133 DOM
-
2026-05-31days on market $155,000 Active 132 DOM
ⓘ Source: listings_history table (triggers on properties + properties_extension) + one-shot
backfill from property_details.listing_events for pre-trigger history.
Climate risk First Street
- Flood 1/10 Low FEMA zone X (unshaded) · 0% chance over 30 yrs
- Wildfire 8/10 Severe
- Heat 7/10 Severe 7 d/yr ≥104°F today · 16 d/yr by 30 yrs out
- Wind 1/10 Low
- Air quality 10/10 Extreme 32 unhealthy d/yr today · 38 by 30 yrs out
Nearby sold comps map
Loading sold comps map…
Walkable amenities ~0.75 mi
Loading nearby amenities…
Taxation est. · year 1
- Rental income
- $27,615
- − Mortgage interest
- −$8,682
- − Property taxes
- −$2,325
- − Insurance
- −$775
- − Repairs & maintenance
- −$2,209
- − Management
- −$2,209
- − Depreciation
- −$4,509
- Taxable income
- $6,905
- Est. tax owed @ 24.0%
- −$1,657
- After-tax cash flow
- $7,305/yr
For passive investors: Depreciation is non-cash, so a rental often shows a tax loss while cash-flowing — sheltering income. Rental losses are passive: they offset passive income freely, and up to $25,000/yr can offset ordinary (W-2) income if you actively participate and your MAGI is under $100k (phasing out to $0 by $150k); unused losses carry forward. On sale, claimed depreciation is recaptured at up to 25%, and gains may owe capital-gains tax (a 1031 exchange can defer both). Figures are a year-1 estimate at your 24.0% rate — not tax advice; consult a CPA.
Schools (NCES district)
- District
- Rocklin Unified
- NCES district ID
- 0600013
- Math proficiency
- 44% ▼ -19.00%
- Reading proficiency
- 65% ▼ -6.00%
- Median HH income
- $82,858
- Composite
- 49.58/100
- National rank
- #1984
- State rank
- #96 of 517 in CA
Livability — Rocklin
- Score
- 74/100
- State rank
- #136
- US rank
- #4755
Category grades
Schools grade is shown separately in the Schools card above.
Census & demographics
- Census place
- Rocklin, CA
- County
- Placer County · 390,510 people
- City population
- 73,077
- Metro
- Sacramento-Roseville-Folsom, CA
- Population (ZIP)
- 29,206
- Household income
- $105,713
- Rent vs Own
- Severe rent burden
- 1107.0
Population outlook (Placer County) Hauer SSP2
- Today (2025)
- 422,709 people
- By 2030
- 444,249 · +5.1%
- By 2040
- 480,192 · +13.6%
- By 2050
- 506,390 · +19.8%
- By 2075
- 550,219 · +30.2%
- By 2100
- 547,760 · +29.6%
Race, ethnicity, and origin ACS 2023
- Neighborhood character
- Predominantly White (67%)
- Race & ethnicity
- White 67% Hispanic / Latino 15% Two or more races 15% Asian 7% Black 1%
- Hispanic origin (detail)
- Mexican 10%
- Common ancestry
- Italian 3% Slovak 3% Lithuanian 2%
- Foreign-born
- 10% · Canada, China, South Korea
- Languages at home
- 86% English-only · Spanish 5% Other Indo-European 2% Russian/Polish/Slavic 2%
Political lean MEDSL · Placer
- 2024 margin
- Lean R (+8.5) · D 44.3% · R 52.8% · Other 2.9%
- 2008→2024 swing
- +2.8pp toward D · 2008: -11.3pp · 2024: -8.5pp
- All cycles
- 2024: R+8.5 2020: R+6.7 2016: R+11.3 2012: R+20.1 2008: R+11.3
Not yet ingested
- Civics
- —
Market trends
- HPI YoY
- ▼ -443.08%
- Current HPI
- 278.1359
- Rent YoY
- ▲ 2.93%
- Metro
- Sacramento-Roseville-Folsom, CA
- State GDP YoY
- ▲ 3.21%
- F500 in state
- 116
Industry mix (Fortune 500 HQ in CA)
| Industry | F500 HQs | Revenue |
|---|---|---|
| Technology | 27 | $1,492B |
|
||
| Financial Services | 3 | $174B |
|
||
| Retail | 3 | $44B |
|
||
| Insurance | 3 | $26B |
|
||
| Media / Entertainment | 2 | $115B |
|
||
| Pharmaceuticals / Biotech | 2 | $62B |
|
||
Cash-flow waterfall
monthlySold comps — $/sqft
last 12 mo · ≤1 miLoading sold comps…