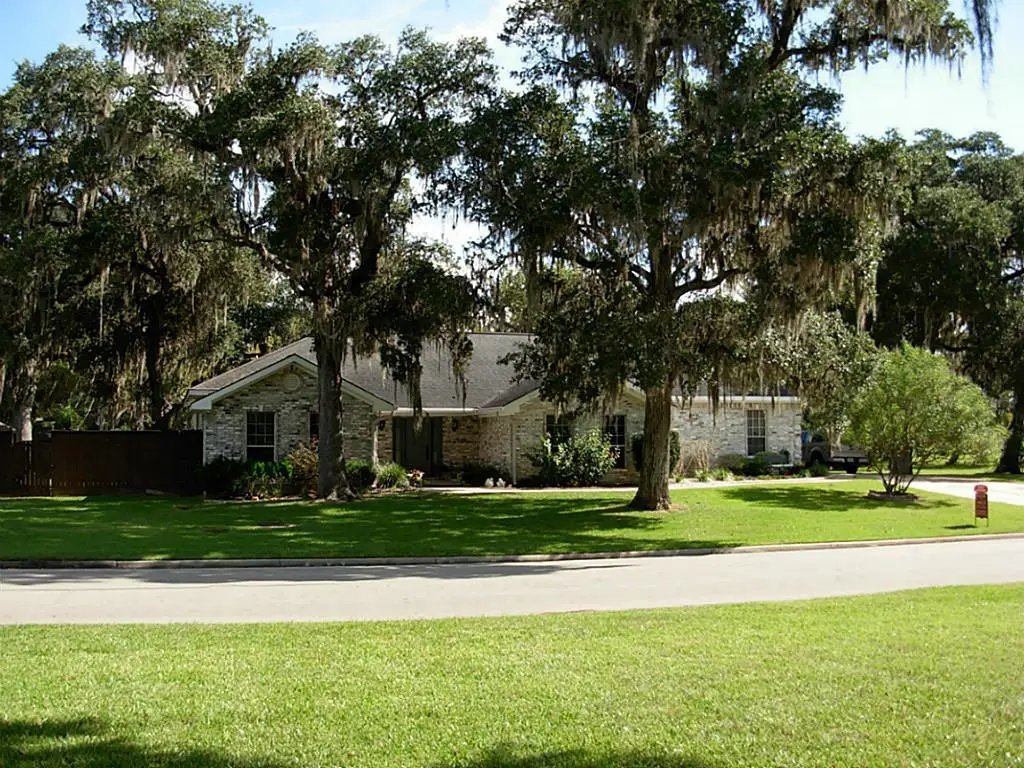
2225 Ridgewood Dr · West Columbia, TX
Flood risk 6/10 · Moderate
- FEMA flood zone
- X
- Chance of flooding over 30 yrs
- 0.71%
- Est. flood insurance / yr
- $507 – $1,088
Fire risk 1/10 · Minimal
- Est. fire insurance / yr
- $1,222 – $2,270
Heat risk 9/10 · Severe
- Hot days now (above 110°F)
- 7 days/yr
- Hot days in 30 yrs
- 25 days/yr
Wind risk 9/10 · Severe
- Chance of severe wind over 30 yrs
- 99.0%
Air-quality risk 2/10 · Minimal
- Unhealthy air days now
- 2 days/yr
- Unhealthy air days in 30 yrs
- 2 days/yr
Risk factors via First Street. Map © Google.
Why this score? — see what drove the C- grade
The composite is a weighted blend of 9 inputs, each scored 0–100. Each bar is that input's sub-score; the figure is the points it added to the 100-point composite (weight × sub-score).
- Cash flow +12.9/30.0
- ARV discount +12.9/15.0
- Appreciation +8.8/10.0
- 1% rule +4.5/10.0
- DSCR +3.9/10.0
- Livability +3.5/5.0
- Schools +3.0/10.0
- Rent growth +2.5/5.0
- Condition / age +2.5/5.0
$285,000
🖨 Deal sheet 📄 Offer letter ✓ Due diligence
Key facts
- 0.5 acre lot
- 2 garage spots
- Built 1996
Neighborhood map
What this means for you Summary
Snapshot
- This is a 4-bed/4.0-bath single-family listed at $285k.
Deal economics
- At list price, monthly cash flow is $-19 ($-229/yr) — negative.
- To cash-flow at today's rent, offer at most $282k (1.2% below list).
- To meet the 1% rule (rent ≥ 1% of price), the offer needs to be $270k (5.3% below list).
- Recommended offer: $270k (5.3% below list) — sets the bar for 1% rule.
- Cap rate 6.2% vs local median 4.4% in West Columbia — top-decile yield for the area; either an underpriced asset or a hidden risk that comps aren't pricing in. Stress-test before assuming the spread holds.
Location & tenants
- Location reads 70/100 on livability (#375 in TX) — a middle-class / working-renter tenant base. Strengths: cost of living A+, housing A+, health & safety B+; Watch: schools D, amenities F, commute F.
- Columbia-Brazoria ISD (town): math 35% / reading 33% proficiency, ranked #513 of 826 in TX (top 62%) — families likely to look elsewhere, expect single-tenant / working-renter base with shorter leases.
- Market conditions: 145 active listings in the ZIP; 1 comparable units currently listed for rent nearby; 3,960 units permitted in Brazoria County in 2024 (593 in 5+ unit buildings).
Forward outlook
- In year one you build about $24k of equity ($2k loan paydown + $22k appreciation (7.6% local appreciation)).
- Brazoria County population projected at +44% by 2050 — long-run rental-demand tailwind backs the buy-and-hold thesis.
- At projected returns (7.6% appreciation + 3.0% rent growth), your $80k cash investment doubles in ~4 years — after that, you're playing with house money.
- By year 2, paydown + projected appreciation supports a ~$38k cash-out refi (75% LTV) — recoverable capital for the next deal without selling this one.
Negotiation context
- It's been on market 20 days — a 2% lower offer ($281k) is reasonable based on typical stale-listing flexibility.
- 5 sale attempts since 13y ago; this cycle's ask has dropped $30k (10%) from the opening price — seller is motivated, your offer sets the floor, not the list.
Risks & watch-outs
- Climate carrying-cost: major flood risk; severe wind risk, 99% chance of damaging wind over 30y; extreme-heat days projected 7→25/yr by 2055 (HVAC capex compounding) — expect insurance premiums to compound above CPI over the hold.
Questions for the listing agent
- What do current leases actually rent for vs. the listed asking? Can we see a recent rent roll and the last 12 months of T-12 income?
- Is there a deadline driving the sale (1031 exchange, divorce, estate, relocation)? That informs how much negotiation room exists.
- Schools are D-rated, which usually means shorter tenancies and higher turnover. Who's the typical renter profile here, and what's been the actual vacancy rate?
- What's the average days-on-market for RENTAL listings here right now (not sales)? A rising rental-DOM trend means longer vacancies and softer asking-rent achievability than the comps imply.
- What's the recent tenant-quality profile in this submarket — average credit score on applications, eviction rate, late-payment / NSF rate, and stable-employment percentage? A property-management company in the area should have these aggregated.
- How much new for-sale + rental construction is in the pipeline within 1–3 miles? Heavy new supply typically softens prices + rents 12–24 months out; constrained supply supports both.
Investment metrics
- 1% rule
- 0.95% ✗
- Cap rate
- 6.21%
- Cash-on-cash
- -0.29%
- DSCR
- 0.99
- GRM
- 8.8
CMA / ARV
- ARV (median comp)
- $323,575
- List price
- $285,000
- Delta
- -11.92%
- Verdict
- UNDERPRICED
- Comps
- 20 within 1.0 mi
Show comp detail 12 sales within ~0.75 mi
| Address | Dist | Beds/Ba | Sqft | Sold | Price | $/sf | Match |
|---|---|---|---|---|---|---|---|
| 359 Twin Lakes Blvd | 0.15mi | 4/2.5 | 2,507 (+6%) | 4mo | $332,339 | $133 | 74 |
| 2319 Ridgewood Dr | 0.27mi | 4/2.5 | 2,513 (+6%) | 3mo | $378,939 | $151 | 69 |
| 297 Twin Lakes Blvd W | 0.28mi | 4/2.5 | 2,513 (+6%) | 4mo | $348,000 | $138 | 68 |
| 213 N Amherst Dr | 0.49mi | 4/2.5 | 2,342 (-1%) | 2mo | $369,500 | $158 | 67 |
| 453 Twin Lakes Blvd W | 0.21mi | 4/3.5 | 2,635 (+11%) | 5mo | $339,900 | $129 | 66 |
| 208 S Amherst Dr | 0.48mi | 4/3.0 | 2,507 (+6%) | 4mo | $310,939 | $124 | 61 |
| 213 Woodhaven | 0.43mi | 4/2.5 | 2,219 (-6%) | 3mo | $369,990 | $167 | 61 |
| 215 Freeman Blvd | 0.48mi | 4/2.5 | 2,556 (+8%) | 1mo | $345,000 | $135 | 58 |
| 417 N Amherst Dr | 0.48mi | 4/3.0 | 2,161 (-9%) | 6mo | $359,000 | $166 | 54 |
| 2523 Turberry Dr | 0.64mi | 4/2.5 | 2,258 (-5%) | 6mo | $349,000 | $155 | 51 |
| 332 N Amherst Dr | 0.37mi | 3/2.0 (-1) | 2,615 (+10%) | 4mo | $370,000 | $141 | 49 |
| 2571 Pinehurst Dr | 0.61mi | 3/2.0 (-1) | 2,019 (-15%) | 1mo | $249,000 | $123 | 33 |
Match score weights: distance 35% · size 25% · config 20% · recency 20%. Top-matched comps best support the ARV.
Projected returns pro-forma
7.63% appreciation · 3.0% rent growth · sell at horizon
- IRR
- 19.0%
- Equity multiple
- 2.37×
- Total profit
- $109,615
- Equity at exit
- $209,369
- IRR
- 17.9%
- Equity multiple
- 5.00×
- Total profit
- $319,163
- Equity at exit
- $408,951
Cash invested: $79,800 (down + closing). Projections, not guarantees.
Landlord ↔ Tenant lean methodology
- Overall (STATE)
- 87 Strongly Landlord-Friendly
- State Texas
- 87 Strongly Landlord-Friendly · R+5
- County
- — inherits STATE
- City
- — inherits STATE
ZIP-level market 77486
- Home prices YoY
- 2.4%
- Active inventory
- 145
- Price-to-rent
- 8.8×
Monthly cashflow live
- Estimated rent
- $2,700 medium interval (Pro) →
- Mortgage (P&I)
- −$1,495
- Tax from tax record
- −$539 /mo · $6,466/yr
- Insurance
- −$119
- HOA
- −$0
- Vacancy / Maint / Mgmt
- −$567
- Net cashflow
- $-19
Break-even live
UW: 25.0% down · 7.5% · 30yr · 1.5% tax · 5.0% vac · 8.0% maint · 8.0% mgmt
Financing live
Cash to close
- Down payment
- $71,250
- Closing costs
- $8,550
- Reserves months
- —
- Total cash needed
- —
Loan-product check · same deal, 3 products live
Conventional
25% down · 7.5% · 30yr
- Down + closing
- —
- Monthly P&I
- —
- Monthly cashflow
- —
- DSCR
- —
- Eligible?
- —
Personal DTI + credit; lowest rate.
DSCR
20% down · 8.5% · 30yr
- Down + closing
- —
- Monthly P&I
- —
- Monthly cashflow
- —
- DSCR
- —
- Eligible?
- —
No personal income docs; deal must DSCR.
Hard money
10% down · 12.0% · 12mo
- Down + closing
- —
- Monthly P&I
- —
- Monthly cashflow
- —
- DSCR
- —
- Eligible?
- —
Short-term bridge; refi at stabilization.
Rent comps 1 comps
| Address | Beds | Baths | Sqft | Rent | $/sqft | DOM | Units | Dist |
|---|---|---|---|---|---|---|---|---|
| 2363 Ridgewood Dr West Columbia, TX | 4.0 | 2.5 | 2555 | $2,700 | $1.06 | 24d | 1 | 0.47mi |
Listing history 22 events
-
2026-05-07status Active
-
2026-04-16historical
-
2026-04-16historical $285,000
-
2026-03-17historical
-
2026-03-06price $292,000
-
2026-02-26price $294,000
-
2026-02-19price $297,000
-
2026-02-12price $300,000
-
2026-02-04price $305,000
-
2026-01-28price $309,000
-
2026-01-14$315,000 Active
-
2016-12-01soldstatus
-
2016-11-30soldstatus Sold
-
2016-11-05status Pending
-
2016-10-25status Option Pending
-
2016-10-18$249,000 Active
-
2013-08-09historical
-
2013-08-08soldstatus
-
2013-08-07soldstatus
-
2013-08-07soldstatus
-
2013-03-04$204,900
-
2013-03-04$204,900
ⓘ Source: listings_history table (triggers on properties + properties_extension) + one-shot
backfill from property_details.listing_events for pre-trigger history.
Tax reassessment forecast TX · Resets to sale price
- Current annual tax
- $6,466 · $539/mo
- Projected year-2 tax
- $6,466 · $539/mo
- Expected delta
- $0/yr ($0/mo · 0.0%)
ⓘ Screening estimate from a state-policy table — verify with the county assessor before closing.
Climate risk First Street
- Flood 6/10 Major FEMA zone X · 71% chance over 30 yrs
- Wildfire 1/10 Low
- Heat 9/10 Extreme 7 d/yr ≥110°F today · 25 d/yr by 30 yrs out
- Wind 9/10 Extreme 99% chance of damaging wind over 30 yrs
- Air quality 2/10 Low 2 unhealthy d/yr today · 2 by 30 yrs out
Nearby sold comps map
Loading sold comps map…
Walkable amenities ~0.75 mi
Loading nearby amenities…
Taxation est. · year 1
- Rental income
- $32,400
- − Mortgage interest
- −$15,964
- − Property taxes
- −$6,466
- − Insurance
- −$1,425
- − Repairs & maintenance
- −$2,592
- − Management
- −$2,592
- − Depreciation
- −$8,291
- Taxable loss
- −$4,930
- Est. tax savings @ 24.0%
- +$1,183
- After-tax cash flow
- $954/yr
For passive investors: Depreciation is non-cash, so a rental often shows a tax loss while cash-flowing — sheltering income. Rental losses are passive: they offset passive income freely, and up to $25,000/yr can offset ordinary (W-2) income if you actively participate and your MAGI is under $100k (phasing out to $0 by $150k); unused losses carry forward. On sale, claimed depreciation is recaptured at up to 25%, and gains may owe capital-gains tax (a 1031 exchange can defer both). Figures are a year-1 estimate at your 24.0% rate — not tax advice; consult a CPA.
Schools (NCES district)
- District
- Columbia-Brazoria ISD
- NCES district ID
- 4814670
- Math proficiency
- 35% ▼ -4.00%
- Reading proficiency
- 33% ▼ -1.00%
- Median HH income
- $57,256
- Composite
- 30.23/100
- National rank
- #6297
- State rank
- #513 of 826 in TX
Livability — West Columbia
- Score
- 70/100
- State rank
- #375
- US rank
- #7954
Category grades
Schools grade is shown separately in the Schools card above.
Census & demographics
- Population (ZIP)
- 7,330
Population outlook (Brazoria County) Hauer SSP2
- Today (2025)
- 420,414 people
- By 2030
- 457,585 · +8.8%
- By 2040
- 532,232 · +26.6%
- By 2050
- 605,399 · +44.0%
- By 2075
- 779,358 · +85.4%
- By 2100
- 883,759 · +110.2%
Race, ethnicity, and origin ACS 2023
- Neighborhood character
- Majority White (61%)
- Race & ethnicity
- White 61% Hispanic / Latino 27% Two or more races 13% Black 10% Native American 1%
- Hispanic origin (detail)
- Mexican 23%
- Common ancestry
- Italian 5% Slovak 3% Lithuanian 2%
- Foreign-born
- 5% · Canada
- Languages at home
- 86% English-only · Spanish 12% German/W. Germanic 1%
Political lean MEDSL · Brazoria
- 2024 margin
- R (+19.7) · D 39.5% · R 59.2% · Other 1.3%
- 2008→2024 swing
- +9.9pp toward D · 2008: -29.6pp · 2024: -19.7pp
- All cycles
- 2024: R+19.7 2020: R+18.2 2016: R+24.6 2012: R+34.2 2008: R+29.6
Not yet ingested
- Civics
- —
Market trends
- HPI YoY
- ▲ 7.63%
- Current HPI
- 320.7967
- Rent YoY
- —
- Metro
- —
- State GDP YoY
- ▲ 3.95%
- F500 in state
- 110
Industry mix (Fortune 500 HQ in TX)
| Industry | F500 HQs | Revenue |
|---|---|---|
| Energy | 16 | $1,198B |
|
||
| Technology | 5 | $198B |
|
||
| Engineering / Construction | 4 | $72B |
|
||
| Energy Services | 3 | $60B |
|
||
| Utilities | 3 | $41B |
|
||
| Healthcare | 2 | $330B |
|
||
Price history
+39.1% since first listed22 events — show timeline
- 2026-05-07 Relisted — HARMLS
- 2026-04-16 Listing Removed — HARMLS
- 2026-04-16 Coming Soon $285,000 HARMLS
- 2026-03-17 Listing Removed — HARMLS
- 2026-03-06 Price Changed $292,000 HARMLS
- 2026-02-26 Price Changed $294,000 HARMLS
- 2026-02-19 Price Changed $297,000 HARMLS
- 2026-02-12 Price Changed $300,000 HARMLS
- 2026-02-04 Price Changed $305,000 HARMLS
- 2026-01-28 Price Changed $309,000 HARMLS
- 2026-01-14 Listed $315,000 HARMLS
- 2016-12-01 Sold (Public Records) — Public Records
- 2016-11-30 Sold (MLS) — HARMLS
- 2016-11-05 Pending — HARMLS
- 2016-10-25 Pending — HARMLS
- 2016-10-18 Listed $249,000 HARMLS
- 2013-08-09 Listing Removed — HARMLS
- 2013-08-08 Sold (Public Records) — Public Records
- 2013-08-07 Sold (MLS) — BCBR
- 2013-08-07 Sold (MLS) — HARMLS
- 2013-03-04 Listed $204,900 BCBR
- 2013-03-04 Listed $204,900 HARMLS
Property tax history
+1.6%/yrLatest (2025): $6,466 · -4.9% YoY. Source: county tax records.
Cash-flow waterfall
monthlySold comps — $/sqft
last 12 mo · ≤1 miLoading sold comps…