 5-Plex
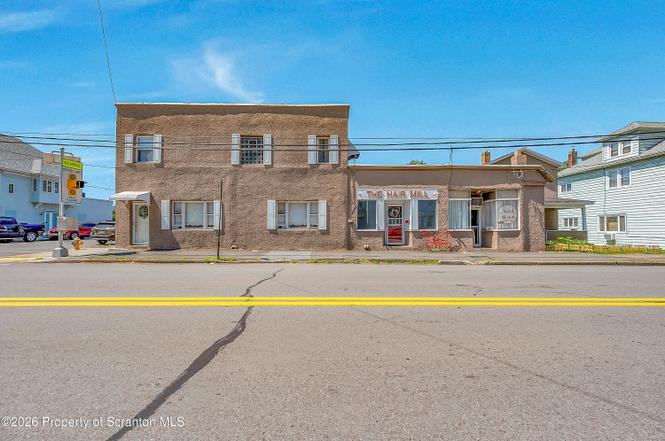
400 Oak St St #408 · Old Forge, PA
Flood risk No data
- FEMA flood zone
- —
- Chance of flooding over 30 yrs
- —
- Est. flood insurance / yr
- —
Fire risk No data
- Est. fire insurance / yr
- —
Heat risk No data
- Hot days now (above threshold)
- —
- Hot days in 30 yrs
- —
Wind risk No data
- Chance of severe wind over 30 yrs
- —
Air-quality risk No data
- Unhealthy air days now
- —
- Unhealthy air days in 30 yrs
- —
Risk factors via First Street. Map © Google.
Why this score? — see what drove the B+ grade
The composite is a weighted blend of 9 inputs, each scored 0–100. Each bar is that input's sub-score; the figure is the points it added to the 100-point composite (weight × sub-score).
- Cash flow +30.0/30.0
- 1% rule +10.0/10.0
- DSCR +10.0/10.0
- Appreciation +7.6/10.0
- ARV discount +7.5/15.0
- Livability +3.9/5.0
- Schools +3.1/10.0
- Rent growth +2.5/5.0
- Condition / age +2.2/5.0
$399,000
🖨 Deal sheet (PDF) 📄 Offer letter ✓ Due diligence
Multi-family units
County records classify this as Multi-Family (5+ Unit). Listing-text estimate: 5 units. confirmed
5+ unit building — per-unit beds/baths from public records are typically unavailable; the breakdown below (if shown) is an estimate from the listing text.
Listing remarks
Premier Mixed-Use Investment Opportunity in the Heart of Old Forge!Attention investors, this is the opportunity you've been waiting for! Situated on a highly visible corner lot in one of Old Forge's most desirable locations, this massive 5-unit mixed-use property offers the perfect combination of cash flow, stability, and upside potential. The property features 3 spacious residential units and 2 commercial hair salon spaces, creating multiple streams of income in a prime, walkable location. Just steps from Old Forge's renowned restaurants, local businesses, and Old Forge High School, this asset benefits from strong tenant demand and exceptional community appeal. Meticulously maintained by t
Key facts
- Separate utilities
- Prime location
- 0.25 acre lot
Tags
Property features AI
Finance
- Financial info: Five-unit property (total of 5 units)
- HOA & community: Neighborhood features include curbs, sidewalks and street lights
Exterior
- Parking: 2 garage spaces; On-street parking available
- Utilities: Public water; Public sewer; 200+ amp electric service with circuit breakers
- Home design: Mixed-use property used as residential income (multi-family); Two levels with multi/split configuration; Corner city lot with paved road frontage
- Construction: Built in 1965; Block and stucco construction; Foundation of block, stone and combination; Roof materials include shingle, flat and rubber
- Exterior features: Courtyard; Private yard; Rain gutters; Front and rear porches and patio; Back yard fencing (vinyl)
Interior
- Kitchen: Kitchens in Units 1, 2 and 5; eat-in kitchen(s)
- Bedrooms: 8 total bedrooms across units (unit breakdown below): Unit 1 — 3 bedrooms; Unit 2 — 2 bedrooms; Unit 5 — 3 bedrooms
- Flooring: Combination of hardwood, carpet, luxury vinyl and laminate flooring
- Bathrooms: 5 total bathrooms (3 full, 2 half)
- Heating & cooling: Central air; Ceiling fans; Wall/window units; Heating varies by unit — baseboard, steam, hot water, forced air
- Interior features: Ceiling fans; Natural woodwork; Recessed lighting; Eat-in kitchen; Double vanity; Crown molding; In-unit laundry; Has basement with exterior and interior entry, walk-out access; unfinished, full basement
- Laundry & utility: Laundry located in-unit
Neighborhood map
What this means for you Summary
Snapshot
- This is a 5 × 8-bed/4.0-bath units multifamily listed at $399k. Condition is rated fair.
Deal economics
- At list price, monthly cash flow is $4k ($48k/yr) — positive. Per door: $803/mo.
- The deal already cash-flows at list — no discount required.
- Meets the 1% rule at list price ($9k rent vs $399k).
- Cap rate 18.4% vs local median 6.1% in Old Forge — top-decile yield for the area; either an underpriced asset or a hidden risk that comps aren't pricing in. Stress-test before assuming the spread holds.
Location & tenants
- Location reads 78/100 on livability (#287 in PA, #2,531 nationally) — a middle-class / working-renter tenant base. Strengths: crime A+, cost of living A+, housing A+; Watch: employment C-, amenities F, commute F.
- Old Forge SD (suburban): math 22% / reading 49% proficiency, ranked #409 of 539 in PA (top 76%) — families likely to look elsewhere, expect single-tenant / working-renter base with shorter leases.
- Market conditions: 39 active listings in the ZIP; 251 units permitted in Lackawanna County in 2024 (0 in 5+ unit buildings).
Forward outlook
- In year one you build about $23k of equity ($3k loan paydown + $21k appreciation (5.2% local appreciation)).
- Lackawanna County population projected to shrink 4% by 2050 — rents likely to lag national; underwrite the cash flow, not the appreciation.
- At projected returns (5.2% appreciation + 3.0% rent growth), your $112k cash investment doubles in ~2 years — after that, you're playing with house money.
- By year 2, paydown + projected appreciation supports a ~$37k cash-out refi (75% LTV) — recoverable capital for the next deal without selling this one.
Negotiation context
- Only 8 days on market — expect competitive offers; lowballing is unlikely to land.
Questions for the listing agent
- Can we see the unit-by-unit rent roll, current vacancy, and any below-market leases? What's the average tenancy length?
- What capital expenditures (roof, boiler, parking lot, exteriors) have been made in the last 5 years, and what's planned in the next 2?
- Have any recent inspections been done? Can we get a copy of the seller's disclosures and any deferred-maintenance estimates?
- Built in 1965 — when were the roof, HVAC, electrical panel, plumbing, and water heater last replaced?
- Is there a deadline driving the sale (1031 exchange, divorce, estate, relocation)? That informs how much negotiation room exists.
- Schools are B-rated — typically a magnet for longer-tenancy family renters. What's the average tenant stay here, and is there a school-zone premium baked into asking?
- What's the average days-on-market for RENTAL listings here right now (not sales)? A rising rental-DOM trend means longer vacancies and softer asking-rent achievability than the comps imply.
- What's the recent tenant-quality profile in this submarket — average credit score on applications, eviction rate, late-payment / NSF rate, and stable-employment percentage? A property-management company in the area should have these aggregated.
- How much new apartment / multifamily construction is in the pipeline within 1–3 miles? Heavy new supply (>2% of stock underway) typically softens rents 12–24 months out; light construction supports rent growth.
Investment metrics
- 1% rule
- 2.15% ✓
- Cap rate
- 18.37%
- Cash-on-cash
- 43.14%
- DSCR
- 2.92
- GRM
- 3.9
CMA / ARV
No comps found within radius.
Projected returns pro-forma
5.15% appreciation · 3.0% rent growth · sell at horizon
- IRR
- 51.4%
- Equity multiple
- 4.14×
- Total profit
- $351,218
- Equity at exit
- $229,661
- IRR
- 49.1%
- Equity multiple
- 8.51×
- Total profit
- $839,379
- Equity at exit
- $399,333
Cash invested: $111,720 (down + closing). Projections, not guarantees.
Landlord ↔ Tenant lean methodology
- Overall (STATE)
- 62 Landlord-Friendly
- State Pennsylvania
- 62 Landlord-Friendly · EVEN
- County
- — inherits STATE
- City
- — inherits STATE
ZIP-level market 18518
- Home prices YoY
- 2.2%
- Active inventory
- 39
- Price-to-rent
- 19.4×
Monthly cashflow live
- Estimated rent
- $8,574 medium interval (Pro) →
- Mortgage (P&I)
- −$2,092
- Tax est. 1.5%
- −$499 /mo · $5,985/yr
- Insurance
- −$166
- HOA
- −$0
- Vacancy / Maint / Mgmt
- −$1,801
- Net cashflow
- $4,016
Break-even live
Sensitivity live
| Price | -10% $4,292 | -5% $4,154 | +0% $4,016 | +5% $3,878 | +10% $3,740 |
|---|---|---|---|---|---|
| Rent | -10% $3,339 | -5% $3,677 | +0% $4,016 | +5% $4,355 | +10% $4,693 |
| Rate | -1.0pp $4,217 | -0.5pp $4,118 | base $4,016 | +0.5pp $3,913 | +1.0pp $3,807 |
5-unit breakdown (identical units grouped — click to expand)
| Units | Beds | Baths | Est. rent |
|---|---|---|---|
| 5× units | 8 | 4 | $8,575 |
| #1 | 8 | 4 | $1,715 |
| #2 | 8 | 4 | $1,715 |
| #3 | 8 | 4 | $1,715 |
| #4 | 8 | 4 | $1,715 |
| #5 | 8 | 4 | $1,715 |
| Total (5 units) | $8,574 | ||
UW: 25.0% down · 7.5% · 30yr · 1.5% tax · 5.0% vac · 8.0% maint · 8.0% mgmt
Financing live
Cash to close
- Down payment
- $99,750
- Closing costs
- $11,970
- Reserves months
- —
- Total cash needed
- —
Loan-product check · same deal, 3 products live
Conventional
25% down · 7.5% · 30yr
- Down + closing
- —
- Monthly P&I
- —
- Monthly cashflow
- —
- DSCR
- —
- Eligible?
- —
Personal DTI + credit; lowest rate.
DSCR
20% down · 8.5% · 30yr
- Down + closing
- —
- Monthly P&I
- —
- Monthly cashflow
- —
- DSCR
- —
- Eligible?
- —
No personal income docs; deal must DSCR.
Hard money
10% down · 12.0% · 12mo
- Down + closing
- —
- Monthly P&I
- —
- Monthly cashflow
- —
- DSCR
- —
- Eligible?
- —
Short-term bridge; refi at stabilization.
Listing history 7 events
-
2026-06-18days on market $399,000 Active 8 DOM
-
2026-06-17days on market $399,000 Active 7 DOM
-
2026-06-16days on market $399,000 Active 6 DOM
-
2026-06-15days on market $399,000 Active 5 DOM
-
2026-06-14days on market $399,000 Active 3 DOM
-
2026-06-13remarks 699-char remark
-
2026-06-13$399,000 Active 2 DOM
ⓘ Source: listings_history table (triggers on properties + properties_extension) + one-shot
backfill from property_details.listing_events for pre-trigger history.
Nearby sold comps map
Loading sold comps map…
Walkable amenities ~0.75 mi
Loading nearby amenities…
Taxation est. · year 1
- Rental income
- $102,888
- − Mortgage interest
- −$22,350
- − Property taxes
- −$5,985
- − Insurance
- −$1,995
- − Repairs & maintenance
- −$8,231
- − Management
- −$8,231
- − Depreciation
- −$11,607
- Taxable income
- $44,488
- Est. tax owed @ 24.0%
- −$10,677
- After-tax cash flow
- $37,516/yr
For passive investors: Depreciation is non-cash, so a rental often shows a tax loss while cash-flowing — sheltering income. Rental losses are passive: they offset passive income freely, and up to $25,000/yr can offset ordinary (W-2) income if you actively participate and your MAGI is under $100k (phasing out to $0 by $150k); unused losses carry forward. On sale, claimed depreciation is recaptured at up to 25%, and gains may owe capital-gains tax (a 1031 exchange can defer both). Figures are a year-1 estimate at your 24.0% rate — not tax advice; consult a CPA.
Condition & rehab AI · 12 photos
This 5-unit mixed-use property requires moderate renovations to improve its condition and increase its value. Key areas for improvement include updating the kitchen and bathrooms, painting the exterior, and replacing dated fixtures.
Repairs flagged
- Moderate kitchen cabinets — Cabinets appear worn and need updating
- Moderate bathroom fixtures — Fixtures need updating for a more modern look
- Moderate exterior siding — Siding needs repainting or replacement
Value-add opportunities
- Both Paint and update kitchen cabinets — Fresh paint and updated cabinets will improve both resale and rental value
- Both Replace dated bathroom fixtures — Modern fixtures will attract more tenants and buyers
- Both Paint exterior siding — Fresh paint will improve curb appeal and property value
Renovation cost estimate screening
| Repair item | Severity | Est. cost |
|---|---|---|
| kitchen cabinets · Cabinets appear worn and need updating | Moderate | $3,000–15,000 |
| bathroom fixtures · Fixtures need updating for a more modern look | Moderate | $3,000–15,000 |
| exterior siding · Siding needs repainting or replacement | Moderate | $3,000–15,000 |
| Total estimated repair cost · 3 items | $9,000–45,000 |
Value-add ROI direction
- Both Paint and update kitchen cabinets — Fresh paint and updated cabinets will improve both resale and rental value ↑
- Both Replace dated bathroom fixtures — Modern fixtures will attract more tenants and buyers ↑
- Both Paint exterior siding — Fresh paint will improve curb appeal and property value ↑
ⓘ Cost ranges are severity-bucket heuristics (US national rule-of-thumb). Get contractor quotes + a written scope before underwriting a rehab budget.
Schools (NCES district)
- District
- Old Forge SD
- NCES district ID
- 4218120
- Math proficiency
- 22% ▼ -19.00%
- Reading proficiency
- 49% ▼ -17.00%
- Median HH income
- $49,409
- Composite
- 30.6/100
- National rank
- #6196
- State rank
- #409 of 539 in PA
Livability — Old Forge
- Score
- 78/100
- State rank
- #287
- US rank
- #2531
Category grades
Schools grade is shown separately in the Schools card above.
Census & demographics
- Census place
- Old Forge, PA
- City population
- 8,533
- Population (ZIP)
- 8,533
Population outlook (Lackawanna County) Hauer SSP2
- Today (2025)
- 210,652 people
- By 2030
- 208,623 · -1.0%
- By 2040
- 203,980 · -3.2%
- By 2050
- 201,069 · -4.5%
- By 2075
- 205,026 · -2.7%
- By 2100
- 210,851 · +0.1%
Race, ethnicity, and origin ACS 2023
- Neighborhood character
- Predominantly White (84%)
- Race & ethnicity
- White 84% Two or more races 13% Hispanic / Latino 9% Asian 1%
- Hispanic origin (detail)
- Puerto Rican 9%
- Common ancestry
- Romanian 17% Scotch-Irish 4% Subsaharan African 2%
- Foreign-born
- 2% · Canada
- Languages at home
- 95% English-only · Spanish 3% Other Indo-European 1% Other Asian/Pacific 1%
Political lean MEDSL · Lackawanna
- 2024 margin
- Toss-up / Even · D 51.0% · R 48.3%
- 2008→2024 swing
- -23.2pp toward R · 2008: 26.0pp · 2024: 2.8pp
- All cycles
- 2024: D+2.8 2020: D+8.4 2016: D+3.4 2012: D+27.4 2008: D+26.0
Not yet ingested
- Civics
- —
Market trends
- HPI YoY
- ▲ 5.15%
- Current HPI
- 242.2839
- Rent YoY
- —
- Metro
- —
- State GDP YoY
- ▲ 1.68%
- F500 in state
- 34
Industry mix (Fortune 500 HQ in PA)
| Industry | F500 HQs | Revenue |
|---|---|---|
| Healthcare | 2 | $309B |
|
||
| Insurance | 2 | $27B |
|
||
| Telecommunications / Media | 1 | $124B |
|
||
| Industrial Distribution | 1 | $22B |
|
||
| Financial Services | 1 | $20B |
|
||
| Chemicals / Materials | 1 | $18B |
|
||
Price history
1 event — show timeline
- 2026-06-09 Listed $399,000 GSBR as distributed by MLS GRID
Cash-flow waterfall
monthlySold comps — $/sqft
last 12 mo · ≤1 miLoading sold comps…