113 S Graham St · Sardinia, OH
Flood risk 1/10 · Minimal
- FEMA flood zone
- X (unshaded)
- Chance of flooding over 30 yrs
- 0.0%
- Est. flood insurance / yr
- $473 – $860
Fire risk 3/10 · Minor
- Est. fire insurance / yr
- $713 – $1,323
Heat risk 4/10 · Minor
- Hot days now (above 100°F)
- 7 days/yr
- Hot days in 30 yrs
- 19 days/yr
Wind risk 2/10 · Minimal
- Chance of severe wind over 30 yrs
- 1.0%
Air-quality risk 2/10 · Minimal
- Unhealthy air days now
- 1 days/yr
- Unhealthy air days in 30 yrs
- 1 days/yr
Risk factors via First Street. Map © Google.
Why this score? — see what drove the B- grade
The composite is a weighted blend of 9 inputs, each scored 0–100. Each bar is that input's sub-score; the figure is the points it added to the 100-point composite (weight × sub-score).
- Cash flow +29.6/30.0
- DSCR +10.0/10.0
- ARV discount +7.5/15.0
- 1% rule +7.3/10.0
- Schools +4.8/10.0
- Livability +3.3/5.0
- Rent growth +2.5/5.0
- Condition / age +2.5/5.0
- Appreciation +0.0/10.0
$169,000
🖨 Deal sheet (PDF) 📄 Offer letter ✓ Due diligence
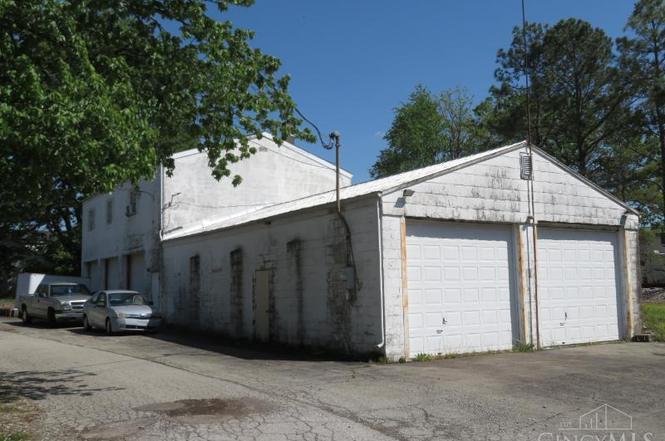
Listing remarks
Sardinia Community! 3000 sq. ft. 5 bay garage/shop with 1500 sq. ft. 2nd level living quarters! 2 bedrooms, 1 full bath, equipped kitchenette, living room & laundry, 2 walk-in closets & gas furnace! Living area is currently rented at $750.00/month. 2 garage/shop areas boasting five 10x12 doors, plumbed for 2 restrooms, used oil furnace, 3 phase electric, blacktop parking for 10-12 cars. Ideal setup for a detailer, body shop, mechanic, hot rodder, car/camper/boat storage, a bachelor's paradise! A multitude of purposes and opportunities this location once served the Sardinia community as the Fire Department and Weasel's Racing!
Key facts
- Gas furnace
- Living quarters
- Garage shop areas
Tags
Property features AI
Finance
- Other: Paved road access; Lot approximately 60 x 120 (about 0.165 acres)
- HOA & community: No HOA
Exterior
- Parking: Attached oversized garage with space for 10 vehicles; Asphalt driveway
- Utilities: Public water; Public sewer; Propane gas service; Electric water heater
- Home design: Traditional single-family home; Two levels; Block foundation
- Construction: Block construction; Metal and shingle roof; Vinyl insulated windows; Garage door opener
- Exterior features: Deck; Level to sloped lot
Interior
- Kitchen: Wood cabinets; Laminate flooring in kitchen
- Bedrooms: Two bedrooms; Primary bedroom on level 2, about 14 x 16; Second bedroom on level 2, about 8 x 16
- Flooring: Wall-to-wall carpet in living area; Laminate flooring in kitchen
- Bathrooms: One full bathroom on level 2
- Heating & cooling: Forced air gas heating; Ceiling fans; Window unit cooling
- Interior features: Four total rooms; Ceiling fan
- Laundry & utility: Laundry room on level 2, about 7 x 7
Neighborhood map
What this means for you Summary
Snapshot
- This is a 3-bed/1.0-bath single-family listed at $169k.
Deal economics
- At list price, monthly cash flow is $611 ($7k/yr) — positive.
- The deal already cash-flows at list — no discount required.
- Meets the 1% rule at list price ($2k rent vs $169k).
- Recommended offer: $154k (9.0% below list) — sets the bar for market timing.
Location & tenants
- Location reads 66/100 on livability (#643 in OH) — a middle-class / working-renter tenant base. Strengths: crime A+, cost of living A+, housing A+; Watch: employment C-, amenities F, commute F.
- Eastern Local (rural): math 51% / reading 61% proficiency, ranked #350 of 656 in OH (top 53%) — acceptable for families but not a draw, mixed tenant base, ~2y average lease.
- Market conditions: 86 active listings in the ZIP; 147 units permitted in Brown County in 2024 (0 in 5+ unit buildings).
- This rent runs 39% of the median local income ($64k/yr) — at the standard rent-burdened threshold; future hikes will face affordability resistance.
Forward outlook
- Local home prices are declining (-3.0%/yr); year-one equity from $1k of loan paydown is wiped out by about $5k of value loss. Plan a longer hold.
- Brown County population projected at -26% by 2050 — secular population decline; favor cash flow + early exit over multi-decade hold.
- At projected returns (-3.0% appreciation + 3.0% rent growth), your $47k cash investment doubles in ~8 years — after that, you're playing with house money.
Negotiation context
- It's been on market 116 days — a 9% lower offer ($154k) is reasonable based on typical stale-listing flexibility.
Questions for the listing agent
- It's been on market 116 days. Have you received any prior offers? Is the seller open to a 9% concession, seller financing, or rate buy-down credit?
- Built in 1970 — when were the roof, HVAC, electrical panel, plumbing, and water heater last replaced?
- Why hasn't it sold? Are there any deal-killer items the seller is aware of (foundation, flood, title, zoning, code violations)?
- Is there a deadline driving the sale (1031 exchange, divorce, estate, relocation)? That informs how much negotiation room exists.
- What's the average days-on-market for RENTAL listings here right now (not sales)? A rising rental-DOM trend means longer vacancies and softer asking-rent achievability than the comps imply.
- What's the recent tenant-quality profile in this submarket — average credit score on applications, eviction rate, late-payment / NSF rate, and stable-employment percentage? A property-management company in the area should have these aggregated.
- How much new for-sale + rental construction is in the pipeline within 1–3 miles? Heavy new supply typically softens prices + rents 12–24 months out; constrained supply supports both.
Investment metrics
- 1% rule
- 1.23% ✓
- Cap rate
- 10.63%
- Cash-on-cash
- 15.48%
- DSCR
- 1.69
- GRM
- 6.8
CMA / ARV
No comps found within radius.
Projected returns pro-forma
-3.0% appreciation · 3.0% rent growth · sell at horizon
- IRR
- 6.2%
- Equity multiple
- 1.24×
- Total profit
- $11,449
- Equity at exit
- $25,198
- IRR
- 15.6%
- Equity multiple
- 2.26×
- Total profit
- $59,826
- Equity at exit
- $14,612
Cash invested: $47,320 (down + closing). Projections, not guarantees.
Landlord ↔ Tenant lean methodology
- Overall (STATE)
- 73 Landlord-Friendly
- State Ohio
- 73 Landlord-Friendly · R+6
- County
- — inherits STATE
- City
- — inherits STATE
ZIP-level market 45171
- Home prices YoY
- -10.8%
- Active inventory
- 86
- Price-to-rent
- 6.8×
Monthly cashflow live
- Estimated rent
- $2,077 medium interval (Pro) →
- Mortgage (P&I)
- −$886
- Tax from tax record
- −$74 /mo · $885/yr
- Insurance
- −$70
- HOA
- −$0
- Vacancy / Maint / Mgmt
- −$436
- Net cashflow
- $611
Break-even live
Sensitivity live
| Price | -10% $706 | -5% $658 | +0% $611 | +5% $563 | +10% $515 |
|---|---|---|---|---|---|
| Rent | -10% $446 | -5% $529 | +0% $611 | +5% $693 | +10% $775 |
| Rate | -1.0pp $696 | -0.5pp $654 | base $611 | +0.5pp $567 | +1.0pp $522 |
UW: 25.0% down · 7.5% · 30yr · 1.5% tax · 5.0% vac · 8.0% maint · 8.0% mgmt
Financing live
Cash to close
- Down payment
- $42,250
- Closing costs
- $5,070
- Reserves months
- —
- Total cash needed
- —
Loan-product check · same deal, 3 products live
Conventional
25% down · 7.5% · 30yr
- Down + closing
- —
- Monthly P&I
- —
- Monthly cashflow
- —
- DSCR
- —
- Eligible?
- —
Personal DTI + credit; lowest rate.
DSCR
20% down · 8.5% · 30yr
- Down + closing
- —
- Monthly P&I
- —
- Monthly cashflow
- —
- DSCR
- —
- Eligible?
- —
No personal income docs; deal must DSCR.
Hard money
10% down · 12.0% · 12mo
- Down + closing
- —
- Monthly P&I
- —
- Monthly cashflow
- —
- DSCR
- —
- Eligible?
- —
Short-term bridge; refi at stabilization.
Listing history 16 events
-
2026-06-21days on market $169,000 Active 116 DOM
-
2026-06-18days on market $169,000 Active 114 DOM
-
2026-06-17days on market $169,000 Active 113 DOM
-
2026-06-16days on market $169,000 Active 112 DOM
-
2026-06-15days on market $169,000 Active 111 DOM
-
2026-06-13days on market $169,000 Active 109 DOM
-
2026-06-12days on market $169,000 Active 108 DOM
-
2026-06-09days on market $169,000 Active 105 DOM
-
2026-06-08days on market $169,000 Active 104 DOM
-
2026-06-08days on market $169,000 Active 103 DOM
-
2026-06-07days on market $169,000 Active 102 DOM
-
2026-06-04days on market $169,000 Active 99 DOM
-
2026-06-02days on market $169,000 Active 98 DOM
-
2026-06-01days on market $169,000 Active 97 DOM
-
2026-05-31days on market $169,000 Active 96 DOM
-
2026-02-24$169,000 Active
ⓘ Source: listings_history table (triggers on properties + properties_extension) + one-shot
backfill from property_details.listing_events for pre-trigger history.
Tax reassessment forecast OH · Partial reset (capped growth)
- Current annual tax
- $885 · $74/mo
- Projected year-2 tax
- $1,761 · $147/mo
- Expected delta
- +$876/yr (+$73/mo · 98.9%)
ⓘ Screening estimate from a state-policy table — verify with the county assessor before closing.
Climate risk First Street
- Flood 1/10 Low FEMA zone X (unshaded) · 0% chance over 30 yrs
- Wildfire 3/10 Moderate
- Heat 4/10 Moderate 7 d/yr ≥100°F today · 19 d/yr by 30 yrs out
- Wind 2/10 Low 100% chance of damaging wind over 30 yrs
- Air quality 2/10 Low 1 unhealthy d/yr today · 1 by 30 yrs out
Nearby sold comps map
Loading sold comps map…
Walkable amenities ~0.75 mi
Loading nearby amenities…
Taxation est. · year 1
- Rental income
- $24,927
- − Mortgage interest
- −$9,467
- − Property taxes
- −$885
- − Insurance
- −$845
- − Repairs & maintenance
- −$1,994
- − Management
- −$1,994
- − Depreciation
- −$4,916
- Taxable income
- $4,825
- Est. tax owed @ 24.0%
- −$1,158
- After-tax cash flow
- $6,169/yr
For passive investors: Depreciation is non-cash, so a rental often shows a tax loss while cash-flowing — sheltering income. Rental losses are passive: they offset passive income freely, and up to $25,000/yr can offset ordinary (W-2) income if you actively participate and your MAGI is under $100k (phasing out to $0 by $150k); unused losses carry forward. On sale, claimed depreciation is recaptured at up to 25%, and gains may owe capital-gains tax (a 1031 exchange can defer both). Figures are a year-1 estimate at your 24.0% rate — not tax advice; consult a CPA.
Schools (NCES district)
- District
- Eastern Local
- NCES district ID
- 3904603
- Math proficiency
- 51% ▼ -9.00%
- Reading proficiency
- 61% ▼ -8.00%
- Median HH income
- $50,895
- Composite
- 47.81/100
- National rank
- #2226
- State rank
- #350 of 656 in OH
Livability — Sardinia
- Score
- 66/100
- State rank
- #643
- US rank
- #11399
Category grades
Schools grade is shown separately in the Schools card above.
Census & demographics
- Census place
- Sardinia, OH
- County
- Brown · 38,418 people
- Metro
- Cincinnati, OH-KY-IN
- Population (ZIP)
- 5,770
- Household income
- $63,780
- Rent vs Own
- Severe rent burden
- 2.0
Population outlook (Brown County) Hauer SSP2
- Today (2025)
- 41,243 people
- By 2030
- 39,382 · -4.5%
- By 2040
- 35,196 · -14.7%
- By 2050
- 30,743 · -25.5%
- By 2075
- 21,870 · -47.0%
- By 2100
- 15,069 · -63.5%
Race, ethnicity, and origin ACS 2023
- Neighborhood character
- Predominantly White (93%)
- Race & ethnicity
- White 93% Two or more races 4% Hispanic / Latino 2%
- Common ancestry
- Lithuanian 4% Iranian 2% Slovak 2%
- Foreign-born
- 0% · Canada
Political lean MEDSL · Brown
- 2024 margin
- Solid R (+61.5) · D 19.0% · R 80.5%
- 2008→2024 swing
- -38.2pp toward R · 2008: -23.3pp · 2024: -61.5pp
- All cycles
- 2024: R+61.5 2020: R+57.4 2016: R+52.2 2012: R+25.1 2008: R+23.3
Not yet ingested
- Civics
- —
Market trends
- HPI YoY
- ▼ -35.85%
- Current HPI
- 295.9141
- Rent YoY
- —
- Metro
- —
- State GDP YoY
- ▲ 1.98%
- F500 in state
- 48
Industry mix (Fortune 500 HQ in OH)
| Industry | F500 HQs | Revenue |
|---|---|---|
| Insurance | 3 | $145B |
|
||
| Industrial Machinery | 3 | $49B |
|
||
| Financial Services | 3 | $24B |
|
||
| Consumer Goods | 2 | $93B |
|
||
| Aerospace / Defense | 2 | $47B |
|
||
| Utilities | 2 | $33B |
|
||
Price history
1 event — show timeline
- 2026-02-24 Listed $169,000 Cincy MLS
Property tax history
-0.3%/yrLatest (2025): $885 · +0.0% YoY. Source: county tax records.
Cash-flow waterfall
monthlySold comps — $/sqft
last 12 mo · ≤1 miLoading sold comps…