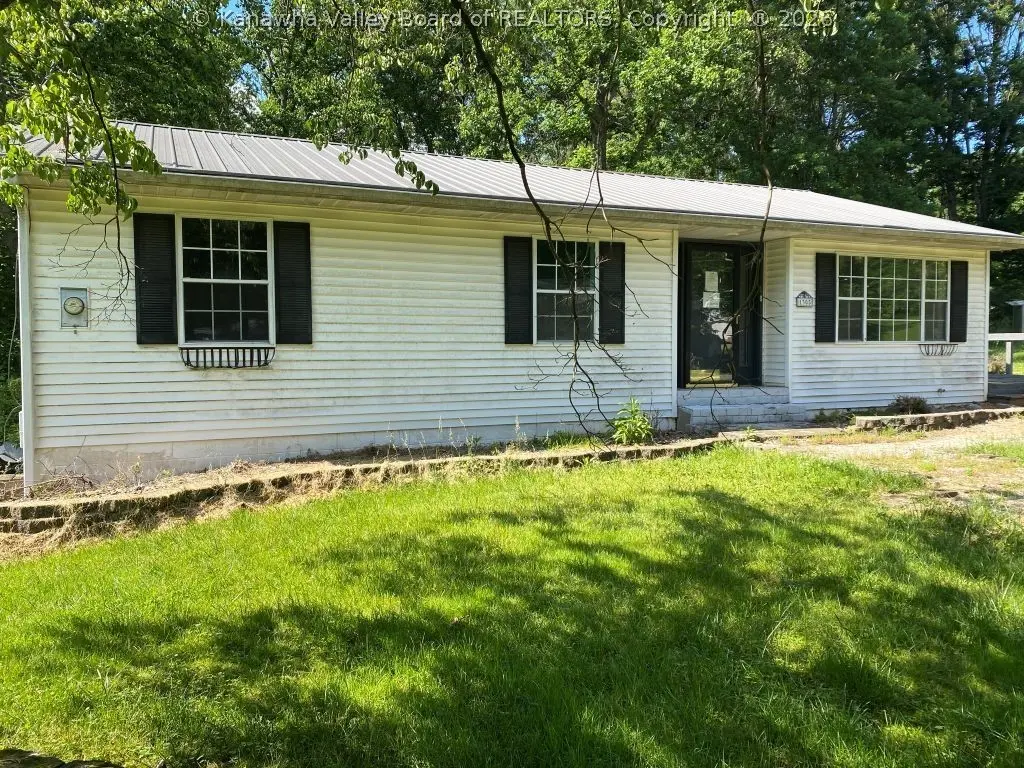
1305 Linda Ln · Parkersburg, WV
Flood risk 1/10 · Minimal
- FEMA flood zone
- X (unshaded)
- Chance of flooding over 30 yrs
- 0.0%
- Est. flood insurance / yr
- $507 – $1,088
Fire risk 3/10 · Minor
- Est. fire insurance / yr
- $787 – $1,461
Heat risk 4/10 · Minor
- Hot days now (above 101°F)
- 7 days/yr
- Hot days in 30 yrs
- 17 days/yr
Wind risk 2/10 · Minimal
- Chance of severe wind over 30 yrs
- 1.0%
Air-quality risk 1/10 · Minimal
- Unhealthy air days now
- 0 days/yr
- Unhealthy air days in 30 yrs
- 0 days/yr
Risk factors via First Street. Map © Google.
Why this score? — see what drove the B- grade
The composite is a weighted blend of 9 inputs, each scored 0–100. Each bar is that input's sub-score; the figure is the points it added to the 100-point composite (weight × sub-score).
- Cash flow +29.2/30.0
- DSCR +10.0/10.0
- 1% rule +8.0/10.0
- ARV discount +7.5/15.0
- Schools +3.6/10.0
- Livability +3.6/5.0
- Rent growth +2.5/5.0
- Condition / age +2.5/5.0
- Appreciation +0.0/10.0
$90,000
🖨 Deal sheet 📄 Offer letter ✓ Due diligence
Listing remarks MLS
Excellent condition. Lots of updates. Ceramic tile. Walk out basement. Fenced yard. Gas log fireplace. Possession not before Aug 10, 2004. Use Dupont Contract. Elem: Madison Elementary School Elem/Bus: Y JrHigh: Jackson Jr. High School JrHigh/Bus: Y High/Bus: Y Fire: CIT Police: CTY ; SQFT=Fin L1:1248, Fin Bsmt:983, Fin Above:1248, Fin Total:2231;GAR= 1 Car Det, Gar Other-See Remarks
Key facts
- 3 lots
- Raised ranch
- 0.73 acre lot
Tags
Property features AI
Exterior
- Parking: Detached garage with 2 spaces
- Security: Smoke detectors
- Utilities: Public water; Public sewer
- Home design: Single family residence; Residential property
- Construction: Frame construction; Vinyl siding; Metal roof; Partial basement
- Exterior features: Deck
Interior
- Kitchen: Eat-in kitchen
- Flooring: Laminate; Tile
- Bathrooms: 2 full bathrooms
- Heating & cooling: Central air conditioning; Forced air heating
- Interior features: Eat-in kitchen; Insulated windows; Fireplace (1)
Neighborhood map
What this means for you Summary
Snapshot
- This is a 3-bed/2.0-bath single-family listed at $90k.
Deal economics
- At list price, monthly cash flow is $313 ($4k/yr) — positive.
- The deal already cash-flows at list — no discount required.
- Meets the 1% rule at list price ($1k rent vs $90k).
- Cap rate 10.5% vs local median 5.6% in Parkersburg — top-decile yield for the area; either an underpriced asset or a hidden risk that comps aren't pricing in. Stress-test before assuming the spread holds.
Location & tenants
- Location reads 72/100 on livability (#46 in WV) — a middle-class / working-renter tenant base. Strengths: cost of living A+, housing A+, health & safety A+; Watch: crime D+, commute F, employment F.
- Wood County Schools (urban): math 38% / reading 48% proficiency, ranked #3 of 55 in WV (top 6%) — families likely to look elsewhere, expect single-tenant / working-renter base with shorter leases.
- Zoned schools: Neale Elementary School (math 52% / reading 57%, grade C, #29 of 377 statewide, top 10%, 382 students, 0% FRL); Jackson Middle School (math 35% / reading 50%, grade D-, #13 of 109 statewide, top 13%, 494 students, 0% FRL); Parkersburg High School (math 25% / reading 49%, grade F, #32 of 110 statewide, top 34%, 1,651 students, 0% FRL) — zoned schools average 0% FRL vs 47% district-wide (47 pts lower); this property's tenant base skews higher-income than the district average.
- Market conditions: 55 active listings in the ZIP; 124 units permitted in Wood County in 2024 (33 in 5+ unit buildings).
Forward outlook
- Local home prices are declining (-3.0%/yr); year-one equity from $622 of loan paydown is wiped out by about $3k of value loss. Plan a longer hold.
- Wood County population projected at -13% by 2050 — secular population decline; favor cash flow + early exit over multi-decade hold.
- At projected returns (-3.0% appreciation + 3.0% rent growth), your $25k cash investment doubles in ~8 years — after that, you're playing with house money.
Negotiation context
- Only 8 days on market — expect competitive offers; lowballing is unlikely to land.
- 3 sale attempts since 22y ago with the ask held roughly flat each time — persistent listings suggest the price (not the market) is what's stuck; bring a comps-based counter.
Questions for the listing agent
- Is there a deadline driving the sale (1031 exchange, divorce, estate, relocation)? That informs how much negotiation room exists.
- Schools are F-rated, which usually means shorter tenancies and higher turnover. Who's the typical renter profile here, and what's been the actual vacancy rate?
- Crime grade is D in this area — have there been break-ins, vandalism, or insurance claims at this property in the last 3 years? What carrier currently insures it and at what premium?
- What's the average days-on-market for RENTAL listings here right now (not sales)? A rising rental-DOM trend means longer vacancies and softer asking-rent achievability than the comps imply.
- What's the recent tenant-quality profile in this submarket — average credit score on applications, eviction rate, late-payment / NSF rate, and stable-employment percentage? A property-management company in the area should have these aggregated.
- How much new for-sale + rental construction is in the pipeline within 1–3 miles? Heavy new supply typically softens prices + rents 12–24 months out; constrained supply supports both.
Investment metrics
- 1% rule
- 1.30% ✓
- Cap rate
- 10.47%
- Cash-on-cash
- 14.92%
- DSCR
- 1.66
- GRM
- 6.4
CMA / ARV
- ARV (on-the-fly)
- $220,896
- Comps found
- 2
Show comp detail 2 sales within ~0.75 mi
| Address | Dist | Beds/Ba | Sqft | Sold | Price | $/sf | Match |
|---|---|---|---|---|---|---|---|
| 5216 Briscoe Rd | 0.39mi | 3/2.0 | 1,332 (+7%) | 10mo | $236,000 | $177 | 63 |
| 5014 Marie St | 0.16mi | 3/2.0 | 1,368 (+10%) | 22mo | $230,000 | $168 | 58 |
Match score weights: distance 35% · size 25% · config 20% · recency 20%. Top-matched comps best support the ARV.
Projected returns pro-forma
-3.0% appreciation · 3.0% rent growth · sell at horizon
- IRR
- 5.5%
- Equity multiple
- 1.21×
- Total profit
- $5,380
- Equity at exit
- $13,419
- IRR
- 14.9%
- Equity multiple
- 2.21×
- Total profit
- $30,423
- Equity at exit
- $7,782
Cash invested: $25,200 (down + closing). Projections, not guarantees.
Landlord ↔ Tenant lean methodology
- Overall (STATE)
- 83 Strongly Landlord-Friendly
- State West Virginia
- 83 Strongly Landlord-Friendly · R+22
- County
- — inherits STATE
- City
- — inherits STATE
ZIP-level market 26104
- Home prices YoY
- -14.8%
- Active inventory
- 55
- Price-to-rent
- 6.4×
Monthly cashflow live
- Estimated rent
- $1,171 medium interval (Pro) →
- Mortgage (P&I)
- −$472
- Tax from tax record
- −$102 /mo · $1,229/yr
- Insurance
- −$38
- HOA
- −$0
- Vacancy / Maint / Mgmt
- −$246
- Net cashflow
- $313
Break-even live
UW: 25.0% down · 7.5% · 30yr · 1.5% tax · 5.0% vac · 8.0% maint · 8.0% mgmt
Financing live
Cash to close
- Down payment
- $22,500
- Closing costs
- $2,700
- Reserves months
- —
- Total cash needed
- —
Loan-product check · same deal, 3 products live
Conventional
25% down · 7.5% · 30yr
- Down + closing
- —
- Monthly P&I
- —
- Monthly cashflow
- —
- DSCR
- —
- Eligible?
- —
Personal DTI + credit; lowest rate.
DSCR
20% down · 8.5% · 30yr
- Down + closing
- —
- Monthly P&I
- —
- Monthly cashflow
- —
- DSCR
- —
- Eligible?
- —
No personal income docs; deal must DSCR.
Hard money
10% down · 12.0% · 12mo
- Down + closing
- —
- Monthly P&I
- —
- Monthly cashflow
- —
- DSCR
- —
- Eligible?
- —
Short-term bridge; refi at stabilization.
Listing history 8 events
-
2026-06-19days on market $90,000 Active 8 DOM
-
2026-06-18days on market $90,000 Active 7 DOM
-
2026-06-17days on market $90,000 Active 6 DOM
-
2026-06-16days on market $90,000 Active 5 DOM
-
2026-06-15days on market $90,000 Active 4 DOM
-
2026-06-14days on market $90,000 Active 2 DOM
-
2026-06-12remarks 504-char remark
-
2026-06-12$90,000 Active 1 DOM
ⓘ Source: listings_history table (triggers on properties + properties_extension) + one-shot
backfill from property_details.listing_events for pre-trigger history.
Tax reassessment forecast WV · Resets to sale price
- Current annual tax
- $1,229 · $102/mo
- Projected year-2 tax
- $1,229 · $102/mo
- Expected delta
- $0/yr ($0/mo · 0.0%)
ⓘ Screening estimate from a state-policy table — verify with the county assessor before closing.
Climate risk First Street
- Flood 1/10 Low FEMA zone X (unshaded) · 0% chance over 30 yrs
- Wildfire 3/10 Moderate
- Heat 4/10 Moderate 7 d/yr ≥101°F today · 17 d/yr by 30 yrs out
- Wind 2/10 Low 100% chance of damaging wind over 30 yrs
- Air quality 1/10 Low 0 unhealthy d/yr today · 0 by 30 yrs out
Nearby sold comps map
Loading sold comps map…
Walkable amenities ~0.75 mi
Loading nearby amenities…
Taxation est. · year 1
- Rental income
- $14,053
- − Mortgage interest
- −$5,041
- − Property taxes
- −$1,229
- − Insurance
- −$450
- − Repairs & maintenance
- −$1,124
- − Management
- −$1,124
- − Depreciation
- −$2,618
- Taxable income
- $2,466
- Est. tax owed @ 24.0%
- −$592
- After-tax cash flow
- $3,167/yr
For passive investors: Depreciation is non-cash, so a rental often shows a tax loss while cash-flowing — sheltering income. Rental losses are passive: they offset passive income freely, and up to $25,000/yr can offset ordinary (W-2) income if you actively participate and your MAGI is under $100k (phasing out to $0 by $150k); unused losses carry forward. On sale, claimed depreciation is recaptured at up to 25%, and gains may owe capital-gains tax (a 1031 exchange can defer both). Figures are a year-1 estimate at your 24.0% rate — not tax advice; consult a CPA.
Schools (NCES district)
- District
- Wood County Schools
- NCES district ID
- 5401620
- Math proficiency
- 38% ▼ -10.00%
- Reading proficiency
- 48% ▼ -4.00%
- Median HH income
- $42,363
- Composite
- 36.22/100
- National rank
- #4728
- State rank
- #3 of 55 in WV
Livability — Parkersburg
- Score
- 72/100
- State rank
- #46
- US rank
- #5841
Category grades
Schools grade is shown separately in the Schools card above.
Census & demographics
- County
- Wood County · 44,810 people
- City population
- 44,810
- Metro
- Parkersburg-Vienna, WV
- Population (ZIP)
- 16,805
- Household income
- $54,331
- Rent vs Own
- Severe rent burden
- 309.0
Population outlook (Wood County) Hauer SSP2
- Today (2025)
- 84,304 people
- By 2030
- 82,420 · -2.2%
- By 2040
- 78,133 · -7.3%
- By 2050
- 73,639 · -12.7%
- By 2075
- 63,093 · -25.2%
- By 2100
- 50,461 · -40.1%
Race, ethnicity, and origin ACS 2023
- Neighborhood character
- Predominantly White (93%)
- Race & ethnicity
- White 93% Two or more races 3% Hispanic / Latino 1% Black 1%
- Common ancestry
- Slovak 3% Italian 3% Serbian 2%
- Foreign-born
- 1% · Canada
- Languages at home
- 98% English-only · Spanish 1%
Political lean MEDSL · Wood
- 2024 margin
- Solid R (+43.0) · D 27.6% · R 70.7% · Other 1.6%
- 2008→2024 swing
- -14.4pp toward R · 2008: -28.7pp · 2024: -43.0pp
- All cycles
- 2024: R+43.0 2020: R+42.0 2016: R+47.8 2012: R+32.5 2008: R+28.7
Not yet ingested
- Civics
- —
Market trends
- HPI YoY
- ▼ -35.00%
- Current HPI
- 201.3315
- Rent YoY
- —
- Metro
- Parkersburg-Vienna, WV
- State GDP YoY
- —
- F500 in state
- 0
Price history
+5.9% since first listed9 events — show timeline
- 2026-06-11 Listed $90,000 KVBOR
- 2025-12-29 Sold (Public Records) $137,002 Public Records
- 2025-10-23 Listing Removed — MLSNOW
- 2025-09-21 Listed $165,000 MLSNOW
- 2019-08-07 Sold (Public Records) $159,000 Public Records
- 2004-08-12 Sold (MLS) $122,500 MLSNOW
- 2004-06-28 Listed $127,900 MLSNOW
- 2002-11-06 Sold (Public Records) $110,000 Public Records
- 1997-01-14 Sold (Public Records) $85,000 Public Records
Property tax history
+6.9%/yrLatest (2025): $1,229 · +3.5% YoY. Source: county tax records.
Cash-flow waterfall
monthlySold comps — $/sqft
last 12 mo · ≤1 miLoading sold comps…