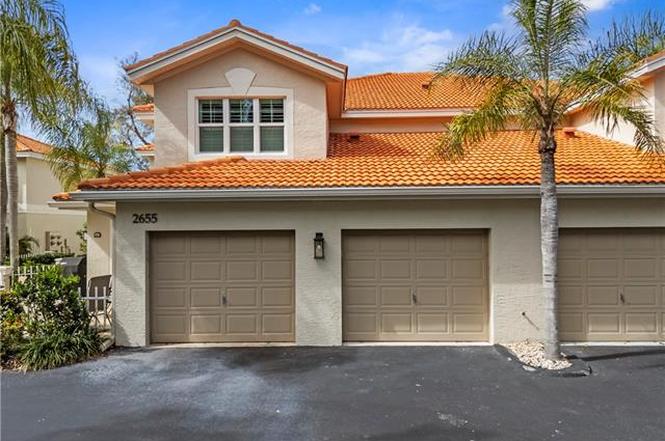
2655 Magnolia Park Ln #101 · Pelican Marsh, FL
Flood risk 3/10 · Minor
- FEMA flood zone
- X (unshaded)
- Chance of flooding over 30 yrs
- 0.09%
- Est. flood insurance / yr
- $507 – $1,088
Fire risk 1/10 · Minimal
- Est. fire insurance / yr
- $947 – $1,759
Heat risk 10/10 · Severe
- Hot days now (above 107°F)
- 7 days/yr
- Hot days in 30 yrs
- 27 days/yr
Wind risk 10/10 · Severe
- Chance of severe wind over 30 yrs
- 99.0%
Air-quality risk 2/10 · Minimal
- Unhealthy air days now
- 2 days/yr
- Unhealthy air days in 30 yrs
- 2 days/yr
Risk factors via First Street. Map © Google.
Why this score? — see what drove the C grade
The composite is a weighted blend of 9 inputs, each scored 0–100. Each bar is that input's sub-score; the figure is the points it added to the 100-point composite (weight × sub-score).
- Cash flow +18.0/30.0
- ARV discount +7.5/15.0
- 1% rule +7.0/10.0
- DSCR +5.6/10.0
- Appreciation +5.1/10.0
- Schools +5.0/10.0
- Rent growth +2.7/5.0
- Livability +2.5/5.0
- Condition / age +2.5/5.0
$375,000
🖨 Deal sheet 📄 Offer letter ✓ Due diligence
Listing remarks
Experience the best of the Naples lifestyle in this beautifully maintained 2-bedroom, 2-bathroom condo situated within a peaceful, gated community. Located on a quiet cul-de-sac, this residence offers a serene retreat while remaining incredibly convenient to the area's premier shopping and dining. You are perfectly positioned just three miles from the pristine Gulf beaches, allowing for effortless coastal living. The home welcomes you with a quaint courtyard entry and features a modern kitchen equipped with newer appliances. One of the highlights of this property is the private screened lanai, providing the perfect space to enjoy the beautiful Naples days and nights in total comfort. For ad
Key facts
- Gated community
- Quiet cul-de-sac
- Whirlpool spa
Tags
Property features AI
Finance
- Financial info: Total annual recurring fees reported
- HOA & community: Mandatory HOA; Quarterly HOA fees (master and association fees combined); Master HOA covers common amenities and services; HOA maintenance includes cable, internet/WiFi, irrigation water, lawn/land maintenance, pest control (exterior), street lights, trash removal, water, reserves, management and legal/accounting; Condo-style management; Community amenities include clubhouse, community pool and spa, exercise room, tennis and bocce courts, cabana, fishing pier, community room, internet access, sidewalks and underground utilities; Total annual recurring HOA fees reported
Exterior
- Parking: Attached 1-car garage
- Security: Gated community
- Utilities: Central water; Central sewer; Cable available
- Home design: Residential low-rise (1-3 stories); End-unit; Rear exposure faces west; Located in PIPERS GROVE development
- Construction: Built in 1996; Concrete block construction; Stucco exterior; Tile roof; Single-hung windows; Electric storm shutters
- Exterior features: Courtyard; Fence; Patio; Pond view
Interior
- Kitchen: Electric cooktop; Range; Self-cleaning oven; Microwave; Dishwasher; Disposal; Refrigerator/freezer and icemaker
- Bedrooms: 2 bedrooms
- Flooring: Carpet; Tile
- Bathrooms: 2 full bathrooms; Master bath with dual sinks and shower (no tub)
- Heating & cooling: Central electric heat; Central electric cooling; Ceiling fans
- Interior features: Laundry tub; Pantry; Smoke detectors; Walk-in closet; Window coverings; Breakfast room and dining/living dining area; Screened lanai/porch; Turnkey furnished; Split-bedroom floor plan; 3 ceiling fans
- Laundry & utility: Washer and dryer in residence; Laundry tub; Auto garage door
Neighborhood map
What this means for you Summary
Snapshot
- This is a 2-bed/2.0-bath condo listed at $375k.
Deal economics
- At list price, monthly cash flow is $324 ($4k/yr) — positive.
- The deal already cash-flows at list — no discount required.
- Meets the 1% rule at list price ($4k rent vs $375k).
- Recommended offer: $330k (12.0% below list) — sets the bar for market timing.
Location & tenants
- Location reads: area grade C — affects rentability + tenant quality, not the cash-flow math above.
- Collier (suburban): math 60% / reading 56% proficiency, ranked #16 of 73 in FL (top 22%) — acceptable for families but not a draw, mixed tenant base, ~2y average lease.
- Market conditions: Rents flat; 424 active listings in the ZIP; 40 comparable units currently listed for rent nearby; rentals leasing fast (median 14d on market — plan ~1-2 weeks tenant-placement turnaround); solid renter incomes; 3,520 units permitted in Collier County in 2024 (959 in 5+ unit buildings).
- At $4,483/mo this rent would consume 58% of the median local household income ($92k/yr) (locally 1712% of renters already pay >50% of income on rent) — very limited rent-growth headroom before tenants either downsize or default.
Forward outlook
- In year one you build about $4k of equity ($3k loan paydown + $1k appreciation (0.3% local appreciation)).
- Collier County population projected at +30% by 2050 — long-run rental-demand tailwind backs the buy-and-hold thesis.
- By year 8, paydown + projected appreciation supports a ~$34k cash-out refi (75% LTV) — recoverable capital for the next deal without selling this one.
Negotiation context
- It's been on market 133 days — a 12% lower offer ($330k) is reasonable based on typical stale-listing flexibility.
- Current owner paid $117k; list at $375k implies a 220% gain — meaningful room to come down on a strong offer.
Risks & watch-outs
- Climate carrying-cost: severe wind risk, 99% chance of damaging wind over 30y; extreme-heat days projected 7→27/yr by 2055 (HVAC capex compounding) — expect insurance premiums to compound above CPI over the hold.
Questions for the listing agent
- It's been on market 133 days. Have you received any prior offers? Is the seller open to a 12% concession, seller financing, or rate buy-down credit?
- What does the HOA fee cover, when was the last increase, and are there any pending special assessments or reserve-fund shortfalls?
- Any open or pending special assessments — roof, HVAC, plumbing, elevator, façade? What's the per-unit balance and payoff schedule, and is the seller paying it off at close or rolling it to the buyer?
- Why hasn't it sold? Are there any deal-killer items the seller is aware of (foundation, flood, title, zoning, code violations)?
- Is there a deadline driving the sale (1031 exchange, divorce, estate, relocation)? That informs how much negotiation room exists.
- What's the average days-on-market for RENTAL listings here right now (not sales)? A rising rental-DOM trend means longer vacancies and softer asking-rent achievability than the comps imply.
- What's the recent tenant-quality profile in this submarket — average credit score on applications, eviction rate, late-payment / NSF rate, and stable-employment percentage? A property-management company in the area should have these aggregated.
- How much new apartment / multifamily construction is in the pipeline within 1–3 miles? Heavy new supply (>2% of stock underway) typically softens rents 12–24 months out; light construction supports rent growth.
Investment metrics
- 1% rule
- 1.20% ✓
- Cap rate
- 7.33%
- Cash-on-cash
- 3.71%
- DSCR
- 1.16
- GRM
- 7.0
CMA / ARV
No comps found within radius.
Projected returns pro-forma
0.29% appreciation · 0.92% rent growth · sell at horizon
- IRR
- 1.2%
- Equity multiple
- 1.06×
- Total profit
- $6,178
- Equity at exit
- $114,451
- IRR
- 4.8%
- Equity multiple
- 1.50×
- Total profit
- $52,819
- Equity at exit
- $142,096
Cash invested: $105,000 (down + closing). Projections, not guarantees.
Landlord ↔ Tenant lean methodology
- Overall (STATE)
- 87 Strongly Landlord-Friendly
- State Florida
- 87 Strongly Landlord-Friendly · R+3
- County
- — inherits STATE
- City
- — inherits STATE
ZIP-level market 34109
- Home prices YoY
- 0.1%
- Rents YoY
- 0.9%
- Active inventory
- 424
- Price-to-rent
- 7.0×
Monthly cashflow live
- Estimated rent
- $4,483 high interval (Pro) →
- Mortgage (P&I)
- −$1,967
- Tax from tax record
- −$262 /mo · $3,150/yr
- Insurance
- −$156
- HOA
- −$832
- Vacancy / Maint / Mgmt
- −$941
- Net cashflow
- $324
Break-even live
UW: 25.0% down · 7.5% · 30yr · 1.5% tax · 5.0% vac · 8.0% maint · 8.0% mgmt
Financing live
Cash to close
- Down payment
- $93,750
- Closing costs
- $11,250
- Reserves months
- —
- Total cash needed
- —
Loan-product check · same deal, 3 products live
Conventional
25% down · 7.5% · 30yr
- Down + closing
- —
- Monthly P&I
- —
- Monthly cashflow
- —
- DSCR
- —
- Eligible?
- —
Personal DTI + credit; lowest rate.
DSCR
20% down · 8.5% · 30yr
- Down + closing
- —
- Monthly P&I
- —
- Monthly cashflow
- —
- DSCR
- —
- Eligible?
- —
No personal income docs; deal must DSCR.
Hard money
10% down · 12.0% · 12mo
- Down + closing
- —
- Monthly P&I
- —
- Monthly cashflow
- —
- DSCR
- —
- Eligible?
- —
Short-term bridge; refi at stabilization.
Rent comps 40 comps
| Address | Beds | Baths | Sqft | Rent | $/sqft | DOM | Units | Dist |
|---|---|---|---|---|---|---|---|---|
| 2585 Old Groves Rd Unit L203 Naples, FL | 2.0 | 2.0 | 1448 | $5,500 | $3.80 | 13d | 1 | 0.03mi |
| 7762 Gardner Dr #102 Naples, FL | 2.0 | 2.0 | 1607 | $6,000 | $3.73 | 23d | 1 | 0.09mi |
| 7518 Silver Trumpet Ln Unit Q102 Naples, FL | 2.0 | 2.0 | 1300 | $2,600 | $2.00 | 13d | 1 | 0.12mi |
| 2516 Orchid Bay Dr #203 Naples, FL | 2.0 | 2.0 | 1360 | $4,750 | $3.49 | 23d | 1 | 0.17mi |
| 7822 Gardner Dr Unit 6-101 Naples, FL | 2.0 | 2.0 | 1607 | $2,500 | $1.56 | 23d | 1 | 0.29mi |
| 2835 Mizzen Way Naples, FL | 3.0 | 2.0 | 1641 | $2,900 | $1.77 | 23d | 1 | 0.30mi |
| 2460 Old Groves Rd Unit E102 Naples, FL | 2.0 | 2.0 | 1226 | $2,400 | $1.96 | 13d | 1 | 0.31mi |
| 7416 Plumbago Bridge Rd #103 Naples, FL | 2.0 | 2.0 | 1223 | $2,400 | $1.96 | 13d | 1 | 0.33mi |
| 2730 Sailors Way Naples, FL | 3.0 | 3.0 | 1700 | $9,000 | $5.29 | 23d | 1 | 0.35mi |
| 2864 Mizzen Way Unit Y106 Naples, FL | 2.0 | 2.0 | 1350 | $5,200 | $3.85 | 13d | 1 | 0.35mi |
| 7710 Ahoy Ave Naples, FL | 3.0 | 2.0 | 1580 | $2,950 | $1.87 | 23d | 1 | 0.36mi |
| 2729 Branch Ln Naples, FL | 3.0 | 2.0 | 1800 | $3,650 | $2.03 | 23d | 1 | 0.40mi |
| 2662 Bolero Dr Unit 10 Naples, FL | 2.0 | 2.0 | 1768 | $15,000 | $8.48 | 23d | 1 | 0.42mi |
| 2885 Citrus Lake Dr Unit N103 Naples, FL | 2.0 | 2.0 | 1249 | $5,250 | $4.20 | 13d | 1 | 0.42mi |
| 2608 Sailors Way #122 Naples, FL | 2.0 | 2.0 | 1387 | $5,500 | $3.97 | 23d | 1 | 0.45mi |
| 2654 Bolero Dr Unit 8-1 Naples, FL | 3.0 | 2.0 | 1768 | $20,000 | $11.31 | 23d | 1 | 0.45mi |
| 2625 Estrella Dr Unit 15-1 Naples, FL | 3.0 | 2.0 | 1768 | $18,000 | $10.18 | 23d | 1 | 0.45mi |
| 2860 Citrus Lake Dr Unit R202 Naples, FL | 3.0 | 2.0 | 1590 | $5,000 | $3.14 | 23d | 1 | 0.54mi |
| 2860 Citrus Lake Dr Unit R-202 Naples, FL | 3.0 | 2.0 | 1590 | $5,000 | $3.14 | 13d | 1 | 0.54mi |
| 3048 Horizon Ln #1104 Naples, FL | 3.0 | 2.5 | 1818 | $5,150 | $2.83 | 23d | 1 | 0.54mi |
| 2880 Citrus Lake Dr Unit Q201 Naples, FL | 3.0 | 2.0 | 1590 | $2,495 | $1.57 | 13d | 1 | 0.55mi |
| 2731 Citrus Lake Dr #202 Naples, FL | 2.0 | 2.0 | 1260 | $2,500 | $1.98 | 13d | 1 | 0.56mi |
| 2711 Citrus Lake Dr Unit F305 Naples, FL | 3.0 | 2.0 | 1480 | $5,500 | $3.72 | 13d | 1 | 0.56mi |
| 2711 Citrus Lake Dr Unit F302 Naples, FL | 2.0 | 2.0 | 1272 | $4,500 | $3.54 | 13d | 1 | 0.56mi |
| 2671 Citrus Lake Dr Unit E-201 Naples, FL | 3.0 | 2.0 | 1380 | $5,250 | $3.80 | 13d | 1 | 0.56mi |
| 2671 Citrus Lake Dr Unit E-303 Naples, FL | 2.0 | 2.0 | 1380 | $3,500 | $2.54 | 13d | 1 | 0.56mi |
| 3051 Horizon Ln #1803 Naples, FL | 2.0 | 2.0 | 1482 | $5,100 | $3.44 | 23d | 1 | 0.58mi |
| 2738 Tiburon Blvd E Unit B405 Naples, FL | 2.0 | 2.5 | 1865 | $12,000 | $6.43 | 13d | 1 | 0.58mi |
| 2651 Citrus Lake Dr Unit D302 Naples, FL | 2.0 | 2.0 | 1250 | $5,000 | $4.00 | 13d | 1 | 0.60mi |
| 3062 Driftwood Way #4301 Naples, FL | 3.0 | 2.0 | 1573 | $6,500 | $4.13 | 23d | 1 | 0.60mi |
| 3320 Bermuda Isle Cir Naples, FL | 1.0–3.0 | 1.0–2.0 | 1134 | $2,390 | $2.11 | 13d | 45 | 0.62mi |
| 2611 Citrus Lake Dr Unit C-203 Naples, FL | 3.0 | 2.0 | 1710 | $5,500 | $3.22 | 13d | 1 | 0.62mi |
| 3015 Horizon Ln #2702 Naples, FL | 3.0 | 2.0 | 1399 | $1,790 | $1.28 | 23d | 1 | 0.63mi |
| 2541 Citrus Lake Dr Unit A-205 Naples, FL | 3.0 | 2.0 | 1590 | $5,250 | $3.30 | 13d | 1 | 0.63mi |
| 3035 Horizon Ln #2206 Naples, FL | 2.0 | 2.0 | 1246 | $6,000 | $4.82 | 23d | 1 | 0.64mi |
| 2728 Tiburon Blvd E Naples, FL | 2.0–3.0 | 2.5–3.5 | 2425 | $4,500 | $1.86 | 13d | 3 | 0.64mi |
| 2728 Tiburon Blvd E Unit A-104 Naples, FL | 2.0 | 2.0 | 1465 | $12,500 | $8.53 | 13d | 1 | 0.65mi |
| 2728 Tiburon Blvd E Unit A-203 Naples, FL | 2.0 | 2.0 | 1465 | $11,000 | $7.51 | 13d | 1 | 0.65mi |
| 2728 Tiburon Blvd E Unit A204 Naples, FL | 2.0 | 2.0 | 1470 | $8,500 | $5.78 | 13d | 1 | 0.65mi |
| 2748 Tiburon Blvd E Unit C202 Naples, FL | 2.0 | 2.5 | 1865 | $15,000 | $8.04 | 13d | 1 | 0.65mi |
HOA detail condo
- Monthly dues
- $832 · $9,984/yr
- Likely covers
- security
- Assessments
- None detected in remarks — confirm with the listing agent.
Listing history 16 events
-
2026-06-18days on market $375,000 Active 133 DOM
-
2026-06-17days on market $375,000 Active 132 DOM
-
2026-06-16days on market $375,000 Active 131 DOM
-
2026-06-15days on market $375,000 Active 130 DOM
-
2026-06-14days on market $375,000 Active 128 DOM
-
2026-06-10days on market $375,000 Active 125 DOM
-
2026-06-09days on market $375,000 Active 124 DOM
-
2026-06-08days on market $375,000 Active 123 DOM
-
2026-06-07days on market $375,000 Active 122 DOM
-
2026-06-03days on market $375,000 Active 118 DOM
-
2026-06-02days on market $375,000 Active 117 DOM
-
2026-06-01days on market $375,000 Active 116 DOM
-
2026-05-31days on market $375,000 Active 115 DOM
-
2026-05-30days on market $375,000 Active 114 DOM
-
2026-02-05$375,000 Active
-
1996-05-08soldstatus $117,200
ⓘ Source: listings_history table (triggers on properties + properties_extension) + one-shot
backfill from property_details.listing_events for pre-trigger history.
Tax reassessment forecast FL · Resets to sale price
- Current annual tax
- $3,150 · $262/mo
- Projected year-2 tax
- $3,150 · $262/mo
- Expected delta
- $0/yr ($0/mo · 0.0%)
ⓘ Screening estimate from a state-policy table — verify with the county assessor before closing.
Climate risk First Street
- Flood 3/10 Moderate FEMA zone X (unshaded) · 9% chance over 30 yrs
- Wildfire 1/10 Low
- Heat 10/10 Extreme 7 d/yr ≥107°F today · 27 d/yr by 30 yrs out
- Wind 10/10 Extreme 99% chance of damaging wind over 30 yrs
- Air quality 2/10 Low 2 unhealthy d/yr today · 2 by 30 yrs out
Nearby sold comps map
Loading sold comps map…
Walkable amenities ~0.75 mi
Loading nearby amenities…
Taxation est. · year 1
- Rental income
- $53,797
- − Mortgage interest
- −$21,006
- − Property taxes
- −$3,150
- − Insurance
- −$1,875
- − Repairs & maintenance
- −$4,304
- − Management
- −$4,304
- − HOA
- −$9,984
- − Depreciation
- −$10,909
- Taxable loss
- −$1,734
- Est. tax savings @ 24.0%
- +$416
- After-tax cash flow
- $4,309/yr
For passive investors: Depreciation is non-cash, so a rental often shows a tax loss while cash-flowing — sheltering income. Rental losses are passive: they offset passive income freely, and up to $25,000/yr can offset ordinary (W-2) income if you actively participate and your MAGI is under $100k (phasing out to $0 by $150k); unused losses carry forward. On sale, claimed depreciation is recaptured at up to 25%, and gains may owe capital-gains tax (a 1031 exchange can defer both). Figures are a year-1 estimate at your 24.0% rate — not tax advice; consult a CPA.
Schools (NCES district)
- District
- Collier
- NCES district ID
- 1200330
- Math proficiency
- 60% ▼ -4.00%
- Reading proficiency
- 56% ▼ -2.00%
- Median HH income
- $58,275
- Composite
- 50.23/100
- National rank
- #1892
- State rank
- #16 of 73 in FL
Livability — Pelican Marsh
No livability data for this city. (Only ~50 U.S. cities are tracked.)
Census & demographics
- County
- Collier County · 396,295 people
- Metro
- Naples-Marco Island, FL
- Population (ZIP)
- 27,273
- Household income
- $92,259
- Rent vs Own
- Severe rent burden
- 1712.0
Population outlook (Collier County) Hauer SSP2
- Today (2025)
- 420,858 people
- By 2030
- 450,054 · +6.9%
- By 2040
- 502,232 · +19.3%
- By 2050
- 544,932 · +29.5%
- By 2075
- 627,203 · +49.0%
- By 2100
- 659,015 · +56.6%
Race, ethnicity, and origin ACS 2023
- Neighborhood character
- Predominantly White (78%)
- Race & ethnicity
- White 78% Hispanic / Latino 11% Two or more races 9% Black 4% Asian 4%
- Hispanic origin (detail)
- Mexican 1% Puerto Rican 1% Cuban 3%
- Common ancestry
- Romanian 5% Scotch-Irish 3% Lithuanian 2%
- Foreign-born
- 20% · Canada, Jamaica, Vietnam
- Languages at home
- 77% English-only · Spanish 10% Other Indo-European 5% Russian/Polish/Slavic 3%
Political lean MEDSL · Collier
- 2024 margin
- Solid R (+33.1) · D 33.1% · R 66.2%
- 2008→2024 swing
- -10.6pp toward R · 2008: -22.5pp · 2024: -33.1pp
- All cycles
- 2024: R+33.1 2020: R+24.7 2016: R+26.0 2012: R+30.1 2008: R+22.5
Not yet ingested
- Civics
- —
Market trends
- HPI YoY
- ▲ 0.29%
- Current HPI
- 279.357
- Rent YoY
- ▲ 0.92%
- Metro
- Naples-Marco Island, FL
- State GDP YoY
- ▲ 3.28%
- F500 in state
- 36
Industry mix (Fortune 500 HQ in FL)
| Industry | F500 HQs | Revenue |
|---|---|---|
| Industrial Technology | 2 | $29B |
|
||
| Insurance | 2 | $17B |
|
||
| Retail | 1 | $60B |
|
||
| Technology Distribution | 1 | $58B |
|
||
| Homebuilding | 1 | $35B |
|
||
| Technology Manufacturing | 1 | $35B |
|
||
Price history
+220.0% since first listed2 events — show timeline
- 2026-02-05 Listed $375,000 NAPLESMLS
- 1996-05-08 Sold (Public Records) $117,200 Public Records
Property tax history
+5.6%/yrLatest (2025): $3,150 · +4.8% YoY. Source: county tax records.
Cash-flow waterfall
monthlySold comps — $/sqft
last 12 mo · ≤1 miLoading sold comps…