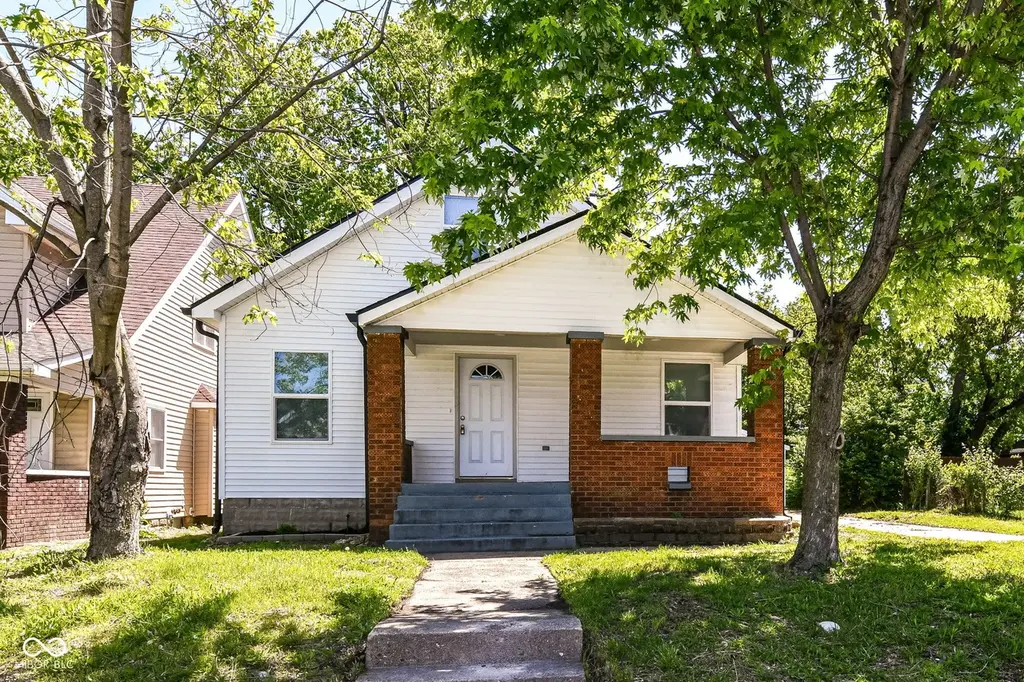
1031 Blaine Ave · Indianapolis city (balance), IN
Flood risk 1/10 · Minimal
- FEMA flood zone
- X (unshaded)
- Chance of flooding over 30 yrs
- 0.0%
- Est. flood insurance / yr
- $473 – $860
Fire risk 1/10 · Minimal
- Est. fire insurance / yr
- $717 – $1,331
Heat risk 4/10 · Minor
- Hot days now (above 102°F)
- 7 days/yr
- Hot days in 30 yrs
- 19 days/yr
Wind risk 2/10 · Minimal
- Chance of severe wind over 30 yrs
- 0.0%
Air-quality risk 4/10 · Minor
- Unhealthy air days now
- 5 days/yr
- Unhealthy air days in 30 yrs
- 7 days/yr
Risk factors via First Street. Map © Google.
Why this score? — see what drove the C grade
The composite is a weighted blend of 9 inputs, each scored 0–100. Each bar is that input's sub-score; the figure is the points it added to the 100-point composite (weight × sub-score).
- Cash flow +23.8/30.0
- ARV discount +11.7/15.0
- DSCR +7.7/10.0
- 1% rule +5.2/10.0
- Rent growth +2.9/5.0
- Livability +2.5/5.0
- Condition / age +2.5/5.0
- Schools +1.4/10.0
- Appreciation +0.0/10.0
$169,900
🖨 Deal sheet 📄 Offer letter ✓ Due diligence
Listing remarks MLS
This 0.22 acres lot offers a rare chance to start fresh and create something truly special. While the previous structure was lost to fire, this is your chance to wipe the lot clean making way for a brand-new vision to take root. Whether you're looking to build your dream home from the ground up or seeking a savvy investment opportunity to flip and resell, this structure can be demolished and ready for full potential. Located in an established neighborhood with existing utilities and infrastructure already in place, this is your opportunity to bring your plans to life without starting from scratch.
Key facts
- Open-plan kitchen
- Central island
- Charming porch
Tags
Property features AI
Exterior
- Parking: Detached 2-car garage with garage door opener; Guest street parking
- Utilities: Public water; Municipal sewer connected; Regular solid waste service
- Home design: Single family residence; Two levels
- Construction: Brick construction; Block foundation
- Exterior features: Covered patio/porch
Interior
- Kitchen: Electric cooktop; Electric oven; Range hood; Down draft; Dishwasher; Refrigerator; Disposal; Exhaust fan
- Bedrooms: Three bedrooms total — two on the main level and one on the upper level; Primary bedroom includes a walk-in closet
- Bathrooms: Two full bathrooms; Primary bathroom features a full shower stall and suite layout
- Heating & cooling: Forced air heating (natural gas); Central air conditioning
- Interior features: Breakfast bar; High ceilings; Kitchen island; Pantry; Walk-in closet(s); Painted woodwork
- Laundry & utility: Electric water heater
Neighborhood map
What this means for you Summary
Snapshot
- This is a 3-bed/1.0-bath single-family listed at $170k.
Deal economics
- At list price, monthly cash flow is $325 ($4k/yr) — positive.
- The deal already cash-flows at list — no discount required.
- Meets the 1% rule at list price ($2k rent vs $170k).
- Cap rate 8.6% vs local median 4.4% in Indianapolis city (balance) — top-decile yield for the area; either an underpriced asset or a hidden risk that comps aren't pricing in. Stress-test before assuming the spread holds.
Location & tenants
- Location reads: area grade C — affects rentability + tenant quality, not the cash-flow math above.
- Indianapolis Public Schools (urban): math 14% / reading 20% proficiency, ranked #286 of 301 in IN (top 95%) — low school quality limits family demand, transient renter base, plan for 1-2y turnover; 77% free/reduced lunch — lower-income household profile, screen leases tightly.
- Market conditions: Rents rising (+1.8%/yr); 43 active listings in the ZIP; 14 comparable units currently listed for rent nearby; rentals at typical pace (median 16d on market — plan ~3-4 weeks tenant-placement turnaround); 1,906 units permitted in Marion County in 2024 (621 in 5+ unit buildings).
- This rent runs 32% of the median local income ($65k/yr) — at the standard rent-burdened threshold; future hikes will face affordability resistance.
Forward outlook
- Local home prices are declining (-3.0%/yr); year-one equity from $1k of loan paydown is wiped out by about $5k of value loss. Plan a longer hold.
- Marion County population projected at +18% by 2050 — long-run rental-demand tailwind backs the buy-and-hold thesis.
Negotiation context
- Only 1 days on market — expect competitive offers; lowballing is unlikely to land.
- 5 sale attempts since 4y ago with the ask held roughly flat each time — persistent listings suggest the price (not the market) is what's stuck; bring a comps-based counter.
- Current owner paid $20k; list at $170k implies a 750% gain — meaningful room to come down on a strong offer.
Risks & watch-outs
- Watch-outs: built in 1920 — expect roof / HVAC / electrical / plumbing capex.
Questions for the listing agent
- Built in 1920 — when were the roof, HVAC, electrical panel, plumbing, and water heater last replaced?
- Is there a deadline driving the sale (1031 exchange, divorce, estate, relocation)? That informs how much negotiation room exists.
- What's the average days-on-market for RENTAL listings here right now (not sales)? A rising rental-DOM trend means longer vacancies and softer asking-rent achievability than the comps imply.
- What's the recent tenant-quality profile in this submarket — average credit score on applications, eviction rate, late-payment / NSF rate, and stable-employment percentage? A property-management company in the area should have these aggregated.
- How much new for-sale + rental construction is in the pipeline within 1–3 miles? Heavy new supply typically softens prices + rents 12–24 months out; constrained supply supports both.
Investment metrics
- 1% rule
- 1.02% ✓
- Cap rate
- 8.59%
- Cash-on-cash
- 8.20%
- DSCR
- 1.37
- GRM
- 8.2
CMA / ARV
- ARV (median comp)
- $187,180
- List price
- $169,900
- Delta
- -9.23%
- Verdict
- FAIR
- Comps
- 11 within 1.0 mi
Show comp detail 12 sales within ~0.75 mi
| Address | Dist | Beds/Ba | Sqft | Sold | Price | $/sf | Match |
|---|---|---|---|---|---|---|---|
| 1922 Westview Dr | 0.39mi | 2/1.0 (-1) | 1,330 (+7%) | 4mo | $144,500 | $109 | 62 |
| 1252 Kappes St | 0.45mi | 3/1.0 | 1,296 (+4%) | 13mo | $177,000 | $137 | 61 |
| 907 Warren Ave | 0.40mi | 4/1.0 (+1) | 1,175 (-5%) | 8mo | $159,900 | $136 | 61 |
| 1746 Lambert St | 0.35mi | 3/2.0 | 1,131 (-9%) | 6mo | $134,000 | $118 | 60 |
| 1610 Howard St | 0.42mi | 3/1.0 | 1,207 (-3%) | 22mo | $170,000 | $141 | 57 |
| 1260 S Reisner St SW | 0.31mi | 3/2.0 | 1,144 (-8%) | 15mo | $134,000 | $117 | 56 |
| 1131 S Pershing Ave | 0.60mi | 3/1.0 | 1,332 (+7%) | 12mo | $166,000 | $125 | 50 |
| 1801 W Morris St | 0.29mi | 3/1.5 | 1,056 (-15%) | 12mo | $189,000 | $179 | 50 |
| 837 Birch Ave | 0.49mi | 2/2.0 (-1) | 1,100 (-11%) | 16mo | $180,000 | $164 | 36 |
| 1367 S Sheffield Ave | 0.67mi | 3/1.0 | 1,090 (-12%) | 19mo | $165,000 | $151 | 32 |
| 1445 S Belmont Ave | 0.68mi | 3/2.0 | 1,062 (-14%) | 13mo | $130,000 | $122 | 29 |
| 2218 Howard St | 0.71mi | 2/1.5 (-1) | 1,136 (-8%) | 21mo | $75,000 | $66 | 28 |
Match score weights: distance 35% · size 25% · config 20% · recency 20%. Top-matched comps best support the ARV.
Projected returns pro-forma
-3.0% appreciation · 1.79% rent growth · sell at horizon
- IRR
- -5.1%
- Equity multiple
- 0.81×
- Total profit
- $-8,956
- Equity at exit
- $25,333
- IRR
- 3.2%
- Equity multiple
- 1.22×
- Total profit
- $10,309
- Equity at exit
- $14,690
Cash invested: $47,572 (down + closing). Projections, not guarantees.
Landlord ↔ Tenant lean methodology
- Overall (STATE)
- 90 Strongly Landlord-Friendly
- State Indiana
- 90 Strongly Landlord-Friendly · R+11
- County
- — inherits STATE
- City
- — inherits STATE
ZIP-level market 46221
- Home prices YoY
- -23.7%
- Rents YoY
- 1.8%
- Active inventory
- 43
- Price-to-rent
- 8.2×
Monthly cashflow live
- Estimated rent
- $1,732 high interval (Pro) →
- Mortgage (P&I)
- −$891
- Tax from tax record
- −$81 /mo · $971/yr
- Insurance
- −$71
- HOA
- −$0
- Vacancy / Maint / Mgmt
- −$364
- Net cashflow
- $325
Break-even live
UW: 25.0% down · 7.5% · 30yr · 1.5% tax · 5.0% vac · 8.0% maint · 8.0% mgmt
Financing live
Cash to close
- Down payment
- $42,475
- Closing costs
- $5,097
- Reserves months
- —
- Total cash needed
- —
Loan-product check · same deal, 3 products live
Conventional
25% down · 7.5% · 30yr
- Down + closing
- —
- Monthly P&I
- —
- Monthly cashflow
- —
- DSCR
- —
- Eligible?
- —
Personal DTI + credit; lowest rate.
DSCR
20% down · 8.5% · 30yr
- Down + closing
- —
- Monthly P&I
- —
- Monthly cashflow
- —
- DSCR
- —
- Eligible?
- —
No personal income docs; deal must DSCR.
Hard money
10% down · 12.0% · 12mo
- Down + closing
- —
- Monthly P&I
- —
- Monthly cashflow
- —
- DSCR
- —
- Eligible?
- —
Short-term bridge; refi at stabilization.
Rent comps 14 comps
| Address | Beds | Baths | Sqft | Rent | $/sqft | DOM | Units | Dist |
|---|---|---|---|---|---|---|---|---|
| 1105 Blaine Ave Indianapolis, IN | 1.0–2.0 | 1.0–2.5 | 1157 | $1,795 | $1.55 | 23d | 1 | 0.07mi |
| 1801 W Morris St Indianapolis, IN | 3.0 | 1.5 | 1056 | $1,795 | $1.70 | 43d | 1 | 0.31mi |
| 2015 W Wilkins St Indianapolis, IN | 3.0 | 1.0 | 1250 | $1,895 | $1.52 | 43d | 1 | 0.44mi |
| 1339 W Lee St Indianapolis, IN | 2.0 | 1.5 | 960 | $975 | $1.02 | 3d | 1 | 0.45mi |
| 101 S Harding St Apt 307 Indianapolis, IN | 2.0 | 2.0 | 970 | $1,685 | $1.74 | 2d | 1 | 0.82mi |
| 841 S Addison St Indianapolis, IN | 2.0 | 1.0 | 750 | $1,295 | $1.73 | 43d | 1 | 0.84mi |
| 1909 S Pershing Ave Indianapolis, IN | 3.0 | 1.5 | 728 | $1,750 | $2.40 | 3d | 1 | 1.08mi |
| 210 N Richland St Indianapolis, IN | 4.0 | 2.0 | 1062 | $1,625 | $1.53 | 13d | 1 | 1.10mi |
| 2127 Haines Ave Indianapolis, IN | 3.0 | 2.0 | 1250 | $2,000 | $1.60 | 1d | 1 | 1.11mi |
| 86 N Holmes Ave Indianapolis, IN | 2.0 | 1.0 | 978 | $1,050 | $1.07 | 16d | 1 | 1.34mi |
| 1911 Wilcox St Indianapolis, IN | 2.0 | 1.0 | 896 | $1,150 | $1.28 | 43d | 1 | 1.40mi |
| 460 N White River Parkway Dr W Indianapolis, IN | 2.0 | 1.0 | 681 | $1,725 | $2.53 | 2d | 14 | 1.42mi |
| 264 N Holmes Ave Indianapolis, IN | 2.0 | 1.0 | 1092 | $1,200 | $1.10 | 10d | 1 | 1.43mi |
| 240 N Warman Ave Indianapolis, IN | 2.0–3.0 | 1.0–2.0 | 1052 | $1,400 | $1.33 | 20d | 5 | 1.46mi |
Listing history 11 events
-
2026-05-17status Pending 739-char remark
-
2026-05-14$169,900 Active 739-char remark
-
2025-07-18soldstatus $20,000 Closed 605-char remark
Show marketing remark (605 chars)
This 0.22 acres lot offers a rare chance to start fresh and create something truly special. While the previous structure was lost to fire, this is your chance to wipe the lot clean making way for a brand-new vision to take root. Whether you're looking to build your dream home from the ground up or seeking a savvy investment opportunity to flip and resell, this structure can be demolished and ready for full potential. Located in an established neighborhood with existing utilities and infrastructure already in place, this is your opportunity to bring your plans to life without starting from scratch.
-
2025-06-17status Pending 605-char remark
Show marketing remark (605 chars)
This 0.22 acres lot offers a rare chance to start fresh and create something truly special. While the previous structure was lost to fire, this is your chance to wipe the lot clean making way for a brand-new vision to take root. Whether you're looking to build your dream home from the ground up or seeking a savvy investment opportunity to flip and resell, this structure can be demolished and ready for full potential. Located in an established neighborhood with existing utilities and infrastructure already in place, this is your opportunity to bring your plans to life without starting from scratch.
-
2025-06-14$20,000 Active 605-char remark
Show marketing remark (605 chars)
This 0.22 acres lot offers a rare chance to start fresh and create something truly special. While the previous structure was lost to fire, this is your chance to wipe the lot clean making way for a brand-new vision to take root. Whether you're looking to build your dream home from the ground up or seeking a savvy investment opportunity to flip and resell, this structure can be demolished and ready for full potential. Located in an established neighborhood with existing utilities and infrastructure already in place, this is your opportunity to bring your plans to life without starting from scratch.
-
2025-02-28status Pending
Show marketing remark (477 chars)
Fixxer-upper in an up and coming area**Roof replaced on the house and garage 7/2023**3 Bedrooms on the Main level, Living Room, Dining Room, and Kitchen***2 Bedrooms in upstairs attic**Furnace is 6 years old**Sewer line is 3 years old**Full basement**Large covered porch***Minutes from White River State Park, Back 9 Golf, Rhodius Park, Lucas Oil Stadium, Victory Field, Biltwell Event Center, Indianapolis Zoo, Convention Center**Detached 2 car garage**Immediate possession**
-
2025-02-28soldstatus $110,000 Closed
Show marketing remark (477 chars)
Fixxer-upper in an up and coming area**Roof replaced on the house and garage 7/2023**3 Bedrooms on the Main level, Living Room, Dining Room, and Kitchen***2 Bedrooms in upstairs attic**Furnace is 6 years old**Sewer line is 3 years old**Full basement**Large covered porch***Minutes from White River State Park, Back 9 Golf, Rhodius Park, Lucas Oil Stadium, Victory Field, Biltwell Event Center, Indianapolis Zoo, Convention Center**Detached 2 car garage**Immediate possession**
-
2024-02-22status Active
Show marketing remark (477 chars)
Fixxer-upper in an up and coming area**Roof replaced on the house and garage 7/2023**3 Bedrooms on the Main level, Living Room, Dining Room, and Kitchen***2 Bedrooms in upstairs attic**Furnace is 6 years old**Sewer line is 3 years old**Full basement**Large covered porch***Minutes from White River State Park, Back 9 Golf, Rhodius Park, Lucas Oil Stadium, Victory Field, Biltwell Event Center, Indianapolis Zoo, Convention Center**Detached 2 car garage**Immediate possession**
-
2024-02-19status Pending
Show marketing remark (477 chars)
Fixxer-upper in an up and coming area**Roof replaced on the house and garage 7/2023**3 Bedrooms on the Main level, Living Room, Dining Room, and Kitchen***2 Bedrooms in upstairs attic**Furnace is 6 years old**Sewer line is 3 years old**Full basement**Large covered porch***Minutes from White River State Park, Back 9 Golf, Rhodius Park, Lucas Oil Stadium, Victory Field, Biltwell Event Center, Indianapolis Zoo, Convention Center**Detached 2 car garage**Immediate possession**
-
2023-05-08$119,900 Active
Show marketing remark (477 chars)
Fixxer-upper in an up and coming area**Roof replaced on the house and garage 7/2023**3 Bedrooms on the Main level, Living Room, Dining Room, and Kitchen***2 Bedrooms in upstairs attic**Furnace is 6 years old**Sewer line is 3 years old**Full basement**Large covered porch***Minutes from White River State Park, Back 9 Golf, Rhodius Park, Lucas Oil Stadium, Victory Field, Biltwell Event Center, Indianapolis Zoo, Convention Center**Detached 2 car garage**Immediate possession**
-
2022-09-08$79,900 Active
ⓘ Source: listings_history table (triggers on properties + properties_extension) + one-shot
backfill from property_details.listing_events for pre-trigger history.
Tax reassessment forecast IN · Partial reset (capped growth)
- Current annual tax
- $971 · $81/mo
- Projected year-2 tax
- $1,208 · $101/mo
- Expected delta
- +$237/yr (+$20/mo · 24.4%)
ⓘ Screening estimate from a state-policy table — verify with the county assessor before closing.
Climate risk First Street
- Flood 1/10 Low FEMA zone X (unshaded) · 0% chance over 30 yrs
- Wildfire 1/10 Low
- Heat 4/10 Moderate 7 d/yr ≥102°F today · 19 d/yr by 30 yrs out
- Wind 2/10 Low 0% chance of damaging wind over 30 yrs
- Air quality 4/10 Moderate 5 unhealthy d/yr today · 7 by 30 yrs out
Nearby sold comps map
Loading sold comps map…
Walkable amenities ~0.75 mi
Loading nearby amenities…
Taxation est. · year 1
- Rental income
- $20,778
- − Mortgage interest
- −$9,517
- − Property taxes
- −$971
- − Insurance
- −$850
- − Repairs & maintenance
- −$1,662
- − Management
- −$1,662
- − Depreciation
- −$4,943
- Taxable income
- $1,174
- Est. tax owed @ 24.0%
- −$282
- After-tax cash flow
- $3,621/yr
For passive investors: Depreciation is non-cash, so a rental often shows a tax loss while cash-flowing — sheltering income. Rental losses are passive: they offset passive income freely, and up to $25,000/yr can offset ordinary (W-2) income if you actively participate and your MAGI is under $100k (phasing out to $0 by $150k); unused losses carry forward. On sale, claimed depreciation is recaptured at up to 25%, and gains may owe capital-gains tax (a 1031 exchange can defer both). Figures are a year-1 estimate at your 24.0% rate — not tax advice; consult a CPA.
Schools (NCES district)
- District
- Indianapolis Public Schools
- NCES district ID
- 1804770
- Math proficiency
- 14% ▼ -7.00%
- Reading proficiency
- 20% ▼ -3.00%
- Median HH income
- $32,034
- Composite
- 13.69/100
- National rank
- #9499
- State rank
- #286 of 301 in IN
Livability — Indianapolis city (balance)
No livability data for this city. (Only ~50 U.S. cities are tracked.)
Census & demographics
- Census place
- Indianapolis city (balance), IN
- County
- Marion County · 998,460 people
- City population
- 881,119
- Metro
- Indianapolis-Carmel-Anderson, IN
- Population (ZIP)
- 27,027
- Household income
- $65,280
- Rent vs Own
- Severe rent burden
- 1011.0
Population outlook (Marion County) Hauer SSP2
- Today (2025)
- 1,025,572 people
- By 2030
- 1,065,727 · +3.9%
- By 2040
- 1,141,577 · +11.3%
- By 2050
- 1,208,920 · +17.9%
- By 2075
- 1,367,288 · +33.3%
- By 2100
- 1,438,201 · +40.2%
Race, ethnicity, and origin ACS 2023
- Neighborhood character
- Predominantly White (69%)
- Race & ethnicity
- White 69% Black 13% Hispanic / Latino 13% Two or more races 7%
- Hispanic origin (detail)
- Mexican 7%
- Common ancestry
- Italian 2% Iranian 2% Lithuanian 2%
- Foreign-born
- 9% · Canada, China
- Languages at home
- 87% English-only · Spanish 9% Arabic 1%
Political lean MEDSL · Marion
- 2024 margin
- Strong D (+27.7) · D 63.0% · R 35.3% · Other 1.7%
- 2008→2024 swing
- -0.7pp no change · 2008: 28.4pp · 2024: 27.7pp
- All cycles
- 2024: D+27.7 2020: D+29.1 2016: D+22.8 2012: D+22.2 2008: D+28.4
Not yet ingested
- Civics
- —
Market trends
- HPI YoY
- ▼ -97.56%
- Current HPI
- 313.4711
- Rent YoY
- ▲ 1.79%
- Metro
- Indianapolis-Carmel-Anderson, IN
- State GDP YoY
- ▲ 2.90%
- F500 in state
- 18
Industry mix (Fortune 500 HQ in IN)
| Industry | F500 HQs | Revenue |
|---|---|---|
| Industrial Machinery | 2 | $37B |
|
||
| Healthcare | 1 | $177B |
|
||
| Pharmaceuticals | 1 | $45B |
|
||
| Metals / Steel | 1 | $18B |
|
||
| Agriculture | 1 | $17B |
|
||
| Packaging | 1 | $12B |
|
||
Price history
+112.6% since first listed11 events — show timeline
- 2026-05-17 Pending — MIBOR as Distributed by MLS Grid
- 2026-05-14 Listed $169,900 MIBOR as Distributed by MLS Grid
- 2025-07-18 Sold (MLS) $20,000 MIBOR as Distributed by MLS Grid
- 2025-06-17 Pending — MIBOR as Distributed by MLS Grid
- 2025-06-14 Listed $20,000 MIBOR as Distributed by MLS Grid
- 2025-02-28 Pending — MIBOR as Distributed by MLS Grid
- 2025-02-28 Sold (MLS) $110,000 MIBOR as Distributed by MLS Grid
- 2024-02-22 Relisted — MIBOR as Distributed by MLS Grid
- 2024-02-19 Pending — MIBOR as Distributed by MLS Grid
- 2023-05-08 Listed $119,900 MIBOR as Distributed by MLS Grid
- 2022-09-08 Listed $79,900 MIBOR as Distributed by MLS Grid
Property tax history
+11.2%/yrLatest (2025): $971 · +10.3% YoY. Source: county tax records.
Cash-flow waterfall
monthlySold comps — $/sqft
last 12 mo · ≤1 miLoading sold comps…