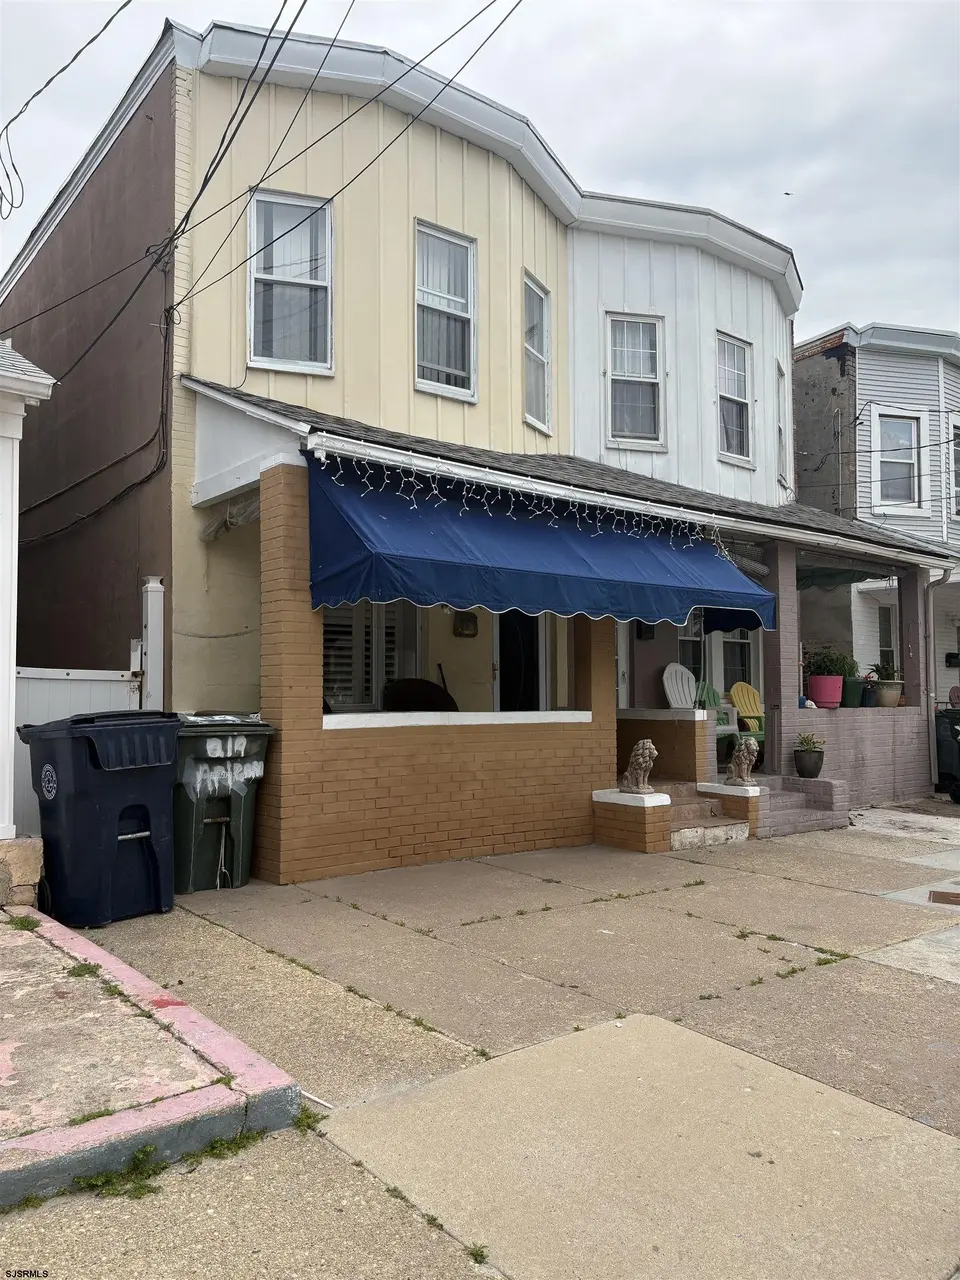
219 Arizona Ave · Atlantic City, NJ
Flood risk 10/10 · Severe
- FEMA flood zone
- AE
- Chance of flooding over 30 yrs
- 0.99%
- Est. flood insurance / yr
- $1,737 – $8,500
Fire risk 1/10 · Minimal
- Est. fire insurance / yr
- $526 – $976
Heat risk 9/10 · Severe
- Hot days now (above 94°F)
- 7 days/yr
- Hot days in 30 yrs
- 16 days/yr
Wind risk 8/10 · Major
- Chance of severe wind over 30 yrs
- 80.0%
Air-quality risk 3/10 · Minor
- Unhealthy air days now
- 2 days/yr
- Unhealthy air days in 30 yrs
- 3 days/yr
Risk factors via First Street. Map © Google.
Why this score? — see what drove the B- grade
The composite is a weighted blend of 9 inputs, each scored 0–100. Each bar is that input's sub-score; the figure is the points it added to the 100-point composite (weight × sub-score).
- Cash flow +26.2/30.0
- ARV discount +15.0/15.0
- DSCR +8.9/10.0
- 1% rule +6.5/10.0
- Rent growth +3.9/5.0
- Livability +2.8/5.0
- Condition / age +2.5/5.0
- Schools +1.4/10.0
- Appreciation +0.0/10.0
$199,000
🖨 Deal sheet (PDF) 📄 Offer letter ✓ Due diligence
Listing remarks
Adorable townhouse boasting an open and inviting floor plan. The living room features plantation shutters, creating a warm and welcoming ambiance. The kitchen shines with lacquered white cabinets and a central gas cooktop, making it ideal for effortless entertaining. The practical utility room conveniently houses the heater, hot water heater, and clothes dryer. Access to the back patio is directly from the kitchen, providing seamless indoor-outdoor living. Upstairs, you'll find a comfortable arrangement of 3 bedrooms and 1 bath. The front porch, complete with an awning, offers the perfect spot for outdoor enjoyment, allowing you to relax and savor the refreshing ocean breezes. Property is b
Key facts
- Utility room
- Plantation shutters
- Central gas cooktop
Tags
Property features AI
Exterior
- Parking: No exterior parking; No garage
- Utilities: Public water; Public sewer; Gas water heater
- Home design: Brick exterior; For sale
- Construction: Over 25 years old
- Exterior features: Porch; Yellow-tan exterior color; Lot dimensions approximately 17 x 75; Lot frontage 17'; Property less than 1 acre; Not waterfront; Located in a floodplain
Interior
- Kitchen: Dishwasher; Gas stove; Refrigerator
- Flooring: Tile; Wall-to-wall over hardwood
- Bathrooms: 1 full bathroom
- Heating & cooling: Central air conditioning; Forced air heating (natural gas)
- Interior features: Blinds; 6 total rooms; Crawl space basement
- Laundry & utility: Dryer
Neighborhood map
What this means for you Summary
Snapshot
- This is a 3-bed/1.0-bath townhouse listed at $199k.
Deal economics
- At list price, monthly cash flow is $81 ($969/yr) — positive.
- The deal already cash-flows at list — no discount required.
- Meets the 1% rule at list price ($2k rent vs $199k).
- Recommended offer: $196k (1.5% below list) — sets the bar for market timing.
- Cap rate 9.4% vs local median 3.7% in Atlantic City — top-decile yield for the area; either an underpriced asset or a hidden risk that comps aren't pricing in. Stress-test before assuming the spread holds.
Location & tenants
- Location reads 55/100 on livability (#525 in NJ) — a working-class tenant base; expect higher turnover. Strengths: health & safety A; Watch: commute D, crime F, amenities F.
- Atlantic City School District (urban): math 9% / reading 26% proficiency, ranked #454 of 472 in NJ (top 96%) — low school quality limits family demand, transient renter base, plan for 1-2y turnover; 85% free/reduced lunch — lower-income household profile, screen leases tightly.
- Zoned schools: Texas Avenue School (math 10% / reading 26%, grade F, #1,049 of 1,303 statewide, top 81%, 498 students, 96% FRL); Atlantic City High School (math 12% / reading 32%, grade F, #346 of 399 statewide, top 88%, 1,764 students, 80% FRL) — zoned schools at 88% FRL track the district average.
- Market conditions: Rents rising fast (+5.5%/yr); 491 active listings in the ZIP; 23 comparable units currently listed for rent nearby; rentals at typical pace (median 23d on market — plan ~3-4 weeks tenant-placement turnaround); lower-income renter base — watch delinquency; 672 units permitted in Atlantic County in 2024 (258 in 5+ unit buildings).
- At $2,279/mo this rent would consume 67% of the median local household income ($41k/yr) (locally 3414% of renters already pay >50% of income on rent) — very limited rent-growth headroom before tenants either downsize or default.
Forward outlook
- Local home prices are declining (-3.0%/yr); year-one equity from $1k of loan paydown is wiped out by about $6k of value loss. Plan a longer hold.
- Atlantic County population projected at -12% by 2050 — secular population decline; favor cash flow + early exit over multi-decade hold.
Negotiation context
- It's been on market 25 days — a 2% lower offer ($196k) is reasonable based on typical stale-listing flexibility.
- 2 sale attempts since 16y ago; this cycle's ask has dropped $20k (9%) from the opening price — seller is motivated, your offer sets the floor, not the list.
- Current owner paid $30k; list at $199k implies a 563% gain — meaningful room to come down on a strong offer.
Risks & watch-outs
- Watch-outs: flood insurance adds $427/mo; built in 1900 — expect roof / HVAC / electrical / plumbing capex.
- Climate carrying-cost: in FEMA flood zone AE (mandatory federal flood insurance); severe wind risk, 80% chance of damaging wind over 30y; extreme-heat days projected 7→16/yr by 2055 (HVAC capex compounding) — expect insurance premiums to compound above CPI over the hold.
Questions for the listing agent
- Built in 1900 — when were the roof, HVAC, electrical panel, plumbing, and water heater last replaced?
- What's the actual annual flood-insurance premium (NFIP or private), and is the property in a SFHA with mandatory coverage?
- Is there a deadline driving the sale (1031 exchange, divorce, estate, relocation)? That informs how much negotiation room exists.
- Schools are F-rated, which usually means shorter tenancies and higher turnover. Who's the typical renter profile here, and what's been the actual vacancy rate?
- Crime grade is F in this area — have there been break-ins, vandalism, or insurance claims at this property in the last 3 years? What carrier currently insures it and at what premium?
- What's the average days-on-market for RENTAL listings here right now (not sales)? A rising rental-DOM trend means longer vacancies and softer asking-rent achievability than the comps imply.
- What's the recent tenant-quality profile in this submarket — average credit score on applications, eviction rate, late-payment / NSF rate, and stable-employment percentage? A property-management company in the area should have these aggregated.
- How much new for-sale + rental construction is in the pipeline within 1–3 miles? Heavy new supply typically softens prices + rents 12–24 months out; constrained supply supports both.
Investment metrics
- 1% rule
- 1.15% ✓
- Cap rate
- 9.35%
- Cash-on-cash
- 10.93%
- DSCR
- 1.49
- GRM
- 7.3
CMA / ARV
- ARV (on-the-fly)
- $264,040
- Comps found
- 12
Show comp detail 12 sales within ~0.75 mi
| Address | Dist | Beds/Ba | Sqft | Sold | Price | $/sf | Match |
|---|---|---|---|---|---|---|---|
| 26 N Georgia Ave Rear 3 | 0.26mi | 2/2.0 (-1) | 1,186 (+3%) | 2mo | $195,000 | $164 | 72 |
| 26 N Georgia Ave | 0.26mi | 2/2.0 (-1) | 1,186 (+3%) | 2mo | $195,000 | $164 | 72 |
| 2915 Fairmount Ave Ave | 0.24mi | 3/2.0 | 1,265 (+10%) | 8mo | $212,500 | $168 | 61 |
| 3101 BOARDWALK #2209-1 | 0.56mi | 2/2.0 (-1) | 1,100 (-4%) | 6mo | $310,000 | $282 | 53 |
| 2721 BOARDWALK #1611 | 0.48mi | 2/2.0 (-1) | 1,050 (-8%) | 4mo | $249,990 | $238 | 51 |
| 2721 Boardwalk # 711 #711 | 0.48mi | 2/2.0 (-1) | 1,029 (-10%) | 3mo | $265,000 | $258 | 49 |
| 3101 Boardwalk #1601-1 | 0.56mi | 2/2.0 (-1) | 1,060 (-8%) | 6mo | $250,000 | $236 | 47 |
| 3101 Boardwalk Unit 2402-2 | 0.56mi | 2/2.0 (-1) | 1,278 (+11%) | 3mo | $225,000 | $176 | 43 |
| 2721 Boardwalk #212 | 0.48mi | 2/1.0 (-1) | 1,000 (-13%) | 12mo | $229,900 | $230 | 41 |
| 3101 Boardwalk #1414-2 | 0.56mi | 2/1.5 (-1) | 978 (-15%) | 4mo | $150,000 | $153 | 39 |
| 3101 Boardwalk Unit 2112-2 | 0.52mi | 2/2.0 (-1) | 1,300 (+13%) | 11mo | $450,000 | $346 | 35 |
| 3101 Boardwalk #1204-1 | 0.56mi | 2/1.5 (-1) | 978 (-15%) | 8mo | $177,500 | $181 | 35 |
Match score weights: distance 35% · size 25% · config 20% · recency 20%. Top-matched comps best support the ARV.
Projected returns pro-forma
-3.0% appreciation · 5.52% rent growth · sell at horizon
- IRR
- -10.0%
- Equity multiple
- 0.62×
- Total profit
- $-20,931
- Equity at exit
- $29,672
- IRR
- 3.3%
- Equity multiple
- 1.27×
- Total profit
- $14,998
- Equity at exit
- $17,206
Cash invested: $55,720 (down + closing). Projections, not guarantees.
Landlord ↔ Tenant lean methodology
- Overall (STATE)
- 21 Tenant-Leaning
- State New Jersey
- 21 Tenant-Leaning · D+6
- County
- — inherits STATE
- City
- — inherits STATE
ZIP-level market 08401
- Home prices YoY
- -7.0%
- Rents YoY
- 5.5%
- Active inventory
- 491
- Price-to-rent
- 7.3×
Monthly cashflow live
- Estimated rent
- $2,279 high interval (Pro) →
- Mortgage (P&I)
- −$1,044
- Tax from tax record
- −$167 /mo · $2,001/yr
- Insurance
- −$83
- Flood insurance flood zone
- −$427 /mo · $5,118/yr
- HOA
- −$0
- Vacancy / Maint / Mgmt
- −$479
- Net cashflow
- $81
Break-even live
Sensitivity live
| Price | -10% $193 | -5% $137 | +0% $81 | +5% $24 | +10% $-32 |
|---|---|---|---|---|---|
| Rent | -10% $-99 | -5% $-9 | +0% $81 | +5% $171 | +10% $261 |
| Rate | -1.0pp $181 | -0.5pp $131 | base $81 | +0.5pp $29 | +1.0pp $-23 |
UW: 25.0% down · 7.5% · 30yr · 1.5% tax · 5.0% vac · 8.0% maint · 8.0% mgmt
Financing live
Cash to close
- Down payment
- $49,750
- Closing costs
- $5,970
- Reserves months
- —
- Total cash needed
- —
Loan-product check · same deal, 3 products live
Conventional
25% down · 7.5% · 30yr
- Down + closing
- —
- Monthly P&I
- —
- Monthly cashflow
- —
- DSCR
- —
- Eligible?
- —
Personal DTI + credit; lowest rate.
DSCR
20% down · 8.5% · 30yr
- Down + closing
- —
- Monthly P&I
- —
- Monthly cashflow
- —
- DSCR
- —
- Eligible?
- —
No personal income docs; deal must DSCR.
Hard money
10% down · 12.0% · 12mo
- Down + closing
- —
- Monthly P&I
- —
- Monthly cashflow
- —
- DSCR
- —
- Eligible?
- —
Short-term bridge; refi at stabilization.
Rent comps 23 comps
| Address | Beds | Baths | Sqft | Rent | $/sqft | DOM | Units | Dist |
|---|---|---|---|---|---|---|---|---|
| 4 Italy Ter Atlantic City, NJ | 3.0 | 1.0 | 1000 | $2,300 | $2.30 | 23d | 1 | 0.26mi |
| 100 N Chelsea Ave Unit 1 Atlantic City, NJ | 3.0 | 1.0 | 1200 | $15,000 | $12.50 | 23d | 1 | 0.34mi |
| 38 N Boston Ave Unit B Atlantic City, NJ | 2.0 | 2.0 | 800 | $2,400 | $3.00 | 15d | 1 | 0.50mi |
| 2021 Grant Ave Atlantic City, NJ | 3.0 | 1.0 | 1011 | $2,350 | $2.32 | 23d | 1 | 0.62mi |
| 2015 Grant Ave Atlantic City, NJ | 3.0 | 1.0 | 1056 | $2,325 | $2.20 | 23d | 1 | 0.63mi |
| 905 Keener Ave Atlantic City, NJ | 3.0 | 1.0 | 1059 | $1,900 | $1.79 | 23d | 1 | 0.65mi |
| 1916 Magellan Ave Atlantic City, NJ | 2.0 | 1.0 | 1478 | $1,850 | $1.25 | 23d | 1 | 0.65mi |
| 3636 Winchester Ave Atlantic City, NJ | 3.0 | 1.0 | 1094 | $1,995 | $1.82 | 23d | 1 | 0.67mi |
| 1724 Atlantic Ave Unit A1 Atlantic City, NJ | 3.0 | 1.0 | 950 | $2,300 | $2.42 | 23d | 1 | 0.73mi |
| 1724 Atlantic Ave Unit B2 Atlantic City, NJ | 2.0 | 1.0 | 750 | $1,495 | $1.99 | 23d | 1 | 0.73mi |
| 3809 Ventnor Ave #6 Atlantic City, NJ | 3.0 | 1.0 | 1500 | $2,100 | $1.40 | 23d | 1 | 0.80mi |
| 108 Lincoln Pl Apt A4 Atlantic City, NJ | 2.0 | 1.0 | 800 | $5,000 | $6.25 | 23d | 1 | 0.87mi |
| 512 N Harrisburg Ave Atlantic City, NJ | 3.0 | 2.0 | 1156 | $2,800 | $2.42 | 15d | 1 | 0.87mi |
| 3851 Boardwalk Atlantic City, NJ | 2.0 | 1.0–2.0 | 785 | $27,500 | $35.03 | 23d | 5 | 0.89mi |
| 1510 N Arkansas Ave Atlantic City, NJ | 3.0 | 2.0 | 1008 | $2,750 | $2.73 | 15d | 1 | 0.92mi |
| 1523 N Arkansas Ave Atlantic City, NJ | 3.0 | 2.0 | 984 | $2,500 | $2.54 | 23d | 1 | 0.96mi |
| 1532 Emerson Pl Fl Front Atlantic City, NJ | 3.0 | 2.0 | 1200 | $2,400 | $2.00 | 15d | 1 | 0.98mi |
| 21 N Laclede Pl Atlantic City, NJ | 3.0 | 1.0 | 1200 | $2,000 | $1.67 | 23d | 1 | 1.04mi |
| 1914 N Missouri Ave Atlantic City, NJ | 2.0 | 1.0 | 750 | $1,795 | $2.39 | 23d | 1 | 1.07mi |
| 101 S Raleigh Ave Atlantic City, NJ | 2.0 | 1.0 | 735 | $18,750 | $25.51 | 15d | 7 | 1.11mi |
| 31 N Virginia Ave Atlantic City, NJ | 3.0 | 1.0 | 725 | $2,230 | $3.08 | 15d | 1 | 1.28mi |
| 848 Pacific Ave Unit 1014254P Atlantic City, NJ | 1.0–2.0 | 2.0–3.0 | 1243 | $2,413 | $1.94 | 15d | 2 | 1.45mi |
| 24 N Baton Rouge Ave Ventnor City, NJ | 3.0 | 2.0 | 1350 | $18,000 | $13.33 | 15d | 1 | 1.49mi |
Listing history 20 events
-
2026-06-21days on market $199,000 Active 25 DOM
-
2026-06-19pricedays on market $199,000 Active 23 DOM
-
2026-06-18days on market $209,000 Active 22 DOM
-
2026-06-17days on market $209,000 Active 21 DOM
-
2026-06-16days on market $209,000 Active 20 DOM
-
2026-06-15days on market $209,000 Active 19 DOM
-
2026-06-14days on market $209,000 Active 17 DOM
-
2026-06-13days on market $209,000 Active 16 DOM
-
2026-06-10pricedays on market $209,000 Active 14 DOM
-
2026-06-09days on market $219,000 Active 13 DOM
-
2026-06-08days on market $219,000 Active 12 DOM
-
2026-06-07days on market $219,000 Active 11 DOM
-
2026-06-02days on market $219,000 Active 6 DOM
-
2026-06-01days on market $219,000 Active 5 DOM
-
2026-05-31days on market $219,000 Active 4 DOM
-
2026-05-30days on market $219,000 Active 3 DOM
-
2026-05-21$219,000 Active
-
2011-07-01historical
-
2010-11-29$169,000
-
1988-05-12soldstatus $30,000
ⓘ Source: listings_history table (triggers on properties + properties_extension) + one-shot
backfill from property_details.listing_events for pre-trigger history.
Tax reassessment forecast NJ · Partial reset (capped growth)
- Current annual tax
- $2,001 · $167/mo
- Projected year-2 tax
- $3,478 · $290/mo
- Expected delta
- +$1,477/yr (+$123/mo · 73.8%)
ⓘ Screening estimate from a state-policy table — verify with the county assessor before closing.
Climate risk First Street
- Flood 10/10 Extreme FEMA zone AE · 99% chance over 30 yrs
- Wildfire 1/10 Low
- Heat 9/10 Extreme 7 d/yr ≥94°F today · 16 d/yr by 30 yrs out
- Wind 8/10 Severe 80% chance of damaging wind over 30 yrs
- Air quality 3/10 Moderate 2 unhealthy d/yr today · 3 by 30 yrs out
Nearby sold comps map
Loading sold comps map…
Walkable amenities ~0.75 mi
Loading nearby amenities…
Taxation est. · year 1
- Rental income
- $27,350
- − Mortgage interest
- −$11,147
- − Property taxes
- −$2,001
- − Insurance
- −$6,114
- − Repairs & maintenance
- −$2,188
- − Management
- −$2,188
- − Depreciation
- −$5,789
- Taxable loss
- −$2,076
- Est. tax savings @ 24.0%
- +$498
- After-tax cash flow
- $1,468/yr
For passive investors: Depreciation is non-cash, so a rental often shows a tax loss while cash-flowing — sheltering income. Rental losses are passive: they offset passive income freely, and up to $25,000/yr can offset ordinary (W-2) income if you actively participate and your MAGI is under $100k (phasing out to $0 by $150k); unused losses carry forward. On sale, claimed depreciation is recaptured at up to 25%, and gains may owe capital-gains tax (a 1031 exchange can defer both). Figures are a year-1 estimate at your 24.0% rate — not tax advice; consult a CPA.
Schools (NCES district)
- District
- Atlantic City School District
- NCES district ID
- 3400960
- Math proficiency
- 9% ▼ -12.00%
- Reading proficiency
- 26% ▼ -6.00%
- Median HH income
- $27,842
- Composite
- 13.66/100
- National rank
- #9504
- State rank
- #454 of 472 in NJ
Livability — Atlantic City
- Score
- 55/100
- State rank
- #525
- US rank
- #23095
Category grades
Schools grade is shown separately in the Schools card above.
Census & demographics
- Census place
- Atlantic City, NJ
- County
- Atlantic County · 143,611 people
- City population
- 38,925
- Metro
- Atlantic City-Hammonton, NJ
- Population (ZIP)
- 38,925
- Household income
- $41,126
- Rent vs Own
- Severe rent burden
- 3414.0
Population outlook (Atlantic County) Hauer SSP2
- Today (2025)
- 268,948 people
- By 2030
- 264,497 · -1.7%
- By 2040
- 252,261 · -6.2%
- By 2050
- 237,846 · -11.6%
- By 2075
- 210,650 · -21.7%
- By 2100
- 180,234 · -33.0%
Race, ethnicity, and origin ACS 2023
- Neighborhood character
- Highly diverse neighborhood (Simpson 0.75)
- Race & ethnicity
- Hispanic / Latino 32% Black 32% Asian 16% White 16% Two or more races 11% Native American 2%
- Hispanic origin (detail)
- Mexican 10% Puerto Rican 8% Dominican 8%
- Common ancestry
- Romanian 1% Scotch-Irish 1%
- Foreign-born
- 29% · Canada, Vietnam, Jamaica
- Languages at home
- 52% English-only · Spanish 30% Other Indo-European 8% Vietnamese 3%
Political lean MEDSL · Atlantic
- 2024 margin
- Toss-up / Even · D 47.7% · R 50.7% · Other 1.6%
- 2008→2024 swing
- -18.1pp toward R · 2008: 15.1pp · 2024: -3.0pp
- All cycles
- 2024: R+3.0 2020: D+6.7 2016: D+6.2 2012: D+17.2 2008: D+15.1
Not yet ingested
- Civics
- —
Market trends
- HPI YoY
- ▼ -26.82%
- Current HPI
- 353.7827
- Rent YoY
- ▲ 5.52%
- Metro
- Atlantic City-Hammonton, NJ
- State GDP YoY
- ▲ 2.05%
- F500 in state
- 34
Industry mix (Fortune 500 HQ in NJ)
| Industry | F500 HQs | Revenue |
|---|---|---|
| Consumer Goods | 3 | $31B |
|
||
| Pharmaceuticals | 2 | $153B |
|
||
| Technology | 2 | $21B |
|
||
| Insurance | 2 | $20B |
|
||
| Healthcare | 2 | $19B |
|
||
| Financial Services | 1 | $70B |
|
||
Price history
+630.0% since first listed4 events — show timeline
- 2026-05-21 Listed $219,000 SJSRMLS
- 2011-07-01 Listing Removed — BRIGHT MLS
- 2010-11-29 Listed $169,000 BRIGHT MLS
- 1988-05-12 Sold (Public Records) $30,000 Public Records
Property tax history
-1.4%/yrLatest (2025): $2,001 · -2.1% YoY. Source: county tax records.
Cash-flow waterfall
monthlySold comps — $/sqft
last 12 mo · ≤1 miLoading sold comps…