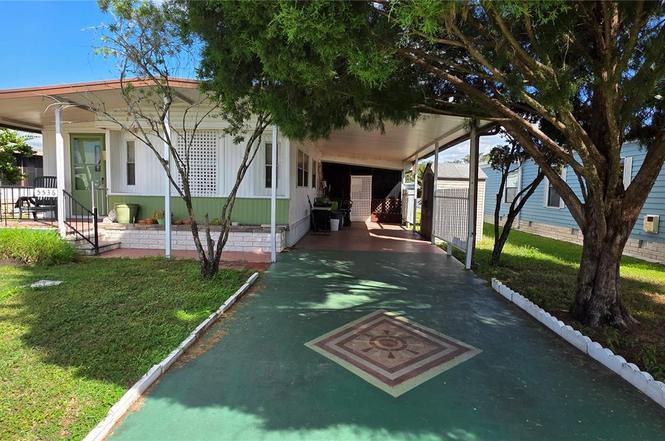
5536 Benton St · Zephyrhills West, FL
Flood risk 1/10 · Minimal
- FEMA flood zone
- X (unshaded)
- Chance of flooding over 30 yrs
- 0.0%
- Est. flood insurance / yr
- $507 – $1,088
Fire risk 5/10 · Moderate
- Est. fire insurance / yr
- $947 – $1,759
Heat risk 9/10 · Severe
- Hot days now (above 108°F)
- 7 days/yr
- Hot days in 30 yrs
- 25 days/yr
Wind risk 9/10 · Severe
- Chance of severe wind over 30 yrs
- 99.0%
Air-quality risk 2/10 · Minimal
- Unhealthy air days now
- 1 days/yr
- Unhealthy air days in 30 yrs
- 2 days/yr
Risk factors via First Street. Map © Google.
Why this score? — see what drove the B+ grade
The composite is a weighted blend of 9 inputs, each scored 0–100. Each bar is that input's sub-score; the figure is the points it added to the 100-point composite (weight × sub-score).
- Cash flow +30.0/30.0
- ARV discount +15.0/15.0
- 1% rule +10.0/10.0
- DSCR +10.0/10.0
- Schools +4.3/10.0
- Livability +3.1/5.0
- Condition / age +2.5/5.0
- Rent growth +1.6/5.0
- Appreciation +0.0/10.0
$79,500
🖨 Deal sheet 📄 Offer letter ✓ Due diligence
Listing remarks
Restore this home to its former charm or replace it with your new dream home. This 14' x 60' singlewide features 2 bedrooms, 2 bathrooms, a long carport with space for two vehicles, and a covered front walkway leading to the side entry door. There's a generously sized, partially enclosed street-level screened porch with an attached laundry/utility room that includes a washer, dryer, and storage space. The spacious living room boasts a 7' x 12' addition and high ceilings. Open to the main living area is the centrally located eat-in kitchen, complete with a built-in hutch and dining space. A well-sized guest bedroom with a closet is situated near the full hall bathroom, which includes a garde
Key facts
- Built in hutch
- Nice sized lot
- Walk in shower
Tags
Property features AI
Finance
- Other: Partially furnished; Lot is approximately 0.11 acre (level, paved, in county, near golf course); Road is asphalt and publicly maintained; Previous status: Pending
- Financial info: Lease restrictions apply
- HOA & community: Has HOA; monthly HOA approximately $37.33 ($448 annually); Association requires approval and fees include common area taxes, grounds maintenance, and security; Association amenities include clubhouse, pool, spa/hot tub, tennis, pickleball, basketball, shuffleboard, park, recreation facilities, storage, security, golf course access, maintenance, and optional additional fees; Senior community; Pets not allowed; Buyer approval required; deed restrictions
Exterior
- Parking: Driveway and off-street parking; Carport with 2 spaces
- Security: Smoke detector(s)
- Utilities: Public water; Public sewer; Electricity connected; Fiber optics available; Cable available; BB/HS internet available; Phone available; Fire hydrant nearby; Sewer and water connected
- Home design: Manufactured single-wide home; Residential property; Fixer condition; One story; Home faces west; Crawlspace with pillar/post/pier foundation
- Construction: Metal siding; Metal roof; Built on crawlspace/pier foundation; Year built not provided
- Exterior features: Enclosed and screened side porch; Storage and shed(s); Shade shutters and awnings; Rain gutters; Pool (other features); Fruit trees and landscaped trees
Interior
- Kitchen: Range; Microwave; Refrigerator; Electric water heater
- Bedrooms: 2 bedrooms
- Flooring: Laminate; Carpet; Vinyl
- Bathrooms: 2 full bathrooms
- Heating & cooling: Central heating (electric); Central air conditioning
- Interior features: Window treatments and blinds; Built-in features; Eat-in kitchen; High ceilings; Thermostat; Smoke detector(s)
- Laundry & utility: Washer hookup; Electric dryer hookup; Washer; Dryer
Neighborhood map
What this means for you Summary
Snapshot
- This is a 3-bed/2.0-bath manufactured listed at $80k.
Deal economics
- At list price, monthly cash flow is $719 ($9k/yr) — positive.
- The deal already cash-flows at list — no discount required.
- Meets the 1% rule at list price ($2k rent vs $80k).
- Recommended offer: $70k (12.0% below list) — sets the bar for market timing.
- Cap rate 17.2% vs local median 7.8% in Zephyrhills West — top-decile yield for the area; either an underpriced asset or a hidden risk that comps aren't pricing in. Stress-test before assuming the spread holds.
Location & tenants
- Location reads 61/100 on livability (#772 in FL) — a middle-class / working-renter tenant base. Strengths: cost of living A+, housing A+; Watch: schools D-, amenities F, commute F.
- Pasco (suburban): math 50% / reading 52% proficiency, ranked #32 of 73 in FL (top 44%) — acceptable for families but not a draw, mixed tenant base, ~2y average lease.
- Market conditions: Rents falling (-3.6%/yr); 294 active listings in the ZIP; 18 comparable units currently listed for rent nearby; rentals at typical pace (median 24d on market — plan ~3-4 weeks tenant-placement turnaround); 6,765 units permitted in Pasco County in 2024 (1,250 in 5+ unit buildings).
- This rent runs 39% of the median local income ($49k/yr) — at the standard rent-burdened threshold; future hikes will face affordability resistance.
Forward outlook
- Local home prices are declining (-3.0%/yr); year-one equity from $550 of loan paydown is wiped out by about $2k of value loss. Plan a longer hold.
- Pasco County population projected at +29% by 2050 — long-run rental-demand tailwind backs the buy-and-hold thesis.
- At projected returns (-3.0% appreciation + 0.0% rent growth), your $22k cash investment doubles in ~4 years — after that, you're playing with house money.
Negotiation context
- It's been on market 185 days — a 12% lower offer ($70k) is reasonable based on typical stale-listing flexibility.
- 2 sale attempts; this cycle's ask has dropped $10k (12%) from the opening price — seller is motivated, your offer sets the floor, not the list.
Risks & watch-outs
- Climate carrying-cost: severe wind risk, 99% chance of damaging wind over 30y; moderate wildfire risk; extreme-heat days projected 7→25/yr by 2055 (HVAC capex compounding) — expect insurance premiums to compound above CPI over the hold.
Questions for the listing agent
- It's been on market 185 days. Have you received any prior offers? Is the seller open to a 12% concession, seller financing, or rate buy-down credit?
- What does the HOA fee cover, when was the last increase, and are there any pending special assessments or reserve-fund shortfalls?
- Why hasn't it sold? Are there any deal-killer items the seller is aware of (foundation, flood, title, zoning, code violations)?
- Is there a deadline driving the sale (1031 exchange, divorce, estate, relocation)? That informs how much negotiation room exists.
- Schools are D-rated, which usually means shorter tenancies and higher turnover. Who's the typical renter profile here, and what's been the actual vacancy rate?
- What's the average days-on-market for RENTAL listings here right now (not sales)? A rising rental-DOM trend means longer vacancies and softer asking-rent achievability than the comps imply.
- What's the recent tenant-quality profile in this submarket — average credit score on applications, eviction rate, late-payment / NSF rate, and stable-employment percentage? A property-management company in the area should have these aggregated.
- How much new for-sale + rental construction is in the pipeline within 1–3 miles? Heavy new supply typically softens prices + rents 12–24 months out; constrained supply supports both.
Investment metrics
- 1% rule
- 2.03% ✓
- Cap rate
- 17.15%
- Cash-on-cash
- 38.79%
- DSCR
- 2.73
- GRM
- 4.1
CMA / ARV
- ARV (on-the-fly)
- $128,520
- Comps found
- 12
Show comp detail 12 sales within ~0.75 mi
| Address | Dist | Beds/Ba | Sqft | Sold | Price | $/sf | Match |
|---|---|---|---|---|---|---|---|
| 5722 Pawnne St | 0.20mi | 2/2.0 (-1) | 869 (+4%) | 4mo | $48,500 | $56 | 77 |
| 36905 Kay Ave | 0.28mi | 2/2.0 (-1) | 864 (+3%) | 4mo | $148,500 | $172 | 74 |
| 37240 Beverly Ave | 0.45mi | 2/2.0 (-1) | 898 (+7%) | 2mo | $130,500 | $145 | 61 |
| 5307 Flint St | 0.42mi | 2/2.0 (-1) | 774 (-8%) | 3mo | $134,000 | $173 | 60 |
| 5619 Dakota St | 0.31mi | 2/2.0 (-1) | 960 (+14%) | 3mo | $175,000 | $182 | 54 |
| 37024 8th Ave | 0.37mi | 2/2.0 (-1) | 960 (+14%) | 2mo | $45,000 | $47 | 52 |
| 5341 Powhattan St | 0.36mi | 2/2.0 (-1) | 960 (+14%) | 3mo | $170,000 | $177 | 52 |
| 37100 8th Ave | 0.41mi | 2/2.0 (-1) | 960 (+14%) | 1mo | $138,000 | $144 | 52 |
| 37229 Sandra Ave | 0.52mi | 2/2.0 (-1) | 931 (+11%) | 1mo | $106,900 | $115 | 52 |
| 36413 Teakwood Ave | 0.66mi | 2/1.0 (-1) | 812 (-3%) | 4mo | $159,000 | $196 | 51 |
| 5250 Betmar Dr | 0.56mi | 3/1.5 | 936 (+11%) | 3mo | $143,000 | $153 | 50 |
| 37031 Karen Ave | 0.46mi | 2/1.5 (-1) | 720 (-14%) | 1mo | $92,000 | $128 | 47 |
Match score weights: distance 35% · size 25% · config 20% · recency 20%. Top-matched comps best support the ARV.
Projected returns pro-forma
-3.0% appreciation · 0.0% rent growth · sell at horizon
- IRR
- 31.5%
- Equity multiple
- 2.27×
- Total profit
- $28,245
- Equity at exit
- $11,854
- IRR
- 36.9%
- Equity multiple
- 3.94×
- Total profit
- $65,458
- Equity at exit
- $6,874
Cash invested: $22,260 (down + closing). Projections, not guarantees.
Landlord ↔ Tenant lean methodology
- Overall (STATE)
- 87 Strongly Landlord-Friendly
- State Florida
- 87 Strongly Landlord-Friendly · R+3
- County
- — inherits STATE
- City
- — inherits STATE
ZIP-level market 33542
- Home prices YoY
- -20.6%
- Rents YoY
- -3.6%
- Active inventory
- 294
- Price-to-rent
- 4.1×
Monthly cashflow live
- Estimated rent
- $1,611 high interval (Pro) →
- Mortgage (P&I)
- −$417
- Tax from tax record
- −$67 /mo · $799/yr
- Insurance
- −$33
- HOA
- −$37
- Vacancy / Maint / Mgmt
- −$338
- Net cashflow
- $719
Break-even live
UW: 25.0% down · 7.5% · 30yr · 1.5% tax · 5.0% vac · 8.0% maint · 8.0% mgmt
Financing live
Cash to close
- Down payment
- $19,875
- Closing costs
- $2,385
- Reserves months
- —
- Total cash needed
- —
Loan-product check · same deal, 3 products live
Conventional
25% down · 7.5% · 30yr
- Down + closing
- —
- Monthly P&I
- —
- Monthly cashflow
- —
- DSCR
- —
- Eligible?
- —
Personal DTI + credit; lowest rate.
DSCR
20% down · 8.5% · 30yr
- Down + closing
- —
- Monthly P&I
- —
- Monthly cashflow
- —
- DSCR
- —
- Eligible?
- —
No personal income docs; deal must DSCR.
Hard money
10% down · 12.0% · 12mo
- Down + closing
- —
- Monthly P&I
- —
- Monthly cashflow
- —
- DSCR
- —
- Eligible?
- —
Short-term bridge; refi at stabilization.
Rent comps 18 comps
| Address | Beds | Baths | Sqft | Rent | $/sqft | DOM | Units | Dist |
|---|---|---|---|---|---|---|---|---|
| 36801 Camelia Ct Zephyrhills, FL | 2.0 | 2.0 | 864 | $1,350 | $1.56 | 24d | 1 | 0.08mi |
| 5168 Crooked Ln Zephyrhills, FL | 2.0 | 1.0 | 600 | $1,645 | $2.74 | 22d | 1 | 0.38mi |
| 5521 Barbara St Zephyrhills, FL | 2.0 | 2.0 | 1056 | $1,800 | $1.70 | 24d | 1 | 0.43mi |
| 36321 Stonewood Ln #103 Zephyrhills, FL | 2.0 | 2.0 | 987 | $1,525 | $1.55 | 24d | 1 | 0.69mi |
| 5914 Willow Ridge Dr #101 Zephyrhills, FL | 2.0 | 2.0 | 987 | $1,500 | $1.52 | 24d | 1 | 0.70mi |
| 6302 Abbott Station Dr Zephyrhills, FL | 3.0 | 1.0–2.5 | 855 | $1,999 | $2.34 | 1d | 142 | 0.88mi |
| 36009 Deer Creek Dr #104 Zephyrhills, FL | 2.0 | 2.0 | 1029 | $1,450 | $1.41 | 24d | 1 | 0.96mi |
| 36015 Deer Creek Dr #202 Zephyrhills, FL | 2.0 | 2.0 | 1062 | $1,450 | $1.37 | 24d | 1 | 0.96mi |
| 37812 15th Ave Zephyrhills, FL | 2.0 | 2.0 | 1000 | $1,850 | $1.85 | 24d | 1 | 0.99mi |
| 35940 Inspiration Dr Zephyrhills, FL | 1.0–3.0 | 1.0–2.0 | 1034 | $1,988 | $1.92 | 2d | 21 | 1.01mi |
| 37902 7th Ave Zephyrhills, FL | 3.0 | 1.0 | 900 | $1,775 | $1.97 | 24d | 1 | 1.10mi |
| 5237 1st St Zephyrhills, FL | 3.0 | 1.0 | 964 | $1,700 | $1.76 | 24d | 1 | 1.17mi |
| 37732 Cecil Ln Zephyrhills, FL | 3.0 | 1.0 | 1040 | $1,800 | $1.73 | 24d | 1 | 1.18mi |
| 4833 Royal Palm Dr Zephyrhills, FL | 2.0 | 1.0 | 672 | $1,090 | $1.62 | 24d | 1 | 1.28mi |
| 5441 6th St Zephyrhills, FL | 2.0 | 1.0 | 1014 | $1,650 | $1.63 | 24d | 1 | 1.34mi |
| 4639 Coral St Zephyrhills, FL | 2.0 | 2.0 | 1056 | $1,250 | $1.18 | 24d | 1 | 1.35mi |
| 37819 Alissa Dr Zephyrhills, FL | 2.0 | 2.0 | 864 | $1,450 | $1.68 | 17d | 1 | 1.39mi |
| 37925 Date Palm Dr Zephyrhills, FL | 3.0 | 1.5 | 720 | $1,300 | $1.81 | 24d | 1 | 1.47mi |
HOA detail
- Monthly dues
- $37 · $444/yr
Listing history 10 events
-
2026-06-07status $79,500 Pending 185 DOM
-
2026-06-04days on market $79,500 Active 185 DOM
-
2026-06-03days on market $79,500 Active 184 DOM
-
2026-06-02days on market $79,500 Active 183 DOM
-
2026-06-01days on market $79,500 Active 182 DOM
-
2026-05-31days on market $79,500 Active 181 DOM
-
2026-04-03status Active
-
2026-02-20status Pending
-
2026-01-15price $79,500
-
2025-10-20$89,900 Active
ⓘ Source: listings_history table (triggers on properties + properties_extension) + one-shot
backfill from property_details.listing_events for pre-trigger history.
Tax reassessment forecast FL · Resets to sale price
- Current annual tax
- $799 · $67/mo
- Projected year-2 tax
- $799 · $67/mo
- Expected delta
- $0/yr ($0/mo · 0.0%)
ⓘ Screening estimate from a state-policy table — verify with the county assessor before closing.
Climate risk First Street
- Flood 1/10 Low FEMA zone X (unshaded) · 0% chance over 30 yrs
- Wildfire 5/10 Major
- Heat 9/10 Extreme 7 d/yr ≥108°F today · 25 d/yr by 30 yrs out
- Wind 9/10 Extreme 99% chance of damaging wind over 30 yrs
- Air quality 2/10 Low 1 unhealthy d/yr today · 2 by 30 yrs out
Nearby sold comps map
Loading sold comps map…
Walkable amenities ~0.75 mi
Loading nearby amenities…
Taxation est. · year 1
- Rental income
- $19,338
- − Mortgage interest
- −$4,453
- − Property taxes
- −$799
- − Insurance
- −$398
- − Repairs & maintenance
- −$1,547
- − Management
- −$1,547
- − HOA
- −$444
- − Depreciation
- −$2,313
- Taxable income
- $7,837
- Est. tax owed @ 24.0%
- −$1,881
- After-tax cash flow
- $6,753/yr
For passive investors: Depreciation is non-cash, so a rental often shows a tax loss while cash-flowing — sheltering income. Rental losses are passive: they offset passive income freely, and up to $25,000/yr can offset ordinary (W-2) income if you actively participate and your MAGI is under $100k (phasing out to $0 by $150k); unused losses carry forward. On sale, claimed depreciation is recaptured at up to 25%, and gains may owe capital-gains tax (a 1031 exchange can defer both). Figures are a year-1 estimate at your 24.0% rate — not tax advice; consult a CPA.
Schools (NCES district)
- District
- Pasco
- NCES district ID
- 1201530
- Math proficiency
- 50% ▼ -10.00%
- Reading proficiency
- 52% ▼ -5.00%
- Median HH income
- $45,039
- Composite
- 43.14/100
- National rank
- #3074
- State rank
- #32 of 73 in FL
Livability — Zephyrhills West
- Score
- 61/100
- State rank
- #772
- US rank
- #17403
Category grades
Schools grade is shown separately in the Schools card above.
Census & demographics
- Census place
- Zephyrhills West, FL
- County
- Pasco County · 524,098 people
- Metro
- Tampa-St. Petersburg-Clearwater, FL
- Population (ZIP)
- 23,612
- Household income
- $49,316
- Rent vs Own
- Severe rent burden
- 831.0
Population outlook (Pasco County) Hauer SSP2
- Today (2025)
- 570,045 people
- By 2030
- 605,844 · +6.3%
- By 2040
- 674,806 · +18.4%
- By 2050
- 736,022 · +29.1%
- By 2075
- 862,900 · +51.4%
- By 2100
- 906,364 · +59.0%
Race, ethnicity, and origin ACS 2023
- Neighborhood character
- Predominantly White (76%)
- Race & ethnicity
- White 76% Hispanic / Latino 17% Two or more races 8% Black 4% Asian 1%
- Hispanic origin (detail)
- Mexican 2% Puerto Rican 10%
- Common ancestry
- Lithuanian 3% Romanian 2% Iranian 2%
- Foreign-born
- 5% · Canada, Jamaica
- Languages at home
- 86% English-only · Spanish 12% Other Indo-European 1% Russian/Polish/Slavic 1%
Political lean MEDSL · Pasco
- 2024 margin
- Strong R (+25.2) · D 36.9% · R 62.1% · Other 1.0%
- 2008→2024 swing
- -21.6pp toward R · 2008: -3.6pp · 2024: -25.2pp
- All cycles
- 2024: R+25.2 2020: R+20.1 2016: R+21.6 2012: R+6.7 2008: R+3.6
Not yet ingested
- Civics
- —
Market trends
- HPI YoY
- ▼ -81.25%
- Current HPI
- 313.3993
- Rent YoY
- ▼ -3.56%
- Metro
- Tampa-St. Petersburg-Clearwater, FL
- State GDP YoY
- ▲ 3.28%
- F500 in state
- 36
Industry mix (Fortune 500 HQ in FL)
| Industry | F500 HQs | Revenue |
|---|---|---|
| Industrial Technology | 2 | $29B |
|
||
| Insurance | 2 | $17B |
|
||
| Retail | 1 | $60B |
|
||
| Technology Distribution | 1 | $58B |
|
||
| Homebuilding | 1 | $35B |
|
||
| Technology Manufacturing | 1 | $35B |
|
||
Price history
-11.6% since first listed4 events — show timeline
- 2026-04-03 Relisted — Stellar MLS as Distributed by MLS Grid
- 2026-02-20 Pending — Stellar MLS as Distributed by MLS Grid
- 2026-01-15 Price Changed $79,500 Stellar MLS as Distributed by MLS Grid
- 2025-10-20 Listed $89,900 Stellar MLS as Distributed by MLS Grid
Property tax history
+3.9%/yrLatest (2025): $799 · +2.0% YoY. Source: county tax records.
Cash-flow waterfall
monthlySold comps — $/sqft
last 12 mo · ≤1 miLoading sold comps…