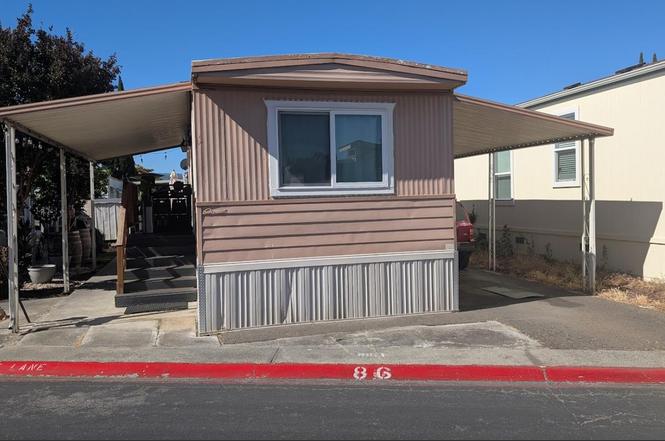
510 Saddle Brook Dr #86 · San Jose, CA
Flood risk 3/10 · Minor
- FEMA flood zone
- D
- Chance of flooding over 30 yrs
- 0.16%
- Est. flood insurance / yr
- $544 – $1,084
Fire risk 1/10 · Minimal
- Est. fire insurance / yr
- $659 – $1,223
Heat risk 5/10 · Moderate
- Hot days now (above 95°F)
- 7 days/yr
- Hot days in 30 yrs
- 14 days/yr
Wind risk 1/10 · Minimal
- Chance of severe wind over 30 yrs
- —
Air-quality risk 9/10 · Severe
- Unhealthy air days now
- 19 days/yr
- Unhealthy air days in 30 yrs
- 19 days/yr
Risk factors via First Street. Map © Google.
Why this score? — see what drove the B grade
The composite is a weighted blend of 9 inputs, each scored 0–100. Each bar is that input's sub-score; the figure is the points it added to the 100-point composite (weight × sub-score).
- Cash flow +29.9/30.0
- DSCR +10.0/10.0
- ARV discount +10.0/15.0
- 1% rule +8.4/10.0
- Schools +4.9/10.0
- Livability +3.9/5.0
- Rent growth +3.3/5.0
- Condition / age +2.5/5.0
- Appreciation +0.0/10.0
$204,900
🖨 Deal sheet (PDF) 📄 Offer letter ✓ Due diligence
Listing remarks MLS
Great starter home at low cost in a family friendly community. Located next to Hayes Mansion park. Family is is growing and moving to a bigger home.
Key facts
- Built 1971
- Listed 7 days
Tags
Property features AI
Finance
- Other: Local property tax (LPT)
- HOA & community: Community clubhouse; Community pool; Barbecue area
Exterior
- Parking: Carport (2 spaces); Assigned space #86; Space rent charged
- Utilities: Public water; Public sewer; Public utilities
- Home design: Mobile/manufactured home (park home site)
- Construction: 720 living area (source: assessor)
- Exterior features: Metal roof; Leased land (park home site); Located in a family park
Interior
- Kitchen: Eat-in kitchen (appliances not specified)
- Bedrooms: 2 bedrooms
- Bathrooms: 1 full bathroom
- Heating & cooling: Central forced air heating; Window/wall cooling unit
- Interior features: Kitchen and family room combined; Eat-in kitchen
Neighborhood map
What this means for you Summary
Snapshot
- This is a 2-bed/1.0-bath manufactured listed at $205k.
Deal economics
- At list price, monthly cash flow is $757 ($9k/yr) — positive.
- The deal already cash-flows at list — no discount required.
- Meets the 1% rule at list price ($3k rent vs $205k).
- Cap rate 10.7% vs local median 1.6% in San Jose — top-decile yield for the area; either an underpriced asset or a hidden risk that comps aren't pricing in. Stress-test before assuming the spread holds.
Location & tenants
- Location reads 78/100 on livability (#68 in CA, #2,559 nationally) — a middle-class / working-renter tenant base. Strengths: amenities A+, commute A+, employment A+; Watch: crime F, cost of living F.
- Oak Grove Elementary (urban): math 47% / reading 54% proficiency, ranked #339 of 1,400 in CA (top 24%) — acceptable for families but not a draw, mixed tenant base, ~2y average lease.
- Zoned schools: Hayes Elementary (477 students, 47% FRL).
- Market conditions: Rents rising (+3.4%/yr); 90 active listings in the ZIP; 13 comparable units currently listed for rent nearby; rentals leasing fast (median 2d on market — plan ~1-2 weeks tenant-placement turnaround); high-income renter base; 3,838 units permitted in Santa Clara County in 2024 (1,886 in 5+ unit buildings).
Forward outlook
- Local home prices are declining (-3.0%/yr); year-one equity from $1k of loan paydown is wiped out by about $6k of value loss. Plan a longer hold.
- Santa Clara County population projected at +24% by 2050 — long-run rental-demand tailwind backs the buy-and-hold thesis.
- At projected returns (-3.0% appreciation + 3.4% rent growth), your $57k cash investment doubles in ~8 years — after that, you're playing with house money.
Negotiation context
- Only 7 days on market — expect competitive offers; lowballing is unlikely to land.
- 3 sale attempts since 22y ago with the ask held roughly flat each time — persistent listings suggest the price (not the market) is what's stuck; bring a comps-based counter.
- Current owner paid $18k; list at $205k implies a 1068% gain — meaningful room to come down on a strong offer.
Risks & watch-outs
- Climate carrying-cost: extreme-heat days projected 7→14/yr by 2055 (HVAC capex compounding) — expect insurance premiums to compound above CPI over the hold.
Questions for the listing agent
- Built in 1971 — when were the roof, HVAC, electrical panel, plumbing, and water heater last replaced?
- Is there a deadline driving the sale (1031 exchange, divorce, estate, relocation)? That informs how much negotiation room exists.
- Crime grade is F in this area — have there been break-ins, vandalism, or insurance claims at this property in the last 3 years? What carrier currently insures it and at what premium?
- What's the average days-on-market for RENTAL listings here right now (not sales)? A rising rental-DOM trend means longer vacancies and softer asking-rent achievability than the comps imply.
- What's the recent tenant-quality profile in this submarket — average credit score on applications, eviction rate, late-payment / NSF rate, and stable-employment percentage? A property-management company in the area should have these aggregated.
- How much new for-sale + rental construction is in the pipeline within 1–3 miles? Heavy new supply typically softens prices + rents 12–24 months out; constrained supply supports both.
Investment metrics
- 1% rule
- 1.34% ✓
- Cap rate
- 10.73%
- Cash-on-cash
- 15.83%
- DSCR
- 1.70
- GRM
- 6.2
CMA / ARV
- ARV (on-the-fly)
- $216,720
- Comps found
- 4
Show comp detail 4 sales within ~0.75 mi
| Address | Dist | Beds/Ba | Sqft | Sold | Price | $/sf | Match |
|---|---|---|---|---|---|---|---|
| 510 Saddlebrook Dr #82 | 0.02mi | 2/1.0 | 720 (0%) | 22mo | $217,000 | $301 | 81 |
| 510 Saddle Brook Dr #322 | 0.02mi | 2/1.0 | 800 (+11%) | 5mo | $200,000 | $250 | 76 |
| 510 SADDLEBROOK Dr #71 | 0.09mi | 2/1.0 | 747 (+4%) | 16mo | $270,000 | $361 | 76 |
| 510 Saddle Brook Dr #245 | 0.00mi | 2/1.0 | 800 (+11%) | 18mo | $195,000 | $244 | 66 |
Match score weights: distance 35% · size 25% · config 20% · recency 20%. Top-matched comps best support the ARV.
Projected returns pro-forma
-3.0% appreciation · 3.36% rent growth · sell at horizon
- IRR
- 7.1%
- Equity multiple
- 1.28×
- Total profit
- $16,055
- Equity at exit
- $30,551
- IRR
- 16.8%
- Equity multiple
- 2.40×
- Total profit
- $80,368
- Equity at exit
- $17,716
Cash invested: $57,372 (down + closing). Projections, not guarantees.
Landlord ↔ Tenant lean methodology
- Overall (CITY)
- 0 Strongly Tenant-Friendly
- State California
- 18 Strongly Tenant-Friendly · D+13
- County
- — inherits STATE
- City San Jose
- 0 Strongly Tenant-Friendly · D+24
ZIP-level market 95136
- Rents YoY
- 3.4%
- Active inventory
- 90
- Price-to-rent
- 6.2×
Monthly cashflow live
- Estimated rent
- $2,751 high interval (Pro) →
- Mortgage (P&I)
- −$1,075
- Tax est. 1.5%
- −$256 /mo · $3,074/yr
- Insurance
- −$85
- HOA
- −$0
- Vacancy / Maint / Mgmt
- −$578
- Net cashflow
- $757
Break-even live
Sensitivity live
| Price | -10% $899 | -5% $828 | +0% $757 | +5% $686 | +10% $615 |
|---|---|---|---|---|---|
| Rent | -10% $540 | -5% $648 | +0% $757 | +5% $866 | +10% $974 |
| Rate | -1.0pp $860 | -0.5pp $809 | base $757 | +0.5pp $704 | +1.0pp $650 |
UW: 25.0% down · 7.5% · 30yr · 1.5% tax · 5.0% vac · 8.0% maint · 8.0% mgmt
Financing live
Cash to close
- Down payment
- $51,225
- Closing costs
- $6,147
- Reserves months
- —
- Total cash needed
- —
Loan-product check · same deal, 3 products live
Conventional
25% down · 7.5% · 30yr
- Down + closing
- —
- Monthly P&I
- —
- Monthly cashflow
- —
- DSCR
- —
- Eligible?
- —
Personal DTI + credit; lowest rate.
DSCR
20% down · 8.5% · 30yr
- Down + closing
- —
- Monthly P&I
- —
- Monthly cashflow
- —
- DSCR
- —
- Eligible?
- —
No personal income docs; deal must DSCR.
Hard money
10% down · 12.0% · 12mo
- Down + closing
- —
- Monthly P&I
- —
- Monthly cashflow
- —
- DSCR
- —
- Eligible?
- —
Short-term bridge; refi at stabilization.
Rent comps 13 comps
| Address | Beds | Baths | Sqft | Rent | $/sqft | DOM | Units | Dist |
|---|---|---|---|---|---|---|---|---|
| 5210 Monterey Hwy San Jose, CA | 1.0 | 1.0 | 566 | $2,016 | $3.56 | 2d | 3 | 0.32mi |
| 5635 Blossom Gardens Cir San Jose, CA | 1.0–2.0 | 1.0–2.0 | 776 | $3,025 | $3.90 | 2d | 8 | 0.55mi |
| 110 Roundtable Dr #3 San Jose, CA | 1.0 | 1.0 | 750 | $1,900 | $2.53 | 2d | 1 | 0.57mi |
| 130 Roundtable Dr San Jose, CA | 1.0 | 1.0 | 606 | $2,399 | $3.96 | 2d | 1 | 0.63mi |
| 5332 Monterey Hwy #25 San Jose, CA | 1.0 | 1.0 | 700 | $2,095 | $2.99 | 2d | 1 | 0.65mi |
| 229 Blossom Hill Rd San Jose, CA | 1.0–2.0 | 1.0 | 675 | $2,550 | $3.77 | 2d | 5 | 0.77mi |
| 5322 Wong Dr San Jose, CA | 1.0–2.0 | 1.0–2.0 | 800 | $3,217 | $4.02 | 2d | 3 | 0.81mi |
| 4501 Snell Ave San Jose, CA | 1.0–2.0 | 1.0–2.0 | 903 | $3,599 | $3.99 | 2d | 18 | 0.98mi |
| 5382 Makati Cir San Jose, CA | 1.0 | 1.0 | 744 | $1,300 | $1.75 | 12d | 1 | 1.02mi |
| 5560 Lexington Ave San Jose, CA | 2.0 | 1.0–2.0 | 846 | $3,530 | $4.17 | 2d | 14 | 1.17mi |
| 5568 Lexington Ave San Jose, CA | 1.0–2.0 | 1.0 | 720 | $2,691 | $3.74 | 0d | 1 | 1.30mi |
| 5805 Charlotte Dr San Jose, CA | 1.0–3.0 | 1.0–2.0 | 1050 | $3,966 | $3.78 | 2d | 18 | 1.47mi |
| 4300 The Woods Dr San Jose, CA | 3.0 | 1.0–3.5 | 918 | $3,484 | $3.80 | 2d | 1 | 1.48mi |
Listing history 9 events
-
2026-06-18days on market $204,900 Active 7 DOM
-
2026-06-17days on market $204,900 Active 6 DOM
-
2026-06-16days on market $204,900 Active 5 DOM
-
2026-06-16remarks 226-char remark
-
2026-06-16price $204,900 Active 4 DOM
-
2026-06-15days on market $214,900 Active 4 DOM
-
2026-06-13days on market $214,900 Active 2 DOM
-
2026-06-13remarks 148-char remark
-
2026-06-13$214,900 Active 1 DOM
ⓘ Source: listings_history table (triggers on properties + properties_extension) + one-shot
backfill from property_details.listing_events for pre-trigger history.
Climate risk First Street
- Flood 3/10 Moderate FEMA zone D · 16% chance over 30 yrs
- Wildfire 1/10 Low
- Heat 5/10 Major 7 d/yr ≥95°F today · 14 d/yr by 30 yrs out
- Wind 1/10 Low
- Air quality 9/10 Extreme 19 unhealthy d/yr today · 19 by 30 yrs out
Nearby sold comps map
Loading sold comps map…
Walkable amenities ~0.75 mi
Loading nearby amenities…
Taxation est. · year 1
- Rental income
- $33,008
- − Mortgage interest
- −$11,478
- − Property taxes
- −$3,074
- − Insurance
- −$1,024
- − Repairs & maintenance
- −$2,641
- − Management
- −$2,641
- − Depreciation
- −$5,961
- Taxable income
- $6,191
- Est. tax owed @ 24.0%
- −$1,486
- After-tax cash flow
- $7,599/yr
For passive investors: Depreciation is non-cash, so a rental often shows a tax loss while cash-flowing — sheltering income. Rental losses are passive: they offset passive income freely, and up to $25,000/yr can offset ordinary (W-2) income if you actively participate and your MAGI is under $100k (phasing out to $0 by $150k); unused losses carry forward. On sale, claimed depreciation is recaptured at up to 25%, and gains may owe capital-gains tax (a 1031 exchange can defer both). Figures are a year-1 estimate at your 24.0% rate — not tax advice; consult a CPA.
Schools (NCES district)
- District
- Oak Grove Elementary
- NCES district ID
- 0627810
- Math proficiency
- 47% ▲ 1.00%
- Reading proficiency
- 54% ▬ 0.00%
- Median HH income
- $92,404
- Composite
- 49.23/100
- National rank
- #4382
- State rank
- #339 of 1400 in CA
Livability — San Jose
- Score
- 78/100
- State rank
- #68
- US rank
- #2559
Category grades
Schools grade is shown separately in the Schools card above.
Census & demographics
- Census place
- San Jose, CA
- County
- Santa Clara County · 1,806,974 people
- City population
- 954,479
- Metro
- San Jose-Sunnyvale-Santa Clara, CA
- Population (ZIP)
- 48,056
- Household income
- $142,433
- Rent vs Own
- Severe rent burden
- 1653.0
Population outlook (Santa Clara County) Hauer SSP2
- Today (2025)
- 2,179,074 people
- By 2030
- 2,301,297 · +5.6%
- By 2040
- 2,528,195 · +16.0%
- By 2050
- 2,712,135 · +24.5%
- By 2075
- 2,998,701 · +37.6%
- By 2100
- 2,931,429 · +34.5%
Race, ethnicity, and origin ACS 2023
- Neighborhood character
- Highly diverse neighborhood (Simpson 0.72)
- Race & ethnicity
- Asian 36% White 29% Hispanic / Latino 26% Two or more races 15% Black 4%
- Hispanic origin (detail)
- Mexican 20%
- Common ancestry
- Scotch-Irish 1% Lithuanian 1% Russian 1%
- Foreign-born
- 38% · Vietnam, Canada, China
- Languages at home
- 47% English-only · Spanish 16% Vietnamese 12% Other Indo-European 7%
Political lean MEDSL · Santa Clara
- 2024 margin
- Solid D (+40.0) · D 68.1% · R 28.1% · Other 3.8%
- 2008→2024 swing
- -0.9pp no change · 2008: 40.9pp · 2024: 40.0pp
- All cycles
- 2024: D+40.0 2020: D+47.4 2016: D+52.5 2012: D+42.1 2008: D+40.9
Not yet ingested
- Civics
- —
Market trends
- HPI YoY
- ▼ -1427.80%
- Current HPI
- 336.6634
- Rent YoY
- ▲ 3.36%
- Metro
- San Jose-Sunnyvale-Santa Clara, CA
- State GDP YoY
- ▲ 3.21%
- F500 in state
- 116
Industry mix (Fortune 500 HQ in CA)
| Industry | F500 HQs | Revenue |
|---|---|---|
| Technology | 27 | $1,492B |
|
||
| Financial Services | 3 | $174B |
|
||
| Retail | 3 | $44B |
|
||
| Insurance | 3 | $26B |
|
||
| Media / Entertainment | 2 | $115B |
|
||
| Pharmaceuticals / Biotech | 2 | $62B |
|
||
Price history
+881.3% since first listed4 events — show timeline
- 2026-06-11 Listed $214,900 MLSListings
- 2026-06-11 Listed $214,900 bridgeMLS, Bay East AOR, or Contra Costa AOR
- 2004-06-28 Sold (MLS) $17,550 MLSListings
- 2004-05-03 Listed $21,900 MLSListings
Cash-flow waterfall
monthlySold comps — $/sqft
last 12 mo · ≤1 miLoading sold comps…