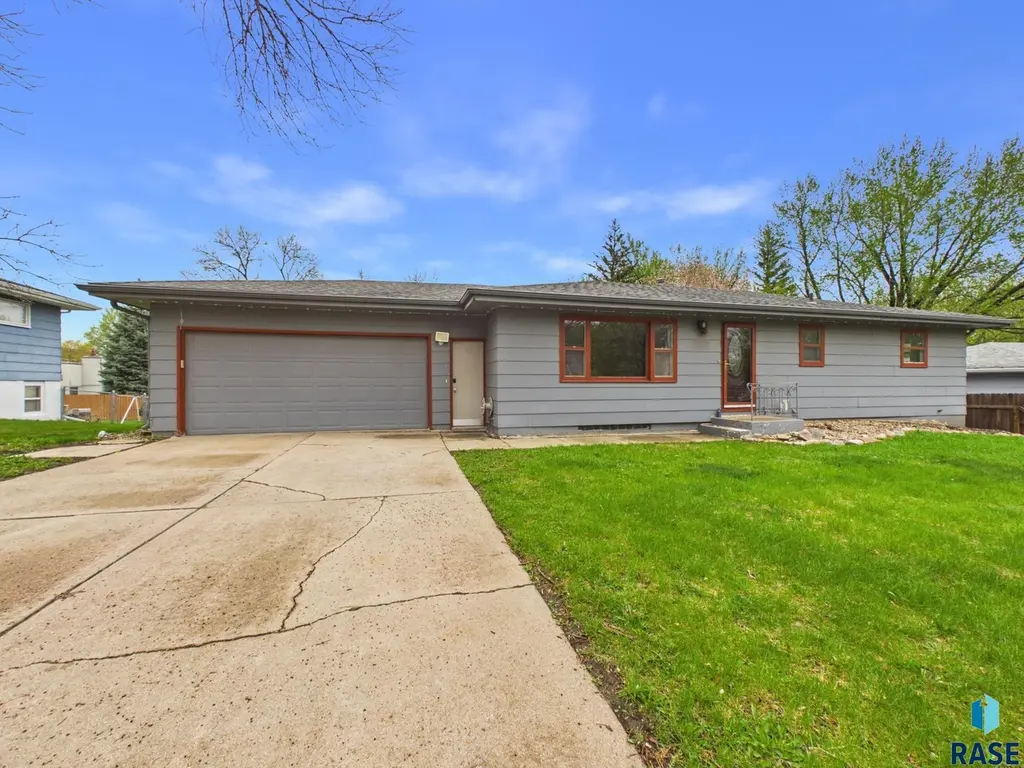
4600 W 38th St St · Sioux Falls, SD
Flood risk 1/10 · Minimal
- FEMA flood zone
- X
- Chance of flooding over 30 yrs
- 0.0%
- Est. flood insurance / yr
- $473 – $860
Fire risk 1/10 · Minimal
- Est. fire insurance / yr
- $1,342 – $2,492
Heat risk 3/10 · Minor
- Hot days now (above 99°F)
- 7 days/yr
- Hot days in 30 yrs
- 14 days/yr
Wind risk 2/10 · Minimal
- Chance of severe wind over 30 yrs
- —
Air-quality risk 2/10 · Minimal
- Unhealthy air days now
- 1 days/yr
- Unhealthy air days in 30 yrs
- 1 days/yr
Risk factors via First Street. Map © Google.
Why this score? — see what drove the D- grade
The composite is a weighted blend of 9 inputs, each scored 0–100. Each bar is that input's sub-score; the figure is the points it added to the 100-point composite (weight × sub-score).
- ARV discount +14.4/15.0
- Cash flow +6.9/30.0
- Livability +4.2/5.0
- Schools +3.7/10.0
- Rent growth +3.0/5.0
- Condition / age +2.5/5.0
- 1% rule +1.5/10.0
- DSCR +1.1/10.0
- Appreciation +0.0/10.0
$265,000
🖨 Deal sheet 📄 Offer letter ✓ Due diligence
Listing remarks MLS
South Facing Ranch Walkout. This home is located on the westside of Sioux Falls in a great school district: Oscar Howe, Memorial & Roosevelt. Main floor is finished with 1196 sqft & lower level has 600 sqft with additional room that could be finished. Features: 4 beds, 2 baths, 2 family rooms, mature trees & has a walkout basement. Must see!
Key facts
- Walkout basement
- Near dining
- Near shopping
Tags
Property features AI
Exterior
- Parking: Attached 2-car garage (22 x 22) with concrete surface
- Utilities: Public water; Public sewer; Publicly maintained asphalt road with curb and gutter
- Home design: Single-family ranch-style home; Walkout basement to backyard; City lot (approx. 88 x 118)
- Construction: Hard board siding; Block foundation; Composition roof; Built with additional finished area below grade
- Exterior features: Deck; Shed(s)
Interior
- Kitchen: Electric range; Microwave; Dishwasher; Garbage disposal
- Bedrooms: Main level master bedroom (approx. 11 x 13); Main level bedroom 2 (approx. 11 x 13); Main level bedroom 3 (approx. 10 x 10); Lower level bedroom 4 with walk-in closet (approx. 9 x 17)
- Flooring: Carpet; Laminate
- Bathrooms: Two full bathrooms total; Main level: 1 full bath; Lower/basement: 3/4 bath
- Heating & cooling: Natural gas heating; Central air conditioning; Natural gas water heater
- Interior features: Master bedroom on main level; Three or more bedrooms on the same level; Full basement
- Laundry & utility: Water softener stays
Neighborhood map
What this means for you Summary
Snapshot
- This is a 3-bed/2.0-bath single-family listed at $265k.
Deal economics
- At list price, monthly cash flow is $-403 ($-5k/yr) — negative.
- To cash-flow at today's rent, offer at most $194k (26.9% below list).
- To meet the 1% rule (rent ≥ 1% of price), the offer needs to be $173k (34.6% below list).
- Recommended offer: $173k (34.6% below list) — sets the bar for 1% rule.
- Cap rate 4.5% vs local median 2.6% in Sioux Falls — top-decile yield for the area; either an underpriced asset or a hidden risk that comps aren't pricing in. Stress-test before assuming the spread holds.
Location & tenants
- Location reads 85/100 on livability (#3 in SD, #610 nationally) — a professional / high-income tenant draw. Strengths: amenities A+, commute A+, cost of living A+; Watch: crime F.
- Sioux Falls School District 49-5 (urban): math 39% / reading 48% proficiency, ranked #45 of 59 in SD (top 76%) — families likely to look elsewhere, expect single-tenant / working-renter base with shorter leases.
- Zoned schools: Oscar Howe Elementary - 58 (math 49% / reading 48%, grade D, #132 of 253 statewide, top 52%, 586 students, 42% FRL); Roosevelt High School - 03 (math 40% / reading 60%, grade D+, #67 of 151 statewide, top 45%, 1,713 students, 28% FRL) — zoned schools at 35% FRL track the district average.
- Market conditions: Rents rising (+2.2%/yr); 393 active listings in the ZIP; 11 comparable units currently listed for rent nearby; rentals leasing fast (median 13d on market — plan ~1-2 weeks tenant-placement turnaround); solid renter incomes; 2,425 units permitted in Minnehaha County in 2024 (1,367 in 5+ unit buildings).
Forward outlook
- Local home prices are declining (-3.0%/yr); year-one equity from $2k of loan paydown is wiped out by about $8k of value loss. Plan a longer hold.
- Minnehaha County population projected at +46% by 2050 — long-run rental-demand tailwind backs the buy-and-hold thesis.
Negotiation context
- It's been on market 22 days — a 2% lower offer ($261k) is reasonable based on typical stale-listing flexibility.
- 2 sale attempts since 7y ago with the ask held roughly flat each time — persistent listings suggest the price (not the market) is what's stuck; bring a comps-based counter.
- Current owner paid $195k; 36% above their basis — modest negotiation headroom, anchor on the comps not their cost.
Questions for the listing agent
- What do current leases actually rent for vs. the listed asking? Can we see a recent rent roll and the last 12 months of T-12 income?
- Built in 1963 — when were the roof, HVAC, electrical panel, plumbing, and water heater last replaced?
- Is there a deadline driving the sale (1031 exchange, divorce, estate, relocation)? That informs how much negotiation room exists.
- Schools are B-rated — typically a magnet for longer-tenancy family renters. What's the average tenant stay here, and is there a school-zone premium baked into asking?
- Crime grade is F in this area — have there been break-ins, vandalism, or insurance claims at this property in the last 3 years? What carrier currently insures it and at what premium?
- The area grade is low — what's the realistic commute time and amenity access for the typical tenant pool here? Any planned neighborhood developments (good or bad) we should know about?
- What's the average days-on-market for RENTAL listings here right now (not sales)? A rising rental-DOM trend means longer vacancies and softer asking-rent achievability than the comps imply.
- What's the recent tenant-quality profile in this submarket — average credit score on applications, eviction rate, late-payment / NSF rate, and stable-employment percentage? A property-management company in the area should have these aggregated.
- How much new for-sale + rental construction is in the pipeline within 1–3 miles? Heavy new supply typically softens prices + rents 12–24 months out; constrained supply supports both.
Investment metrics
- 1% rule
- 0.65% ✗
- Cap rate
- 4.47%
- Cash-on-cash
- -6.52%
- DSCR
- 0.71
- GRM
- 12.7
CMA / ARV
- ARV (median comp)
- $313,152
- List price
- $265,000
- Delta
- -15.38%
- Verdict
- UNDERPRICED
- Comps
- 20 within 1.0 mi
Show comp detail 12 sales within ~0.75 mi
| Address | Dist | Beds/Ba | Sqft | Sold | Price | $/sf | Match |
|---|---|---|---|---|---|---|---|
| 3301 S Terry Ave Ave | 0.22mi | 3/2.0 | 1,796 (0%) | 4mo | $300,000 | $167 | 86 |
| 4701 W 37th St St | 0.07mi | 4/2.0 (+1) | 1,741 (-3%) | 2mo | $340,000 | $195 | 85 |
| 4508 W 39th St | 0.06mi | 4/2.0 (+1) | 1,816 (+1%) | 13mo | $339,000 | $187 | 79 |
| 5113 W 40th St St | 0.34mi | 3/2.0 | 1,612 (-10%) | 6mo | $292,000 | $181 | 61 |
| 4901 W 47th St St | 0.58mi | 4/1.5 (+1) | 1,885 (+5%) | 4mo | $260,000 | $138 | 54 |
| 5005 W 49th St St | 0.71mi | 3/3.0 | 1,764 (-2%) | 8mo | $320,000 | $181 | 53 |
| 9017 W 24th St | 0.24mi | 4/3.0 (+1) | 1,986 (+11%) | 13mo | $384,900 | $194 | 52 |
| 5600 W Circle Dr | 0.60mi | 3/2.0 | 1,964 (+9%) | 12mo | $369,900 | $188 | 46 |
| 3105 S Steven Dr | 0.73mi | 4/3.0 (+1) | 1,724 (-4%) | 13mo | $325,000 | $189 | 40 |
| 5805 W 36th St | 0.74mi | 3/2.5 | 1,934 (+8%) | 14mo | $329,000 | $170 | 39 |
| 4904 W Victoria Dr | 0.73mi | 3/2.0 | 1,548 (-14%) | 14mo | $334,750 | $216 | 32 |
| 3004 S Gibson Ave | 0.65mi | 4/2.5 (+1) | 2,032 (+13%) | 14mo | $302,500 | $149 | 29 |
Match score weights: distance 35% · size 25% · config 20% · recency 20%. Top-matched comps best support the ARV.
Projected returns pro-forma
-3.0% appreciation · 2.18% rent growth · sell at horizon
- IRR
- -28.4%
- Equity multiple
- 0.06×
- Total profit
- $-70,052
- Equity at exit
- $39,512
- IRR
- -31.2%
- Equity multiple
- -0.35×
- Total profit
- $-99,837
- Equity at exit
- $22,912
Cash invested: $74,200 (down + closing). Projections, not guarantees.
Landlord ↔ Tenant lean methodology
- Overall (STATE)
- 83 Strongly Landlord-Friendly
- State South Dakota
- 83 Strongly Landlord-Friendly · R+16
- County
- — inherits STATE
- City
- — inherits STATE
ZIP-level market 57106
- Rents YoY
- 2.2%
- Active inventory
- 393
- Price-to-rent
- 12.7×
Monthly cashflow live
- Estimated rent
- $1,734 high interval (Pro) →
- Mortgage (P&I)
- −$1,390
- Tax from tax record
- −$273 /mo · $3,275/yr
- Insurance
- −$110
- HOA
- −$0
- Vacancy / Maint / Mgmt
- −$364
- Net cashflow
- $-403
Break-even live
UW: 25.0% down · 7.5% · 30yr · 1.5% tax · 5.0% vac · 8.0% maint · 8.0% mgmt
Financing live
Cash to close
- Down payment
- $66,250
- Closing costs
- $7,950
- Reserves months
- —
- Total cash needed
- —
Loan-product check · same deal, 3 products live
Conventional
25% down · 7.5% · 30yr
- Down + closing
- —
- Monthly P&I
- —
- Monthly cashflow
- —
- DSCR
- —
- Eligible?
- —
Personal DTI + credit; lowest rate.
DSCR
20% down · 8.5% · 30yr
- Down + closing
- —
- Monthly P&I
- —
- Monthly cashflow
- —
- DSCR
- —
- Eligible?
- —
No personal income docs; deal must DSCR.
Hard money
10% down · 12.0% · 12mo
- Down + closing
- —
- Monthly P&I
- —
- Monthly cashflow
- —
- DSCR
- —
- Eligible?
- —
Short-term bridge; refi at stabilization.
Rent comps 11 comps
| Address | Beds | Baths | Sqft | Rent | $/sqft | DOM | Units | Dist |
|---|---|---|---|---|---|---|---|---|
| 4605 W Chippewa Cir Sioux Falls, SD | 1.0–2.0 | 1.0–2.0 | 1090 | $1,132 | $1.04 | 13d | 16 | 0.91mi |
| 4528 W Graceland Pl Unit 4528 Sioux Falls, SD | 3.0 | 2.0 | 1600 | $2,399 | $1.50 | 43d | 1 | 1.02mi |
| 1402 S Marion Rd Sioux Falls, SD | 1.0–3.0 | 1.0–2.0 | 1034 | $1,220 | $1.18 | 13d | 1 | 1.10mi |
| 1125 S Ebenezer Ave Sioux Falls, SD | 1.0–2.0 | 1.0–2.0 | 936 | $1,370 | $1.46 | 13d | 10 | 1.27mi |
| 5100 S Nevada Ave Sioux Falls, SD | 1.0–3.0 | 1.0–2.0 | 1056 | $1,450 | $1.37 | 13d | 10 | 1.31mi |
| 4907 S Tennis Ln Sioux Falls, SD | 3.0 | 2.0 | 1404 | $1,600 | $1.14 | 13d | 1 | 1.32mi |
| 2024 S Oxford Ave Sioux Falls, SD | 2.0 | 2.0 | 1292 | $1,700 | $1.32 | 43d | 1 | 1.32mi |
| 6612 W 47th St Sioux Falls, SD | 3.0 | 2.0 | 1546 | $1,975 | $1.28 | 43d | 1 | 1.33mi |
| 5107 S Marion Rd Sioux Falls, SD | 1.0–3.0 | 1.0–2.0 | 1050 | $1,325 | $1.26 | 13d | 4 | 1.34mi |
| 5706 W 58th St Sioux Falls, SD | 3.0 | 2.0 | 1900 | $2,095 | $1.10 | 20d | 1 | 1.36mi |
| 4313 W 58th St Sioux Falls, SD | 1.0–3.0 | 1.0–2.5 | 1142 | $1,783 | $1.56 | 13d | 16 | 1.37mi |
Listing history 5 events
-
2026-04-27$265,000 Active 713-char remark
-
2019-08-28soldstatus $195,000
-
2019-07-02$199,900 361-char remark
Show marketing remark (361 chars)
South Facing Ranch Walkout. This home is located on the westside of Sioux Falls in a great school district: Oscar Howe, Memorial & Roosevelt. Main floor is finished with 1196 sqft & lower level has 600 sqft with additional room that could be finished. Features: 4 beds, 2 baths, 2 family rooms, mature trees & has a walkout basement. Must see!
-
2012-10-17soldstatus $120,000
-
2003-09-12soldstatus $120,000
ⓘ Source: listings_history table (triggers on properties + properties_extension) + one-shot
backfill from property_details.listing_events for pre-trigger history.
Tax reassessment forecast SD · Resets to sale price
- Current annual tax
- $3,275 · $273/mo
- Projected year-2 tax
- $3,472 · $289/mo
- Expected delta
- +$197/yr (+$16/mo · 6.0%)
ⓘ Screening estimate from a state-policy table — verify with the county assessor before closing.
Climate risk First Street
- Flood 1/10 Low FEMA zone X · 0% chance over 30 yrs
- Wildfire 1/10 Low
- Heat 3/10 Moderate 7 d/yr ≥99°F today · 14 d/yr by 30 yrs out
- Wind 2/10 Low
- Air quality 2/10 Low 1 unhealthy d/yr today · 1 by 30 yrs out
Nearby sold comps map
Loading sold comps map…
Walkable amenities ~0.75 mi
Loading nearby amenities…
Taxation est. · year 1
- Rental income
- $20,807
- − Mortgage interest
- −$14,844
- − Property taxes
- −$3,275
- − Insurance
- −$1,325
- − Repairs & maintenance
- −$1,665
- − Management
- −$1,665
- − Depreciation
- −$7,709
- Taxable loss
- −$9,675
- Est. tax savings @ 24.0%
- +$2,322
- After-tax cash flow
- $-2,517/yr
For passive investors: Depreciation is non-cash, so a rental often shows a tax loss while cash-flowing — sheltering income. Rental losses are passive: they offset passive income freely, and up to $25,000/yr can offset ordinary (W-2) income if you actively participate and your MAGI is under $100k (phasing out to $0 by $150k); unused losses carry forward. On sale, claimed depreciation is recaptured at up to 25%, and gains may owe capital-gains tax (a 1031 exchange can defer both). Figures are a year-1 estimate at your 24.0% rate — not tax advice; consult a CPA.
Schools (NCES district)
- District
- Sioux Falls School District 49-5
- NCES district ID
- 4666270
- Math proficiency
- 39% ▼ -4.00%
- Reading proficiency
- 48% ▼ -2.00%
- Median HH income
- $51,093
- Composite
- 37.47/100
- National rank
- #4407
- State rank
- #45 of 59 in SD
Livability — Sioux Falls
- Score
- 85/100
- State rank
- #3
- US rank
- #610
Category grades
Schools grade is shown separately in the Schools card above.
Census & demographics
- Census place
- Sioux Falls, SD
- County
- Minnehaha County · 191,523 people
- City population
- 207,623
- Metro
- Sioux Falls, SD
- Population (ZIP)
- 51,907
- Household income
- $77,580
- Rent vs Own
- Severe rent burden
- 1500.0
Population outlook (Minnehaha County) Hauer SSP2
- Today (2025)
- 222,323 people
- By 2030
- 241,430 · +8.6%
- By 2040
- 281,643 · +26.7%
- By 2050
- 325,574 · +46.4%
- By 2075
- 469,313 · +111.1%
- By 2100
- 664,763 · +199.0%
Race, ethnicity, and origin ACS 2023
- Neighborhood character
- Predominantly White (81%)
- Race & ethnicity
- White 81% Hispanic / Latino 7% Two or more races 7% Black 5% Asian 1% Native American 1%
- Hispanic origin (detail)
- Mexican 2%
- Common ancestry
- Portuguese 12% Iranian 7% Lithuanian 2%
- Foreign-born
- 7% · Canada
- Languages at home
- 91% English-only · Spanish 5% Russian/Polish/Slavic 1% Other Indo-European 1%
Political lean MEDSL · Minnehaha
- 2024 margin
- R (+12.7) · D 42.5% · R 55.2% · Other 2.4%
- 2008→2024 swing
- -13.4pp toward R · 2008: 0.7pp · 2024: -12.7pp
- All cycles
- 2024: R+12.7 2020: R+9.5 2016: R+14.6 2012: R+7.4 2008: D+0.7
Not yet ingested
- Civics
- —
Market trends
- HPI YoY
- ▼ -138.17%
- Current HPI
- 214.9065
- Rent YoY
- ▲ 2.18%
- Metro
- Sioux Falls, SD
- State GDP YoY
- ▲ 0.70%
- F500 in state
- 2
Industry mix (Fortune 500 HQ in SD)
| Industry | F500 HQs | Revenue |
|---|---|---|
| Utilities | 1 | $1B |
|
||
Price history
+120.8% since first listed6 events — show timeline
- 2026-05-19 Pending — REALTOR® Association of the Sioux Empire
- 2026-04-27 Listed $265,000 REALTOR® Association of the Sioux Empire
- 2019-08-28 Sold (Public Records) $195,000 Public Records
- 2019-07-02 Listed $199,900 REALTOR® Association of the Sioux Empire
- 2012-10-17 Sold (Public Records) $120,000 Public Records
- 2003-09-12 Sold (Public Records) $120,000 Public Records
Property tax history
+4.3%/yrLatest (2024): $3,275 · +0.8% YoY. Source: county tax records.
Cash-flow waterfall
monthlySold comps — $/sqft
last 12 mo · ≤1 miLoading sold comps…