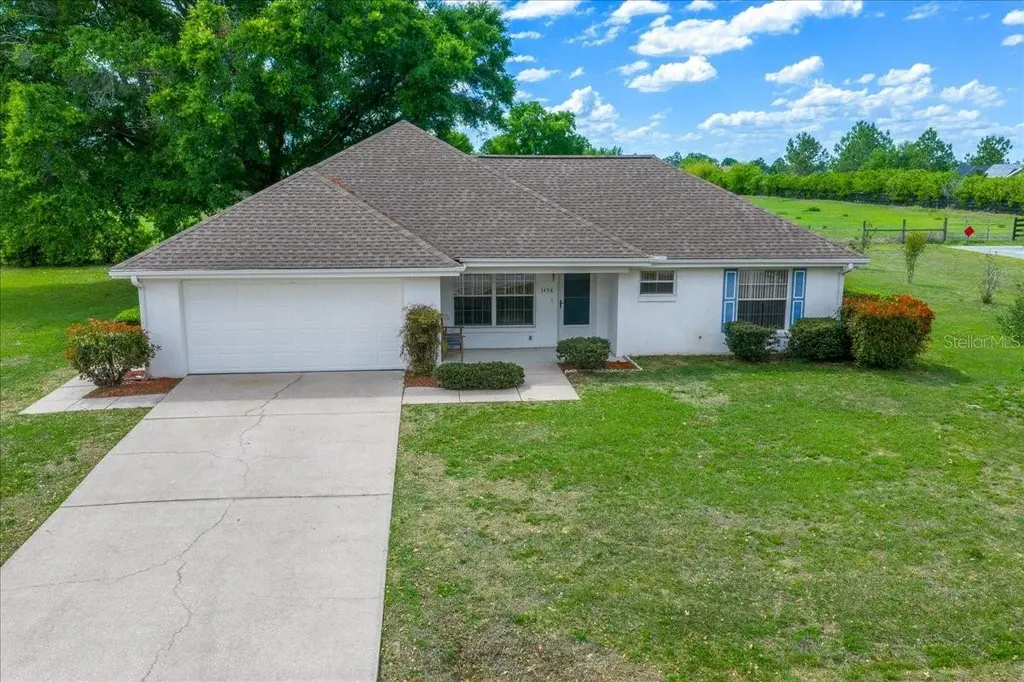
3498 NW 50th Ct · Ocala, FL
Flood risk 1/10 · Minimal
- FEMA flood zone
- X (unshaded)
- Chance of flooding over 30 yrs
- 0.0%
- Est. flood insurance / yr
- $507 – $1,088
Fire risk 5/10 · Moderate
- Est. fire insurance / yr
- $947 – $1,759
Heat risk 8/10 · Major
- Hot days now (above 107°F)
- 7 days/yr
- Hot days in 30 yrs
- 22 days/yr
Wind risk 9/10 · Severe
- Chance of severe wind over 30 yrs
- 99.0%
Air-quality risk 3/10 · Minor
- Unhealthy air days now
- 3 days/yr
- Unhealthy air days in 30 yrs
- 3 days/yr
Risk factors via First Street. Map © Google.
Why this score? — see what drove the C- grade
The composite is a weighted blend of 9 inputs, each scored 0–100. Each bar is that input's sub-score; the figure is the points it added to the 100-point composite (weight × sub-score).
- Cash flow +16.4/30.0
- ARV discount +14.1/15.0
- DSCR +5.1/10.0
- Rent growth +5.0/5.0
- 1% rule +4.6/10.0
- Schools +3.6/10.0
- Livability +3.5/5.0
- Condition / age +2.5/5.0
- Appreciation +0.0/10.0
$258,000
🖨 Deal sheet 📄 Offer letter ✓ Due diligence
Listing remarks MLS
Quail Meadow rests in the heart of the rapidly growing Equestrian corridor of Ocala. This home features 3 bedrooms, 2 baths in a split floor plan, large living room, dining area and open kitchen. The roof was replaced in 2017, and the HVAC is 2016. The Quarterly HOA fees are only $110 which includes a large clubhouse with weekly activities and community pool. Quail Meadow offers easy access to Publix, Walgreens, I-75 and The World Equestrian Center that is now open to the public, hosting horse shows, entertainment and many restaurants and shopping. Within 90 minutes of Ocala, you could spend the day at Disney, drive onto the beaches of Daytona or enjoy fishing in the Gulf off Cedar Key. This is a 55+ Community with Deed Restrictions. This home is available for a quick closing!!
Key facts
- Community pool
- Large clubhouse
- Equestrian corridor
Tags
Neighborhood map
What this means for you Summary
Snapshot
- This is a 3-bed/2.0-bath single-family listed at $258k.
Deal economics
- At list price, monthly cash flow is $144 ($2k/yr) — positive.
- The deal already cash-flows at list — no discount required.
- To meet the 1% rule (rent ≥ 1% of price), the offer needs to be $249k (3.5% below list).
- Recommended offer: $243k (6.0% below list) — sets the bar for market timing.
- Cap rate 7.0% vs local median 4.2% in Ocala — top-decile yield for the area; either an underpriced asset or a hidden risk that comps aren't pricing in. Stress-test before assuming the spread holds.
Location & tenants
- Location reads 69/100 on livability (#476 in FL) — a middle-class / working-renter tenant base. Strengths: cost of living A+, housing A+, health & safety A+; Watch: crime F, amenities F, commute F.
- Marion (rural): math 42% / reading 43% proficiency, ranked #61 of 73 in FL (top 84%) — families likely to look elsewhere, expect single-tenant / working-renter base with shorter leases; 61% free/reduced lunch — lower-income household profile, screen leases tightly.
- Market conditions: Rents rising fast (+11.1%/yr); 663 active listings in the ZIP; 40 comparable units currently listed for rent nearby; rentals at typical pace (median 21d on market — plan ~3-4 weeks tenant-placement turnaround); 7,071 units permitted in Marion County in 2024 (534 in 5+ unit buildings).
- At $2,490/mo this rent would consume 45% of the median local household income ($66k/yr) (locally 282% of renters already pay >50% of income on rent) — very limited rent-growth headroom before tenants either downsize or default.
Forward outlook
- Local home prices are declining (-3.0%/yr); year-one equity from $2k of loan paydown is wiped out by about $8k of value loss. Plan a longer hold.
- Marion County population projected at +13% by 2050 — modest demand growth; plan on rents tracking national, not racing it.
- At projected returns (-3.0% appreciation + 8.0% rent growth), your $72k cash investment doubles in ~10 years — after that, you're playing with house money.
Negotiation context
- It's been on market 66 days — a 6% lower offer ($243k) is reasonable based on typical stale-listing flexibility.
- Current owner paid $75k; list at $258k implies a 244% gain — meaningful room to come down on a strong offer.
Risks & watch-outs
- Climate carrying-cost: severe wind risk, 99% chance of damaging wind over 30y; moderate wildfire risk; extreme-heat days projected 7→22/yr by 2055 (HVAC capex compounding) — expect insurance premiums to compound above CPI over the hold.
Questions for the listing agent
- It's been on market 66 days. Have you received any prior offers? Is the seller open to a 6% concession, seller financing, or rate buy-down credit?
- What does the HOA fee cover, when was the last increase, and are there any pending special assessments or reserve-fund shortfalls?
- Why hasn't it sold? Are there any deal-killer items the seller is aware of (foundation, flood, title, zoning, code violations)?
- Is there a deadline driving the sale (1031 exchange, divorce, estate, relocation)? That informs how much negotiation room exists.
- Crime grade is F in this area — have there been break-ins, vandalism, or insurance claims at this property in the last 3 years? What carrier currently insures it and at what premium?
- What's the average days-on-market for RENTAL listings here right now (not sales)? A rising rental-DOM trend means longer vacancies and softer asking-rent achievability than the comps imply.
- What's the recent tenant-quality profile in this submarket — average credit score on applications, eviction rate, late-payment / NSF rate, and stable-employment percentage? A property-management company in the area should have these aggregated.
- How much new for-sale + rental construction is in the pipeline within 1–3 miles? Heavy new supply typically softens prices + rents 12–24 months out; constrained supply supports both.
Investment metrics
- 1% rule
- 0.96% ✗
- Cap rate
- 6.96%
- Cash-on-cash
- 2.40%
- DSCR
- 1.11
- GRM
- 8.6
CMA / ARV
- ARV (median comp)
- $302,644
- List price
- $258,000
- Delta
- -14.75%
- Verdict
- UNDERPRICED
- Comps
- 20 within 1.0 mi
Show comp detail 9 sales within ~0.75 mi
| Address | Dist | Beds/Ba | Sqft | Sold | Price | $/sf | Match |
|---|---|---|---|---|---|---|---|
| 4998 NW 30th Pl | 0.38mi | 3/2.0 | 1,476 (-2%) | 9mo | $259,000 | $175 | 71 |
| 4802 NW 39th Street Rd | 0.45mi | 2/2.0 (-1) | 1,565 (+4%) | 1mo | $256,150 | $164 | 67 |
| 5361 NW 33rd Pl | 0.24mi | 2/2.0 (-1) | 1,318 (-13%) | 4mo | $230,000 | $175 | 59 |
| 5520 NW 26th Ln | 0.72mi | 3/2.0 | 1,526 (+1%) | 8mo | $215,000 | $141 | 58 |
| 5160 NW 25th Loop | 0.67mi | 2/2.0 (-1) | 1,569 (+4%) | 8mo | $237,500 | $151 | 51 |
| 4043 NW 44th Cir | 0.70mi | 2/2.0 (-1) | 1,614 (+7%) | 3mo | $259,990 | $161 | 49 |
| 5190 NW 26th Ln | 0.62mi | 2/2.0 (-1) | 1,344 (-11%) | 2mo | $215,000 | $160 | 46 |
| 3901 NW 49th Ct | 0.34mi | 2/2.0 (-1) | 1,666 (+10%) | 20mo | $315,000 | $189 | 46 |
| 5405 NW 25th Loop | 0.69mi | 2/2.0 (-1) | 1,590 (+5%) | 22mo | $275,000 | $173 | 36 |
Match score weights: distance 35% · size 25% · config 20% · recency 20%. Top-matched comps best support the ARV.
Projected returns pro-forma
-3.0% appreciation · 8.0% rent growth · sell at horizon
- IRR
- -6.9%
- Equity multiple
- 0.73×
- Total profit
- $-19,401
- Equity at exit
- $38,469
- IRR
- 8.1%
- Equity multiple
- 1.76×
- Total profit
- $55,068
- Equity at exit
- $22,307
Cash invested: $72,240 (down + closing). Projections, not guarantees.
Landlord ↔ Tenant lean methodology
- Overall (STATE)
- 87 Strongly Landlord-Friendly
- State Florida
- 87 Strongly Landlord-Friendly · R+3
- County
- — inherits STATE
- City
- — inherits STATE
ZIP-level market 34482
- Rents YoY
- 11.1%
- Active inventory
- 663
- Price-to-rent
- 8.6×
Monthly cashflow live
- Estimated rent
- $2,490 high interval (Pro) →
- Mortgage (P&I)
- −$1,353
- Tax from tax record
- −$326 /mo · $3,912/yr
- Insurance
- −$108
- HOA
- −$36
- Vacancy / Maint / Mgmt
- −$523
- Net cashflow
- $144
Break-even live
UW: 25.0% down · 7.5% · 30yr · 1.5% tax · 5.0% vac · 8.0% maint · 8.0% mgmt
Financing live
Cash to close
- Down payment
- $64,500
- Closing costs
- $7,740
- Reserves months
- —
- Total cash needed
- —
Loan-product check · same deal, 3 products live
Conventional
25% down · 7.5% · 30yr
- Down + closing
- —
- Monthly P&I
- —
- Monthly cashflow
- —
- DSCR
- —
- Eligible?
- —
Personal DTI + credit; lowest rate.
DSCR
20% down · 8.5% · 30yr
- Down + closing
- —
- Monthly P&I
- —
- Monthly cashflow
- —
- DSCR
- —
- Eligible?
- —
No personal income docs; deal must DSCR.
Hard money
10% down · 12.0% · 12mo
- Down + closing
- —
- Monthly P&I
- —
- Monthly cashflow
- —
- DSCR
- —
- Eligible?
- —
Short-term bridge; refi at stabilization.
Rent comps 40 comps
| Address | Beds | Baths | Sqft | Rent | $/sqft | DOM | Units | Dist |
|---|---|---|---|---|---|---|---|---|
| 5048 NW 35th St Ocala, FL | 3.0 | 2.0 | 1552 | $1,900 | $1.22 | 13d | 1 | 0.00mi |
| 5191 NW 34th St Ocala, FL | 2.0 | 2.0 | 1318 | $2,400 | $1.82 | 21d | 1 | 0.13mi |
| 3335 NW 52nd Avenue Rd Ocala, FL | 2.0 | 2.5 | 1318 | $2,500 | $1.90 | 21d | 1 | 0.14mi |
| 5333 NW 33rd Pl Ocala, FL | 2.0 | 2.0 | 1368 | $2,300 | $1.68 | 13d | 1 | 0.25mi |
| 5361 NW 33rd Pl Ocala, FL | 2.0 | 2.0 | 1318 | $2,500 | $1.90 | 21d | 1 | 0.27mi |
| 4958 NW 35th Lane Rd Ocala, FL | 4.0 | 2.0 | 1998 | $3,000 | $1.50 | 21d | 1 | 0.28mi |
| 5423 NW 35th Lane Rd Ocala, FL | 2.0 | 2.0 | 1656 | $3,200 | $1.93 | 21d | 1 | 0.33mi |
| 5471 NW 34th St Ocala, FL | 2.0 | 2.0 | 1318 | $2,900 | $2.20 | 21d | 1 | 0.34mi |
| 4859 NW 35th Lane Rd Ocala, FL | 2.0 | 2.0 | 1666 | $2,495 | $1.50 | 21d | 1 | 0.34mi |
| 3384 NW 54th Ct Ocala, FL | 2.0 | 2.5 | 1722 | $2,300 | $1.34 | 21d | 1 | 0.35mi |
| 5353 N US Highway 27 Ocala, FL | 1.0–3.0 | 1.0–2.0 | 1169 | $2,045 | $1.75 | 21d | 1 | 0.35mi |
| 4932 NW 39th Loop Ocala, FL | 4.0 | 2.0 | 2036 | $2,700 | $1.33 | 21d | 1 | 0.38mi |
| 4122 NW 48th Terrace Rd Ocala, FL | 2.0 | 2.0 | 1816 | $1,999 | $1.10 | 13d | 1 | 0.47mi |
| 4743 NW 39th Street Rd Ocala, FL | 3.0 | 2.0 | 1565 | $2,500 | $1.60 | 21d | 1 | 0.50mi |
| 4110 NW 44th Cir Ocala, FL | 3.0 | 2.0 | 1610 | $2,400 | $1.49 | 13d | 1 | 0.59mi |
| 4111 NW 44th Cir Ocala, FL | 3.0 | 2.0 | 1505 | $2,300 | $1.53 | 13d | 1 | 0.62mi |
| 4078 NW 44th Cir Ocala, FL | 3.0 | 2.0 | 1504 | $2,500 | $1.66 | 21d | 1 | 0.63mi |
| 5530 NW 40th Loop Ocala, FL | 3.0 | 2.0 | 1622 | $2,000 | $1.23 | 21d | 1 | 0.70mi |
| 4342 NW 55th Ct Ocala, FL | 3.0 | 2.5 | 2172 | $2,600 | $1.20 | 13d | 1 | 0.78mi |
| 4395 NW 55th Ter Ocala, FL | 3.0 | 2.0 | 1853 | $2,700 | $1.46 | 21d | 1 | 0.83mi |
| 5252 NW 46th Lane Rd Ocala, FL | 4.0 | 2.0 | 2034 | $2,800 | $1.38 | 21d | 1 | 0.84mi |
| 5227 NW 46th Lane Rd Ocala, FL | 4.0 | 2.0 | 2034 | $3,000 | $1.47 | 21d | 1 | 0.85mi |
| 5254 NW 43rd Lane Rd Ocala, FL | 3.0 | 2.0 | 1728 | $3,500 | $2.03 | 21d | 1 | 0.92mi |
| 5347 NW 46th Lane Rd Ocala, FL | 3.0 | 2.0 | 1552 | $2,550 | $1.64 | 21d | 1 | 0.94mi |
| 5521 NW 45th Ln Ocala, FL | 3.0 | 2.0 | 1862 | $2,600 | $1.40 | 13d | 1 | 0.95mi |
| 5416 NW 46th Lane Rd Ocala, FL | 3.0 | 2.0 | 1590 | $2,300 | $1.45 | 13d | 1 | 0.99mi |
| 5358 NW 48th Pl Ocala, FL | 3.0 | 2.0 | 1565 | $2,500 | $1.60 | 21d | 1 | 1.02mi |
| 5237 NW 48th Pl Ocala, FL | 3.0 | 2.0 | 1552 | $4,500 | $2.90 | 21d | 1 | 1.02mi |
| 5293 NW 48th Pl Ocala, FL | 2.0 | 2.0 | 1552 | $2,450 | $1.58 | 21d | 1 | 1.03mi |
| 5375 NW 48th Pl Ocala, FL | 2.0 | 2.0 | 1565 | $2,350 | $1.50 | 21d | 1 | 1.05mi |
| 5389 NW 48th Pl Ocala, FL | 2.0 | 2.0 | 1552 | $2,300 | $1.48 | 21d | 1 | 1.05mi |
| 2048 NW 50th Ave Ocala, FL | 2.0 | 2.0 | 1062 | $2,250 | $2.12 | 21d | 1 | 1.06mi |
| 2038 NW 50th Ave Ocala, FL | 2.0 | 2.0 | 1062 | $2,250 | $2.12 | 21d | 1 | 1.07mi |
| 2028 NW 50th Ave Ocala, FL | 2.0 | 2.0 | 1066 | $1,595 | $1.50 | 21d | 1 | 1.08mi |
| 1918 NW 50th Cir Ocala, FL | 2.0 | 2.0 | 1061 | $2,200 | $2.07 | 21d | 1 | 1.11mi |
| 5399 NW 18th St Ocala, FL | 2.0 | 2.0 | 1085 | $2,100 | $1.94 | 13d | 1 | 1.27mi |
| 5399 NW 18th St Ocala, FL | 2.0 | 2.0 | 1085 | $2,100 | $1.94 | 21d | 1 | 1.27mi |
| 4530 NW 14th Loop Ocala, FL | 3.0 | 2.5 | 1966 | $2,250 | $1.14 | 13d | 1 | 1.36mi |
| 4522 NW 14th Loop Ocala, FL | 4.0 | 3.0 | 2028 | $2,050 | $1.01 | 13d | 1 | 1.38mi |
| 1632 NW 44th Court Rd Ocala, FL | 4.0 | 3.0 | 2039 | $2,200 | $1.08 | 21d | 1 | 1.40mi |
HOA detail
- Monthly dues
- $36 · $432/yr
- Likely covers
- pool
Listing history 17 events
-
2026-06-18days on market $258,000 Active 66 DOM
-
2026-06-17days on market $258,000 Active 65 DOM
-
2026-06-16days on market $258,000 Active 64 DOM
-
2026-06-15days on market $258,000 Active 63 DOM
-
2026-06-14days on market $258,000 Active 61 DOM
-
2026-06-13days on market $258,000 Active 60 DOM
-
2026-06-10days on market $258,000 Active 58 DOM
-
2026-06-09days on market $258,000 Active 57 DOM
-
2026-06-08days on market $258,000 Active 56 DOM
-
2026-06-07days on market $258,000 Active 55 DOM
-
2026-06-03days on market $258,000 Active 51 DOM
-
2026-06-02days on market $258,000 Active 50 DOM
-
2026-06-01days on market $258,000 Active 49 DOM
-
2026-05-31days on market $258,000 Active 48 DOM
-
2026-05-30days on market $258,000 Active 47 DOM
-
2026-04-13$258,000 Active 788-char remark
Show marketing remark (788 chars)
Quail Meadow rests in the heart of the rapidly growing Equestrian corridor of Ocala. This home features 3 bedrooms, 2 baths in a split floor plan, large living room, dining area and open kitchen. The roof was replaced in 2017, and the HVAC is 2016. The Quarterly HOA fees are only $110 which includes a large clubhouse with weekly activities and community pool. Quail Meadow offers easy access to Publix, Walgreens, I-75 and The World Equestrian Center that is now open to the public, hosting horse shows, entertainment and many restaurants and shopping. Within 90 minutes of Ocala, you could spend the day at Disney, drive onto the beaches of Daytona or enjoy fishing in the Gulf off Cedar Key. This is a 55+ Community with Deed Restrictions. This home is available for a quick closing!!
-
1995-02-24soldstatus $75,000
ⓘ Source: listings_history table (triggers on properties + properties_extension) + one-shot
backfill from property_details.listing_events for pre-trigger history.
Tax reassessment forecast FL · Resets to sale price
- Current annual tax
- $3,912 · $326/mo
- Projected year-2 tax
- $3,912 · $326/mo
- Expected delta
- $0/yr ($0/mo · 0.0%)
ⓘ Screening estimate from a state-policy table — verify with the county assessor before closing.
Climate risk First Street
- Flood 1/10 Low FEMA zone X (unshaded) · 0% chance over 30 yrs
- Wildfire 5/10 Major
- Heat 8/10 Severe 7 d/yr ≥107°F today · 22 d/yr by 30 yrs out
- Wind 9/10 Extreme 99% chance of damaging wind over 30 yrs
- Air quality 3/10 Moderate 3 unhealthy d/yr today · 3 by 30 yrs out
Nearby sold comps map
Loading sold comps map…
Walkable amenities ~0.75 mi
Loading nearby amenities…
Taxation est. · year 1
- Rental income
- $29,874
- − Mortgage interest
- −$14,452
- − Property taxes
- −$3,912
- − Insurance
- −$1,290
- − Repairs & maintenance
- −$2,390
- − Management
- −$2,390
- − HOA
- −$432
- − Depreciation
- −$7,505
- Taxable loss
- −$2,497
- Est. tax savings @ 24.0%
- +$599
- After-tax cash flow
- $2,330/yr
For passive investors: Depreciation is non-cash, so a rental often shows a tax loss while cash-flowing — sheltering income. Rental losses are passive: they offset passive income freely, and up to $25,000/yr can offset ordinary (W-2) income if you actively participate and your MAGI is under $100k (phasing out to $0 by $150k); unused losses carry forward. On sale, claimed depreciation is recaptured at up to 25%, and gains may owe capital-gains tax (a 1031 exchange can defer both). Figures are a year-1 estimate at your 24.0% rate — not tax advice; consult a CPA.
Schools (NCES district)
- District
- Marion
- NCES district ID
- 1201260
- Math proficiency
- 42% ▼ -7.00%
- Reading proficiency
- 43% ▼ -4.00%
- Median HH income
- $40,015
- Composite
- 35.61/100
- National rank
- #4890
- State rank
- #61 of 73 in FL
Livability — Ocala
- Score
- 69/100
- State rank
- #476
- US rank
- #8461
Category grades
Schools grade is shown separately in the Schools card above.
Census & demographics
- County
- Marion County · 315,796 people
- City population
- 263,375
- Metro
- Ocala, FL
- Population (ZIP)
- 22,807
- Household income
- $65,901
- Rent vs Own
- Severe rent burden
- 282.0
Population outlook (Marion County) Hauer SSP2
- Today (2025)
- 365,905 people
- By 2030
- 376,768 · +3.0%
- By 2040
- 396,555 · +8.4%
- By 2050
- 412,723 · +12.8%
- By 2075
- 446,090 · +21.9%
- By 2100
- 436,193 · +19.2%
Race, ethnicity, and origin ACS 2023
- Neighborhood character
- Majority White (63%)
- Race & ethnicity
- White 63% Hispanic / Latino 19% Black 14% Two or more races 12%
- Hispanic origin (detail)
- Mexican 6% Puerto Rican 9% Cuban 2%
- Common ancestry
- Lithuanian 2% Romanian 2% Slovak 2%
- Foreign-born
- 10% · Canada
- Languages at home
- 81% English-only · Spanish 16% Other Indo-European 1%
Political lean MEDSL · Marion
- 2024 margin
- Solid R (+31.6) · D 33.8% · R 65.5%
- 2008→2024 swing
- -20.0pp toward R · 2008: -11.6pp · 2024: -31.6pp
- All cycles
- 2024: R+31.6 2020: R+25.9 2016: R+26.2 2012: R+16.2 2008: R+11.6
Not yet ingested
- Civics
- —
Market trends
- HPI YoY
- ▼ -133.62%
- Current HPI
- 194.3857
- Rent YoY
- ▲ 11.12%
- Metro
- Ocala, FL
- State GDP YoY
- ▲ 3.28%
- F500 in state
- 36
Industry mix (Fortune 500 HQ in FL)
| Industry | F500 HQs | Revenue |
|---|---|---|
| Industrial Technology | 2 | $29B |
|
||
| Insurance | 2 | $17B |
|
||
| Retail | 1 | $60B |
|
||
| Technology Distribution | 1 | $58B |
|
||
| Homebuilding | 1 | $35B |
|
||
| Technology Manufacturing | 1 | $35B |
|
||
Price history
+244.0% since first listed2 events — show timeline
- 2026-04-13 Listed $258,000 Stellar MLS as Distributed by MLS Grid
- 1995-02-24 Sold (Public Records) $75,000 Public Records
Property tax history
+12.9%/yrLatest (2025): $3,912 · +90.4% YoY. Source: county tax records.
Cash-flow waterfall
monthlySold comps — $/sqft
last 12 mo · ≤1 miLoading sold comps…