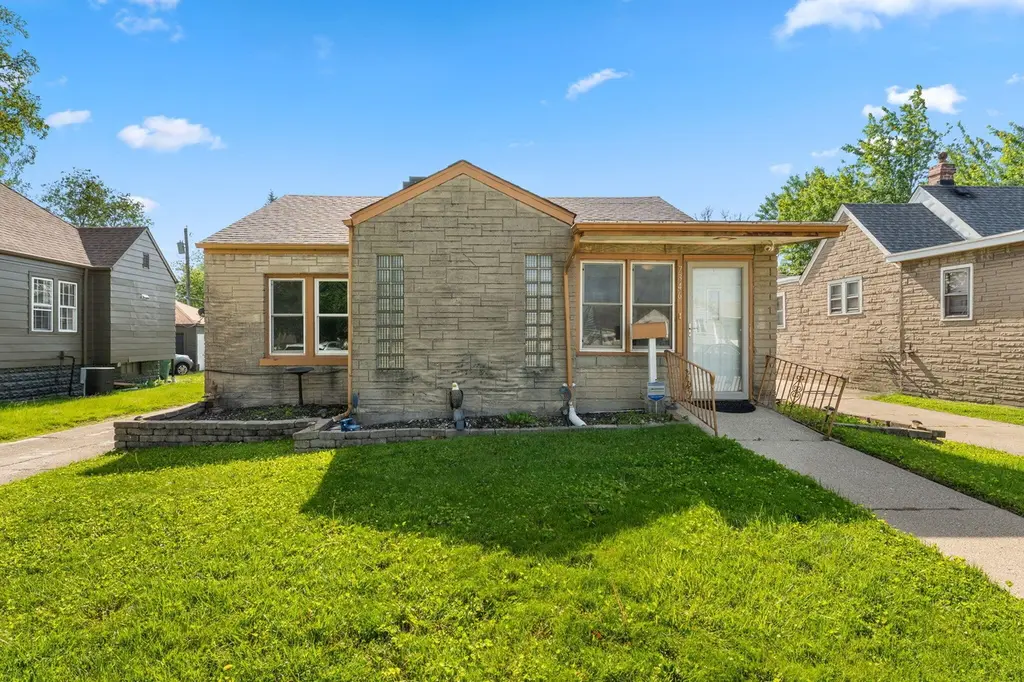
7346 Alexander Ave · Hammond, IN
Flood risk 4/10 · Minor
- FEMA flood zone
- X
- Chance of flooding over 30 yrs
- 0.22%
- Est. flood insurance / yr
- $473 – $860
Fire risk 1/10 · Minimal
- Est. fire insurance / yr
- $717 – $1,331
Heat risk 3/10 · Minor
- Hot days now (above 102°F)
- 7 days/yr
- Hot days in 30 yrs
- 15 days/yr
Wind risk 2/10 · Minimal
- Chance of severe wind over 30 yrs
- 0.0%
Air-quality risk 4/10 · Minor
- Unhealthy air days now
- 5 days/yr
- Unhealthy air days in 30 yrs
- 6 days/yr
Risk factors via First Street. Map © Google.
Why this score? — see what drove the C- grade
The composite is a weighted blend of 9 inputs, each scored 0–100. Each bar is that input's sub-score; the figure is the points it added to the 100-point composite (weight × sub-score).
- Cash flow +17.0/30.0
- ARV discount +14.2/15.0
- DSCR +5.3/10.0
- 1% rule +3.9/10.0
- Livability +3.5/5.0
- Rent growth +2.5/5.0
- Condition / age +2.5/5.0
- Schools +1.1/10.0
- Appreciation +0.0/10.0
$169,900
🖨 Deal sheet (PDF) 📄 Offer letter ✓ Due diligence
Listing remarks MLS
Nice 2 bedroom all brick ranch home with fireplace in move in condition. Basement with bonus room and cellar. New windows, fresh paint, and central air. All appliances stay including washer & dryer. Oversized garage (29 x 25). Walking distance to Purdue Northwest Calumet Campus and Morton Elementary School. Easy access to 94 and 41. Great home for first time home buyers or great income property.
Key facts
- Brand new roof
- Large kitchen
- Oversized garage
Tags
Property features AI
Exterior
- Parking: Off-street parking via driveway; Garage with approximately 2.5 spaces
- Utilities: Public water; Public sewer; Natural gas connected
- Home design: One-story brick home; Built in 1938; Shingle roof
- Construction: Brick construction; Shingle roof; Unfinished basement (foundation present); Year built 1938
- Exterior features: Enclosed front porch; Neighborhood view; No pool
Interior
- Kitchen: Dishwasher; Refrigerator; Gas range; Gas water heater
- Bedrooms: Primary bedroom; Second bedroom
- Bathrooms: 1 full bathroom
- Heating & cooling: Forced air heating (natural gas); Central air conditioning
- Interior features: Living room fireplace; Unfinished basement; No additional listed interior features
- Laundry & utility: Washer/dryer not specified
Neighborhood map
What this means for you Summary
Snapshot
- This is a 2-bed/1.0-bath single-family listed at $170k.
Deal economics
- At list price, monthly cash flow is $114 ($1k/yr) — positive.
- The deal already cash-flows at list — no discount required.
- To meet the 1% rule (rent ≥ 1% of price), the offer needs to be $151k (10.9% below list).
- Recommended offer: $151k (10.9% below list) — sets the bar for 1% rule.
- Cap rate 7.1% vs local median 5.8% in Hammond — meaningfully above typical; check what's discounted (condition, days-on-market, listing class) to confirm the premium yield is real.
Location & tenants
- Location reads 70/100 on livability (#143 in IN) — a middle-class / working-renter tenant base. Strengths: cost of living A+, housing A+, commute A; Watch: health & safety D+, employment D, crime F.
- School City Of Hammond (suburban): math 8% / reading 18% proficiency, ranked #289 of 301 in IN (top 96%) — low school quality limits family demand, transient renter base, plan for 1-2y turnover; 74% free/reduced lunch — lower-income household profile, screen leases tightly.
- Zoned schools: Morton Elementary School (math 7% / reading 8%, grade F, #949 of 994 statewide, top 97%, 476 students, 68% FRL); Charles N Scott Middle School (math 5% / reading 15%, grade F, #314 of 330 statewide, top 95%, 738 students, 75% FRL); Morton Senior High School (math 12% / reading 54%, grade F, #290 of 369 statewide, top 79%, 1,609 students, 69% FRL) — zoned schools at 71% FRL track the district average.
- Market conditions: 62 active listings in the ZIP; 8 comparable units currently listed for rent nearby; rentals leasing fast (median 7d on market — plan ~1-2 weeks tenant-placement turnaround); 1,642 units permitted in Lake County in 2024 (14 in 5+ unit buildings).
- This rent runs 30% of the median local income ($60k/yr) — at the standard rent-burdened threshold; future hikes will face affordability resistance.
Forward outlook
- Local home prices are declining (-3.0%/yr); year-one equity from $1k of loan paydown is wiped out by about $5k of value loss. Plan a longer hold.
- Lake County population projected to shrink 7% by 2050 — rents likely to lag national; underwrite the cash flow, not the appreciation.
Negotiation context
- Only 8 days on market — expect competitive offers; lowballing is unlikely to land.
- 4 sale attempts since 24y ago with the ask held roughly flat each time — persistent listings suggest the price (not the market) is what's stuck; bring a comps-based counter.
- Current owner paid $81k; list at $170k implies a 110% gain — meaningful room to come down on a strong offer.
Risks & watch-outs
- Watch-outs: built in 1938 — expect roof / HVAC / electrical / plumbing capex.
Questions for the listing agent
- Built in 1938 — when were the roof, HVAC, electrical panel, plumbing, and water heater last replaced?
- Is there a deadline driving the sale (1031 exchange, divorce, estate, relocation)? That informs how much negotiation room exists.
- Schools are F-rated, which usually means shorter tenancies and higher turnover. Who's the typical renter profile here, and what's been the actual vacancy rate?
- Crime grade is F in this area — have there been break-ins, vandalism, or insurance claims at this property in the last 3 years? What carrier currently insures it and at what premium?
- What's the average days-on-market for RENTAL listings here right now (not sales)? A rising rental-DOM trend means longer vacancies and softer asking-rent achievability than the comps imply.
- What's the recent tenant-quality profile in this submarket — average credit score on applications, eviction rate, late-payment / NSF rate, and stable-employment percentage? A property-management company in the area should have these aggregated.
- How much new for-sale + rental construction is in the pipeline within 1–3 miles? Heavy new supply typically softens prices + rents 12–24 months out; constrained supply supports both.
Investment metrics
- 1% rule
- 0.89% ✗
- Cap rate
- 7.10%
- Cash-on-cash
- 2.88%
- DSCR
- 1.13
- GRM
- 9.4
CMA / ARV
- ARV (on-the-fly)
- $199,782
- Comps found
- 12
Show comp detail 12 sales within ~0.75 mi
| Address | Dist | Beds/Ba | Sqft | Sold | Price | $/sf | Match |
|---|---|---|---|---|---|---|---|
| 7411 Marshall Ave | 0.10mi | 2/1.0 | 865 (-14%) | 2mo | $171,000 | $198 | 70 |
| 7007 Marshall Ave | 0.49mi | 3/1.0 (+1) | 1,032 (+2%) | 1mo | $209,000 | $203 | 68 |
| 7516 Alexander Ave | 0.18mi | 3/1.0 (+1) | 936 (-7%) | 12mo | $193,000 | $206 | 64 |
| 7112 Schneider Ave | 0.46mi | 3/1.0 (+1) | 980 (-3%) | 10mo | $196,000 | $200 | 60 |
| 7108 California Ave | 0.51mi | 3/1.0 (+1) | 1,038 (+3%) | 10mo | $180,000 | $173 | 58 |
| 7142 Wicker Ave | 0.46mi | 2/1.0 | 903 (-10%) | 5mo | $189,900 | $210 | 57 |
| 7527 Alexander Ave | 0.21mi | 3/1.0 (+1) | 900 (-11%) | 14mo | $176,900 | $197 | 56 |
| 7146 Lindberg Ave | 0.31mi | 3/1.0 (+1) | 1,116 (+11%) | 9mo | $160,000 | $143 | 55 |
| 7045 Alabama Ave | 0.44mi | 2/1.0 | 862 (-15%) | 8mo | $150,000 | $174 | 49 |
| 6909 Lindberg Ave | 0.59mi | 3/1.0 (+1) | 1,092 (+8%) | 8mo | $184,000 | $168 | 47 |
| 7134 Parrish Ave | 0.69mi | 3/1.0 (+1) | 864 (-14%) | 7mo | $150,000 | $174 | 33 |
| 7146 Parrish Ave | 0.67mi | 3/1.0 (+1) | 864 (-14%) | 8mo | $211,000 | $244 | 33 |
Match score weights: distance 35% · size 25% · config 20% · recency 20%. Top-matched comps best support the ARV.
Projected returns pro-forma
-3.0% appreciation · 3.0% rent growth · sell at horizon
- IRR
- -11.8%
- Equity multiple
- 0.57×
- Total profit
- $-20,287
- Equity at exit
- $25,333
- IRR
- -2.6%
- Equity multiple
- 0.82×
- Total profit
- $-8,433
- Equity at exit
- $14,690
Cash invested: $47,572 (down + closing). Projections, not guarantees.
Landlord ↔ Tenant lean methodology
- Overall (STATE)
- 90 Strongly Landlord-Friendly
- State Indiana
- 90 Strongly Landlord-Friendly · R+11
- County
- — inherits STATE
- City
- — inherits STATE
ZIP-level market 46323
- Home prices YoY
- -18.8%
- Active inventory
- 62
- Price-to-rent
- 9.4×
Monthly cashflow live
- Estimated rent
- $1,513 high interval (Pro) →
- Mortgage (P&I)
- −$891
- Tax from tax record
- −$120 /mo · $1,435/yr
- Insurance
- −$71
- HOA
- −$0
- Vacancy / Maint / Mgmt
- −$318
- Net cashflow
- $114
Break-even live
Sensitivity live
| Price | -10% $210 | -5% $162 | +0% $114 | +5% $66 | +10% $18 |
|---|---|---|---|---|---|
| Rent | -10% $-5 | -5% $54 | +0% $114 | +5% $174 | +10% $234 |
| Rate | -1.0pp $200 | -0.5pp $157 | base $114 | +0.5pp $70 | +1.0pp $25 |
UW: 25.0% down · 7.5% · 30yr · 1.5% tax · 5.0% vac · 8.0% maint · 8.0% mgmt
Financing live
Cash to close
- Down payment
- $42,475
- Closing costs
- $5,097
- Reserves months
- —
- Total cash needed
- —
Loan-product check · same deal, 3 products live
Conventional
25% down · 7.5% · 30yr
- Down + closing
- —
- Monthly P&I
- —
- Monthly cashflow
- —
- DSCR
- —
- Eligible?
- —
Personal DTI + credit; lowest rate.
DSCR
20% down · 8.5% · 30yr
- Down + closing
- —
- Monthly P&I
- —
- Monthly cashflow
- —
- DSCR
- —
- Eligible?
- —
No personal income docs; deal must DSCR.
Hard money
10% down · 12.0% · 12mo
- Down + closing
- —
- Monthly P&I
- —
- Monthly cashflow
- —
- DSCR
- —
- Eligible?
- —
Short-term bridge; refi at stabilization.
Rent comps 8 comps
| Address | Beds | Baths | Sqft | Rent | $/sqft | DOM | Units | Dist |
|---|---|---|---|---|---|---|---|---|
| 6949 Alabama Ave Hammond, IN | 2.0 | 1.5 | 1200 | $1,795 | $1.50 | 5d | 1 | 0.56mi |
| 7633 Kentucky Ave Hammond, IN | 3.0 | 1.0 | 888 | $1,595 | $1.80 | 12d | 1 | 0.95mi |
| 3400 Stevens Ct Hammond, IN | 1.0 | 1.0 | 700 | $1,120 | $1.60 | 20d | 1 | 0.98mi |
| 6746 Forestdale Ave Hammond, IN | 3.0 | 1.0 | 900 | $1,860 | $2.07 | 0d | 1 | 0.98mi |
| 2723 E 165th St Unit 3 Hammond, IN | 2.0 | 1.0 | 800 | $1,350 | $1.69 | 8d | 1 | 1.15mi |
| 3605 Orchard Dr Hammond, IN | 1.0 | 1.0 | 736 | $950 | $1.29 | 6d | 1 | 1.16mi |
| 3607 Orchard Dr Hammond, IN | 1.0–2.0 | 1.0 | 839 | $1,539 | $1.83 | 0d | 6 | 1.23mi |
| 3611 167th St Hammond, IN | 1.0–2.0 | 1.0 | 695 | $1,450 | $2.09 | 0d | 1 | 1.47mi |
Listing history 6 events
-
2026-06-07statusdays on market $169,900 Pending 8 DOM
-
2026-06-04days on market $169,900 Active 6 DOM
-
2026-06-03days on market $169,900 Active 5 DOM
-
2026-06-02days on market $169,900 Active 4 DOM
-
2026-06-01days on market $169,900 Active 3 DOM
-
2026-05-31days on market $169,900 Active 2 DOM
ⓘ Source: listings_history table (triggers on properties + properties_extension) + one-shot
backfill from property_details.listing_events for pre-trigger history.
Tax reassessment forecast IN · Partial reset (capped growth)
- Current annual tax
- $1,435 · $120/mo
- Projected year-2 tax
- $1,440 · $120/mo
- Expected delta
- +$5/yr ($0/mo · 0.3%)
ⓘ Screening estimate from a state-policy table — verify with the county assessor before closing.
Climate risk First Street
- Flood 4/10 Moderate FEMA zone X · 22% chance over 30 yrs
- Wildfire 1/10 Low
- Heat 3/10 Moderate 7 d/yr ≥102°F today · 15 d/yr by 30 yrs out
- Wind 2/10 Low 0% chance of damaging wind over 30 yrs
- Air quality 4/10 Moderate 5 unhealthy d/yr today · 6 by 30 yrs out
Nearby sold comps map
Loading sold comps map…
Walkable amenities ~0.75 mi
Loading nearby amenities…
Taxation est. · year 1
- Rental income
- $18,161
- − Mortgage interest
- −$9,517
- − Property taxes
- −$1,435
- − Insurance
- −$850
- − Repairs & maintenance
- −$1,453
- − Management
- −$1,453
- − Depreciation
- −$4,943
- Taxable loss
- −$1,489
- Est. tax savings @ 24.0%
- +$357
- After-tax cash flow
- $1,729/yr
For passive investors: Depreciation is non-cash, so a rental often shows a tax loss while cash-flowing — sheltering income. Rental losses are passive: they offset passive income freely, and up to $25,000/yr can offset ordinary (W-2) income if you actively participate and your MAGI is under $100k (phasing out to $0 by $150k); unused losses carry forward. On sale, claimed depreciation is recaptured at up to 25%, and gains may owe capital-gains tax (a 1031 exchange can defer both). Figures are a year-1 estimate at your 24.0% rate — not tax advice; consult a CPA.
Schools (NCES district)
- District
- School City Of Hammond
- NCES district ID
- 1804320
- Math proficiency
- 8% ▼ -18.00%
- Reading proficiency
- 18% ▼ -15.00%
- Median HH income
- $39,970
- Composite
- 11.11/100
- National rank
- #9730
- State rank
- #289 of 301 in IN
Livability — Hammond
- Score
- 70/100
- State rank
- #143
- US rank
- #7343
Category grades
Schools grade is shown separately in the Schools card above.
Census & demographics
- Census place
- Hammond, IN
- County
- Lake County · 422,878 people
- City population
- 58,809
- Metro
- Chicago-Naperville-Elgin, IL-IN-WI
- Population (ZIP)
- 23,047
- Household income
- $59,688
- Rent vs Own
- Severe rent burden
- 692.0
Population outlook (Lake County) Hauer SSP2
- Today (2025)
- 484,026 people
- By 2030
- 478,091 · -1.2%
- By 2040
- 462,974 · -4.3%
- By 2050
- 449,894 · -7.1%
- By 2075
- 436,169 · -9.9%
- By 2100
- 426,607 · -11.9%
Race, ethnicity, and origin ACS 2023
- Neighborhood character
- Diverse neighborhood (Simpson 0.68)
- Race & ethnicity
- Hispanic / Latino 38% White 36% Black 21% Two or more races 12% Asian 2% Native American 1%
- Hispanic origin (detail)
- Mexican 29% Puerto Rican 7%
- Common ancestry
- Romanian 6% Italian 2% Lithuanian 1%
- Foreign-born
- 8% · Canada, China
- Languages at home
- 78% English-only · Spanish 19% Chinese 1%
Political lean MEDSL · Lake
- 2024 margin
- Lean D (+5.6) · D 52.1% · R 46.5% · Other 1.5%
- 2008→2024 swing
- -28.6pp toward R · 2008: 34.3pp · 2024: 5.6pp
- All cycles
- 2024: D+5.6 2020: D+15.1 2016: D+20.6 2012: D+31.0 2008: D+34.3
Not yet ingested
- Civics
- —
Market trends
- HPI YoY
- ▼ -67.70%
- Current HPI
- 293.4702
- Rent YoY
- —
- Metro
- Chicago-Naperville-Elgin, IL-IN-WI
- State GDP YoY
- ▲ 2.90%
- F500 in state
- 18
Industry mix (Fortune 500 HQ in IN)
| Industry | F500 HQs | Revenue |
|---|---|---|
| Industrial Machinery | 2 | $37B |
|
||
| Healthcare | 1 | $177B |
|
||
| Pharmaceuticals | 1 | $45B |
|
||
| Metals / Steel | 1 | $18B |
|
||
| Agriculture | 1 | $17B |
|
||
| Packaging | 1 | $12B |
|
||
Price history
+112.6% since first listed7 events — show timeline
- 2026-05-29 Listed $169,900 NIRA MLS as Distributed by MLS Grid
- 2023-04-24 Listing Removed — NIRA MLS as Distributed by MLS Grid
- 2023-03-29 Price Changed $144,900 NIRA MLS as Distributed by MLS Grid
- 2023-03-10 Listed $149,900 NIRA MLS as Distributed by MLS Grid
- 2017-08-23 Sold (MLS) $81,000 NIRA MLS as Distributed by MLS Grid
- 2017-06-27 Listed $81,000 NIRA MLS as Distributed by MLS Grid
- 2002-07-12 Listed $79,900 NIRA MLS as Distributed by MLS Grid
Property tax history
+6.4%/yrLatest (2024): $1,435 · -6.2% YoY. Source: county tax records.
Cash-flow waterfall
monthlySold comps — $/sqft
last 12 mo · ≤1 miLoading sold comps…