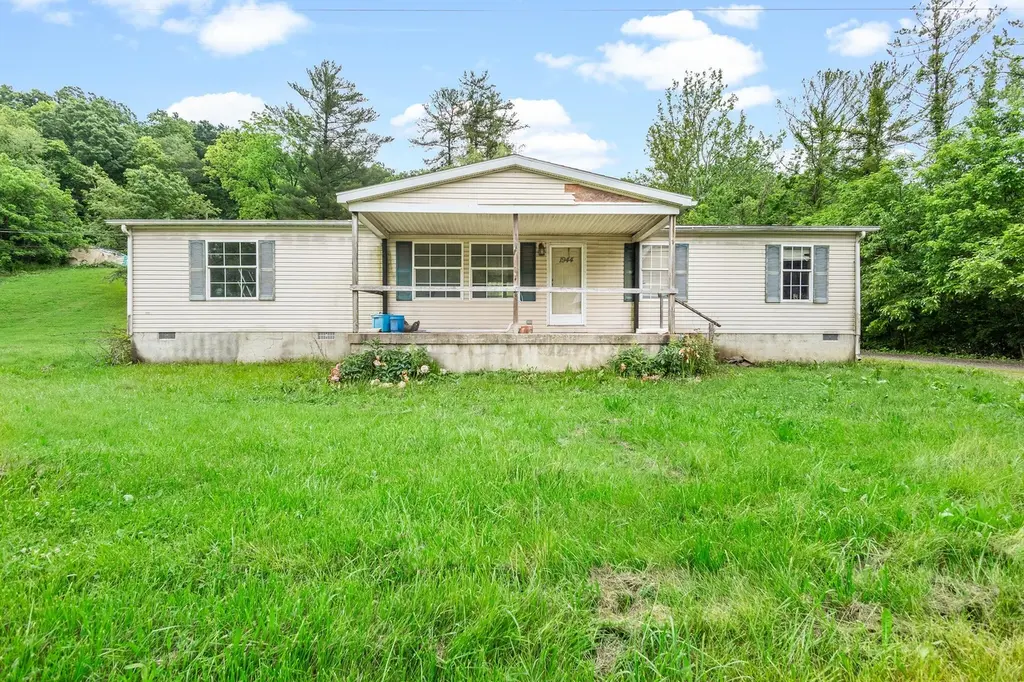
1944 Massieville Rd · Massieville, OH
Flood risk 9/10 · Severe
- FEMA flood zone
- AE
- Chance of flooding over 30 yrs
- 0.99%
- Est. flood insurance / yr
- $1,737 – $8,500
Fire risk 4/10 · Minor
- Est. fire insurance / yr
- $713 – $1,323
Heat risk 4/10 · Minor
- Hot days now (above 100°F)
- 7 days/yr
- Hot days in 30 yrs
- 19 days/yr
Wind risk 2/10 · Minimal
- Chance of severe wind over 30 yrs
- 1.0%
Air-quality risk 2/10 · Minimal
- Unhealthy air days now
- 1 days/yr
- Unhealthy air days in 30 yrs
- 2 days/yr
Risk factors via First Street. Map © Google.
Why this score? — see what drove the B- grade
The composite is a weighted blend of 9 inputs, each scored 0–100. Each bar is that input's sub-score; the figure is the points it added to the 100-point composite (weight × sub-score).
- Cash flow +30.0/30.0
- 1% rule +10.0/10.0
- DSCR +10.0/10.0
- ARV discount +7.5/15.0
- Schools +3.5/10.0
- Rent growth +2.5/5.0
- Livability +2.5/5.0
- Condition / age +2.5/5.0
- Appreciation +0.0/10.0
$82,990
🖨 Deal sheet (PDF) 📄 Offer letter ✓ Due diligence
Listing remarks
1944 Massieville Rd offers a great opportunity to own a spacious 4-bedroom, 2-bath ranch home on a beautiful 1-acre lot just outside of Chillicothe. With approximately 1,512 square feet of single-level living space, this property has solid potential for someone looking to add their own personal touches and build equity. The home features a functional layout with four entry-level bedrooms, two full bathrooms, and generously sized living areas. Outside, the property offers a peaceful country setting with mature landscaping including peonies, rose bushes, blackberry bushes, and a large weeping willow tree. Several improvement materials will remain with the property, including flooring, trim, p
Key facts
- 1 acre lot
- Built 2001
- Listed 19 days
Property features AI
Finance
- Other: Lot size: 1.0 acre
Exterior
- Utilities: Public water; Public sewer
- Home design: Single-family home; One story; Built in 2001; No shared/common walls
- Construction: Slab foundation
- Exterior features: Shed(s)
Interior
- Bedrooms: 4 main-level bedrooms
- Flooring: Laminate; Carpet; Vinyl
- Bathrooms: 2 full bathrooms
- Heating & cooling: Forced air heating (propane); Central air conditioning
- Interior features: Crawl space basement
Neighborhood map
What this means for you Summary
Snapshot
- This is a 2-bed/2.0-bath manufactured listed at $83k.
Deal economics
- At list price, monthly cash flow is $34 ($403/yr) — positive.
- The deal already cash-flows at list — no discount required.
- Meets the 1% rule at list price ($1k rent vs $83k).
- Recommended offer: $82k (1.5% below list) — sets the bar for market timing.
Location & tenants
- Location reads: area grade B — affects rentability + tenant quality, not the cash-flow math above.
- Chillicothe City (town): math 36% / reading 47% proficiency, ranked #535 of 656 in OH (top 82%) — families likely to look elsewhere, expect single-tenant / working-renter base with shorter leases.
- Market conditions: 179 active listings in the ZIP; 24 units permitted in Ross County in 2024 (0 in 5+ unit buildings).
Forward outlook
- Local home prices are declining (-3.0%/yr); year-one equity from $574 of loan paydown is wiped out by about $2k of value loss. Plan a longer hold.
- Ross County population projected at -12% by 2050 — secular population decline; favor cash flow + early exit over multi-decade hold.
Negotiation context
- It's been on market 19 days — a 2% lower offer ($82k) is reasonable based on typical stale-listing flexibility.
Risks & watch-outs
- Watch-outs: flood insurance adds $427/mo.
- Climate carrying-cost: in FEMA flood zone AE (mandatory federal flood insurance) — expect insurance premiums to compound above CPI over the hold.
Questions for the listing agent
- What's the actual annual flood-insurance premium (NFIP or private), and is the property in a SFHA with mandatory coverage?
- Is there a deadline driving the sale (1031 exchange, divorce, estate, relocation)? That informs how much negotiation room exists.
- What's the average days-on-market for RENTAL listings here right now (not sales)? A rising rental-DOM trend means longer vacancies and softer asking-rent achievability than the comps imply.
- What's the recent tenant-quality profile in this submarket — average credit score on applications, eviction rate, late-payment / NSF rate, and stable-employment percentage? A property-management company in the area should have these aggregated.
- How much new for-sale + rental construction is in the pipeline within 1–3 miles? Heavy new supply typically softens prices + rents 12–24 months out; constrained supply supports both.
Investment metrics
- 1% rule
- 1.58% ✓
- Cap rate
- 12.95%
- Cash-on-cash
- 23.76%
- DSCR
- 2.06
- GRM
- 5.3
CMA / ARV
No comps found within radius.
Projected returns pro-forma
-3.0% appreciation · 3.0% rent growth · sell at horizon
- IRR
- -13.1%
- Equity multiple
- 0.53×
- Total profit
- $-11,027
- Equity at exit
- $12,374
- IRR
- -3.6%
- Equity multiple
- 0.75×
- Total profit
- $-5,701
- Equity at exit
- $7,175
Cash invested: $23,237 (down + closing). Projections, not guarantees.
Landlord ↔ Tenant lean methodology
- Overall (STATE)
- 73 Landlord-Friendly
- State Ohio
- 73 Landlord-Friendly · R+6
- County
- — inherits STATE
- City
- — inherits STATE
ZIP-level market 45601
- Active inventory
- 179
- Price-to-rent
- 5.3×
Monthly cashflow live
- Estimated rent
- $1,309 medium interval (Pro) →
- Mortgage (P&I)
- −$435
- Tax from tax record
- −$105 /mo · $1,254/yr
- Insurance
- −$35
- Flood insurance flood zone
- −$427 /mo · $5,118/yr
- HOA
- −$0
- Vacancy / Maint / Mgmt
- −$275
- Net cashflow
- $34
Break-even live
Sensitivity live
| Price | -10% $81 | -5% $57 | +0% $34 | +5% $10 | +10% $-13 |
|---|---|---|---|---|---|
| Rent | -10% $-70 | -5% $-18 | +0% $34 | +5% $85 | +10% $137 |
| Rate | -1.0pp $75 | -0.5pp $55 | base $34 | +0.5pp $12 | +1.0pp $-10 |
UW: 25.0% down · 7.5% · 30yr · 1.5% tax · 5.0% vac · 8.0% maint · 8.0% mgmt
Financing live
Cash to close
- Down payment
- $20,748
- Closing costs
- $2,490
- Reserves months
- —
- Total cash needed
- —
Loan-product check · same deal, 3 products live
Conventional
25% down · 7.5% · 30yr
- Down + closing
- —
- Monthly P&I
- —
- Monthly cashflow
- —
- DSCR
- —
- Eligible?
- —
Personal DTI + credit; lowest rate.
DSCR
20% down · 8.5% · 30yr
- Down + closing
- —
- Monthly P&I
- —
- Monthly cashflow
- —
- DSCR
- —
- Eligible?
- —
No personal income docs; deal must DSCR.
Hard money
10% down · 12.0% · 12mo
- Down + closing
- —
- Monthly P&I
- —
- Monthly cashflow
- —
- DSCR
- —
- Eligible?
- —
Short-term bridge; refi at stabilization.
Listing history 16 events
-
2026-06-21days on market $82,990 Active 19 DOM
-
2026-06-18days on market $82,990 Active 17 DOM
-
2026-06-17pricedays on market $82,990 Active 16 DOM
-
2026-06-16days on market $85,000 Active 15 DOM
-
2026-06-15days on market $85,000 Active 14 DOM
-
2026-06-13days on market $85,000 Active 12 DOM
-
2026-06-12days on market $85,000 Active 11 DOM
-
2026-06-09days on market $85,000 Active 8 DOM
-
2026-06-08days on market $85,000 Active 7 DOM
-
2026-06-08days on market $85,000 Active 6 DOM
-
2026-06-07days on market $85,000 Active 5 DOM
-
2026-06-04days on market $85,000 Active 2 DOM
-
2026-06-01statusdays on market $85,000 Active 1 DOM
-
2026-05-31days on market $85,000 Coming Soon 3 DOM
-
2026-05-28historical $85,000
-
2014-05-01soldstatus $76,000
ⓘ Source: listings_history table (triggers on properties + properties_extension) + one-shot
backfill from property_details.listing_events for pre-trigger history.
Tax reassessment forecast OH · Partial reset (capped growth)
- Current annual tax
- $1,254 · $105/mo
- Projected year-2 tax
- $1,275 · $106/mo
- Expected delta
- +$20/yr (+$2/mo · 1.6%)
ⓘ Screening estimate from a state-policy table — verify with the county assessor before closing.
Climate risk First Street
- Flood 9/10 Extreme FEMA zone AE · 99% chance over 30 yrs
- Wildfire 4/10 Moderate
- Heat 4/10 Moderate 7 d/yr ≥100°F today · 19 d/yr by 30 yrs out
- Wind 2/10 Low 100% chance of damaging wind over 30 yrs
- Air quality 2/10 Low 1 unhealthy d/yr today · 2 by 30 yrs out
Nearby sold comps map
Loading sold comps map…
Walkable amenities ~0.75 mi
Loading nearby amenities…
Taxation est. · year 1
- Rental income
- $15,713
- − Mortgage interest
- −$4,649
- − Property taxes
- −$1,254
- − Insurance
- −$5,533
- − Repairs & maintenance
- −$1,257
- − Management
- −$1,257
- − Depreciation
- −$2,414
- Taxable loss
- −$652
- Est. tax savings @ 24.0%
- +$156
- After-tax cash flow
- $559/yr
For passive investors: Depreciation is non-cash, so a rental often shows a tax loss while cash-flowing — sheltering income. Rental losses are passive: they offset passive income freely, and up to $25,000/yr can offset ordinary (W-2) income if you actively participate and your MAGI is under $100k (phasing out to $0 by $150k); unused losses carry forward. On sale, claimed depreciation is recaptured at up to 25%, and gains may owe capital-gains tax (a 1031 exchange can defer both). Figures are a year-1 estimate at your 24.0% rate — not tax advice; consult a CPA.
Schools (NCES district)
- District
- Chillicothe City
- NCES district ID
- 3904374
- Math proficiency
- 36% ▼ -12.00%
- Reading proficiency
- 47% ▼ -11.00%
- Median HH income
- $37,990
- Composite
- 34.55/100
- National rank
- #5174
- State rank
- #535 of 656 in OH
Livability — Massieville
No livability data for this city. (Only ~50 U.S. cities are tracked.)
Census & demographics
- Census place
- Massieville, OH
- County
- Ross · 75,517 people
- Population (ZIP)
- 56,453
- Household income
- $57,430
- Rent vs Own
- Severe rent burden
- 10.6
Population outlook (Ross County) Hauer SSP2
- Today (2025)
- 75,482 people
- By 2030
- 74,035 · -1.9%
- By 2040
- 70,702 · -6.3%
- By 2050
- 66,706 · -11.6%
- By 2075
- 55,398 · -26.6%
- By 2100
- 42,197 · -44.1%
Race, ethnicity, and origin ACS 2023
- Neighborhood character
- Predominantly White (86%)
- Race & ethnicity
- White 86% Black 7% Two or more races 4% Hispanic / Latino 2%
- Common ancestry
- Slovak 2% Iranian 1% Italian 1%
- Foreign-born
- 1% · Canada
- Languages at home
- 98% English-only · Spanish 1%
Political lean MEDSL · Ross
- 2024 margin
- Solid R (+39.3) · D 29.9% · R 69.2%
- 2008→2024 swing
- -32.1pp toward R · 2008: -7.2pp · 2024: -39.3pp
- All cycles
- 2024: R+39.3 2020: R+35.2 2016: R+27.4 2012: R+2.4 2008: R+7.2
Not yet ingested
- Civics
- —
Market trends
- HPI YoY
- ▼ -231.40%
- Current HPI
- 205.7051
- Rent YoY
- —
- Metro
- —
- State GDP YoY
- ▲ 1.98%
- F500 in state
- 48
Industry mix (Fortune 500 HQ in OH)
| Industry | F500 HQs | Revenue |
|---|---|---|
| Insurance | 3 | $145B |
|
||
| Industrial Machinery | 3 | $49B |
|
||
| Financial Services | 3 | $24B |
|
||
| Consumer Goods | 2 | $93B |
|
||
| Aerospace / Defense | 2 | $47B |
|
||
| Utilities | 2 | $33B |
|
||
Price history
+11.8% since first listed2 events — show timeline
- 2026-05-28 Coming Soon $85,000 CBRMLS
- 2014-05-01 Sold (Public Records) $76,000 Public Records
Property tax history
-4.0%/yrLatest (2025): $1,254 · -15.0% YoY. Source: county tax records.
Cash-flow waterfall
monthlySold comps — $/sqft
last 12 mo · ≤1 miLoading sold comps…