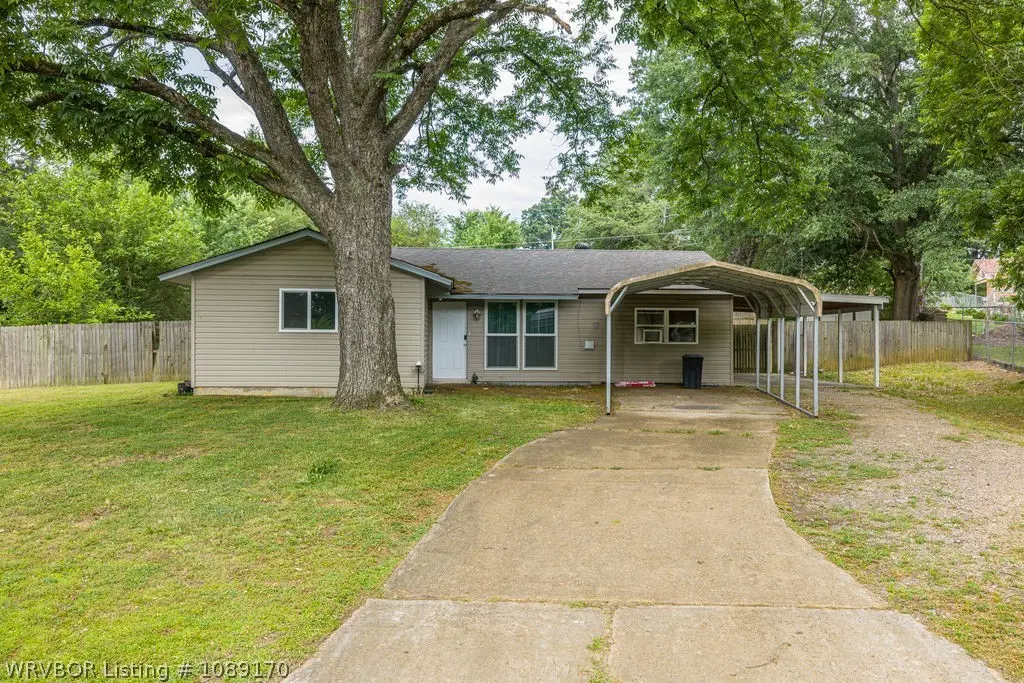
1114 Crescent Dr · Paris, AR
Flood risk 1/10 · Minimal
- FEMA flood zone
- X (unshaded)
- Chance of flooding over 30 yrs
- 0.0%
- Est. flood insurance / yr
- $507 – $1,088
Fire risk 5/10 · Moderate
- Est. fire insurance / yr
- $1,499 – $2,785
Heat risk 6/10 · Moderate
- Hot days now (above 111°F)
- 7 days/yr
- Hot days in 30 yrs
- 20 days/yr
Wind risk 2/10 · Minimal
- Chance of severe wind over 30 yrs
- 2.0%
Air-quality risk 1/10 · Minimal
- Unhealthy air days now
- 0 days/yr
- Unhealthy air days in 30 yrs
- 0 days/yr
Risk factors via First Street. Map © Google.
Why this score? — see what drove the F grade
The composite is a weighted blend of 9 inputs, each scored 0–100. Each bar is that input's sub-score; the figure is the points it added to the 100-point composite (weight × sub-score).
- Cash flow +15.0/30.0
- DSCR +4.6/10.0
- Livability +3.5/5.0
- Schools +3.2/10.0
- 1% rule +2.8/10.0
- Rent growth +2.5/5.0
- Condition / age +2.5/5.0
- ARV discount +0.0/15.0
- Appreciation +0.0/10.0
$145,000
🖨 Deal sheet 📄 Offer letter ✓ Due diligence
Listing remarks
Welcome to 1114 Crescent Drive in the scenic community of Paris, Arkansas! This cozy four-bedroom home received major improvements in 2021 including a new roof, HVAC system, windows, and flooring. In 2025, the owners continued to enhance the space with fresh paint, a stylish new kitchen backsplash, and a much-needed bathroom remodel including a new vanity, lighting, and shower tile. The home's location in the Grandview neighborhood is just a few minutes from the historic Town Square and Commercial District where you'll find a variety of local shops such as Stirling Soap Company and Stirling Roastery. Recreation and relaxation are never far away with opportunities for hiking, biking, or
Key facts
- New flooring
- Bathroom remodel
- Hvac system
Tags
Property features AI
Finance
- HOA & community: Subdivision: Grandview; Community features include golf
Exterior
- Parking: Attached carport; Gravel and concrete surfaces; 2 covered spaces
- Security: Security system; Smoke detectors
- Utilities: Public water; Public sewer; Electricity available; Natural gas available; Cable available; Phone available
- Home design: Single-family residence; One story
- Construction: Vinyl siding; Slab foundation
- Exterior features: Back yard with privacy wood fence; Outbuilding; Shingle roof; City lot; Paved public road access
Interior
- Kitchen: Dishwasher; Disposal; Microwave; Range; Refrigerator; Gas water heater
- Flooring: Carpet; Ceramic tile; Vinyl
- Bathrooms: 1 full bathroom
- Heating & cooling: Central heating (natural gas); Central air; Ceiling fan(s)
- Interior features: Ceiling fans; Eat-in kitchen; Double-pane windows with blinds; No fireplace; Six total rooms
- Laundry & utility: Washer hookup; Electric dryer hookup
Neighborhood map
What this means for you Summary
Snapshot
- This is a 4-bed/1.0-bath single-family listed at $145k.
Deal economics
- At list price, monthly cash flow is $46 ($548/yr) — positive.
- The deal already cash-flows at list — no discount required.
- To meet the 1% rule (rent ≥ 1% of price), the offer needs to be $113k (22.0% below list).
- Recommended offer: $113k (22.0% below list) — sets the bar for 1% rule.
Location & tenants
- Location reads 69/100 on livability (#68 in AR) — a middle-class / working-renter tenant base. Strengths: cost of living A+, housing A+, health & safety A+; Watch: crime F, amenities F, commute F.
- Paris School District (town): math 41% / reading 37% proficiency, ranked #83 of 238 in AR (top 35%) — families likely to look elsewhere, expect single-tenant / working-renter base with shorter leases.
- Zoned schools: Paris Elementary School (math 57% / reading 27%, grade F, #173 of 454 statewide, top 43%, 431 students, 100% FRL); Paris Middle School (math 39% / reading 43%, grade F, #83 of 201 statewide, top 44%, 317 students, 100% FRL); Paris High School (math 32% / reading 37%, grade F, #92 of 292 statewide, top 37%, 335 students, 100% FRL) — zoned schools average 100% FRL vs 54% district-wide (46 pts higher); higher-poverty schools than district average — tighter screening recommended.
- Market conditions: 78 active listings in the ZIP; 11 units permitted in Logan County in 2024 (0 in 5+ unit buildings).
Forward outlook
- Local home prices are declining (-3.0%/yr); year-one equity from $1k of loan paydown is wiped out by about $4k of value loss. Plan a longer hold.
- Logan County population projected at -13% by 2050 — secular population decline; favor cash flow + early exit over multi-decade hold.
Negotiation context
- It's been on market 31 days — a 3% lower offer ($141k) is reasonable based on typical stale-listing flexibility.
- 6 sale attempts since 8y ago with the ask held roughly flat each time — persistent listings suggest the price (not the market) is what's stuck; bring a comps-based counter.
Risks & watch-outs
- Climate carrying-cost: moderate wildfire risk; extreme-heat days projected 7→20/yr by 2055 (HVAC capex compounding) — expect insurance premiums to compound above CPI over the hold.
Questions for the listing agent
- It's been on market 31 days. Have you received any prior offers? Is the seller open to a 22% concession, seller financing, or rate buy-down credit?
- Built in 1979 — when were the roof, HVAC, electrical panel, plumbing, and water heater last replaced?
- Is there a deadline driving the sale (1031 exchange, divorce, estate, relocation)? That informs how much negotiation room exists.
- Schools are D-rated, which usually means shorter tenancies and higher turnover. Who's the typical renter profile here, and what's been the actual vacancy rate?
- Crime grade is F in this area — have there been break-ins, vandalism, or insurance claims at this property in the last 3 years? What carrier currently insures it and at what premium?
- The area grade is low — what's the realistic commute time and amenity access for the typical tenant pool here? Any planned neighborhood developments (good or bad) we should know about?
- What's the average days-on-market for RENTAL listings here right now (not sales)? A rising rental-DOM trend means longer vacancies and softer asking-rent achievability than the comps imply.
- What's the recent tenant-quality profile in this submarket — average credit score on applications, eviction rate, late-payment / NSF rate, and stable-employment percentage? A property-management company in the area should have these aggregated.
- How much new for-sale + rental construction is in the pipeline within 1–3 miles? Heavy new supply typically softens prices + rents 12–24 months out; constrained supply supports both.
Investment metrics
- 1% rule
- 0.78% ✗
- Cap rate
- 6.67%
- Cash-on-cash
- 1.35%
- DSCR
- 1.06
- GRM
- 10.7
CMA / ARV
- ARV (on-the-fly)
- $123,420
- Comps found
- 6
Show comp detail 6 sales within ~0.75 mi
| Address | Dist | Beds/Ba | Sqft | Sold | Price | $/sf | Match |
|---|---|---|---|---|---|---|---|
| 1205 Crescent Dr | 0.13mi | 3/1.5 (-1) | 1,161 (-4%) | 6mo | $30,000 | $26 | 75 |
| 804 Wahl St | 0.13mi | 3/2.0 (-1) | 1,250 (+3%) | 15mo | $157,000 | $126 | 67 |
| 203 E Brown St | 0.30mi | 3/1.0 (-1) | 1,125 (-7%) | 13mo | $135,000 | $120 | 58 |
| 618 Academy St | 0.41mi | 3/2.0 (-1) | 1,240 (+2%) | 20mo | $105,000 | $85 | 51 |
| 1116 Academy St | 0.53mi | 3/2.0 (-1) | 1,274 (+5%) | 18mo | $30,000 | $24 | 42 |
| 1104 Fuller St | 0.45mi | 3/2.0 (-1) | 1,372 (+13%) | 11mo | $140,000 | $102 | 38 |
Match score weights: distance 35% · size 25% · config 20% · recency 20%. Top-matched comps best support the ARV.
Projected returns pro-forma
-3.0% appreciation · 3.0% rent growth · sell at horizon
- IRR
- -14.2%
- Equity multiple
- 0.49×
- Total profit
- $-20,666
- Equity at exit
- $21,620
- IRR
- -5.5%
- Equity multiple
- 0.64×
- Total profit
- $-14,565
- Equity at exit
- $12,537
Cash invested: $40,600 (down + closing). Projections, not guarantees.
Landlord ↔ Tenant lean methodology
- Overall (STATE)
- 92 Strongly Landlord-Friendly
- State Arkansas
- 92 Strongly Landlord-Friendly · R+14
- County
- — inherits STATE
- City
- — inherits STATE
ZIP-level market 72855
- Home prices YoY
- -8.3%
- Active inventory
- 78
- Price-to-rent
- 10.7×
Monthly cashflow live
- Estimated rent
- $1,132 medium interval (Pro) →
- Mortgage (P&I)
- −$760
- Tax from tax record
- −$28 /mo · $330/yr
- Insurance
- −$60
- HOA
- −$0
- Vacancy / Maint / Mgmt
- −$238
- Net cashflow
- $46
Break-even live
UW: 25.0% down · 7.5% · 30yr · 1.5% tax · 5.0% vac · 8.0% maint · 8.0% mgmt
Financing live
Cash to close
- Down payment
- $36,250
- Closing costs
- $4,350
- Reserves months
- —
- Total cash needed
- —
Loan-product check · same deal, 3 products live
Conventional
25% down · 7.5% · 30yr
- Down + closing
- —
- Monthly P&I
- —
- Monthly cashflow
- —
- DSCR
- —
- Eligible?
- —
Personal DTI + credit; lowest rate.
DSCR
20% down · 8.5% · 30yr
- Down + closing
- —
- Monthly P&I
- —
- Monthly cashflow
- —
- DSCR
- —
- Eligible?
- —
No personal income docs; deal must DSCR.
Hard money
10% down · 12.0% · 12mo
- Down + closing
- —
- Monthly P&I
- —
- Monthly cashflow
- —
- DSCR
- —
- Eligible?
- —
Short-term bridge; refi at stabilization.
Listing history 34 events
-
2026-06-19days on market $145,000 Active 31 DOM
-
2026-06-18days on market $145,000 Active 30 DOM
-
2026-06-17days on market $145,000 Active 29 DOM
-
2026-06-16days on market $145,000 Active 28 DOM
-
2026-06-15days on market $145,000 Active 27 DOM
-
2026-06-14days on market $145,000 Active 25 DOM
-
2026-06-12days on market $145,000 Active 24 DOM
-
2026-06-09days on market $145,000 Active 21 DOM
-
2026-06-08days on market $145,000 Active 20 DOM
-
2026-06-07days on market $145,000 Active 19 DOM
-
2026-06-07days on market $145,000 Active 18 DOM
-
2026-06-04days on market $145,000 Active 15 DOM
-
2026-06-02days on market $145,000 Active 14 DOM
-
2026-06-01days on market $145,000 Active 13 DOM
-
2026-05-31days on market $145,000 Active 12 DOM
-
2026-05-31days on market $145,000 Active 11 DOM
-
2026-05-19$145,000 Active
-
2025-12-12status Pending
-
2025-12-02$139,000 Active
-
2025-04-10$139,900 Active
-
2024-02-01soldstatus $130,000 Closed
-
2024-02-01soldstatus $130,000
-
2023-12-12status Pending
-
2023-12-01$139,000 Active
-
2022-05-27soldstatus $105,000
-
2022-05-27soldstatus $105,000
-
2021-09-16$102,900
-
2018-08-09soldstatus $67,580
-
2018-08-09soldstatus $67,000
-
2018-08-01$67,580
-
2013-07-26soldstatus $38,000
-
2010-05-24soldstatus $55,000
-
2007-12-14soldstatus $31,000
-
2002-10-21soldstatus $27,000
ⓘ Source: listings_history table (triggers on properties + properties_extension) + one-shot
backfill from property_details.listing_events for pre-trigger history.
Tax reassessment forecast AR · Resets to sale price
- Current annual tax
- $330 · $28/mo
- Projected year-2 tax
- $928 · $77/mo
- Expected delta
- +$598/yr (+$50/mo · 181.0%)
ⓘ Screening estimate from a state-policy table — verify with the county assessor before closing.
Climate risk First Street
- Flood 1/10 Low FEMA zone X (unshaded) · 0% chance over 30 yrs
- Wildfire 5/10 Major
- Heat 6/10 Major 7 d/yr ≥111°F today · 20 d/yr by 30 yrs out
- Wind 2/10 Low 2% chance of damaging wind over 30 yrs
- Air quality 1/10 Low 0 unhealthy d/yr today · 0 by 30 yrs out
Nearby sold comps map
Loading sold comps map…
Walkable amenities ~0.75 mi
Loading nearby amenities…
Taxation est. · year 1
- Rental income
- $13,580
- − Mortgage interest
- −$8,122
- − Property taxes
- −$330
- − Insurance
- −$725
- − Repairs & maintenance
- −$1,086
- − Management
- −$1,086
- − Depreciation
- −$4,218
- Taxable loss
- −$1,989
- Est. tax savings @ 24.0%
- +$477
- After-tax cash flow
- $1,025/yr
For passive investors: Depreciation is non-cash, so a rental often shows a tax loss while cash-flowing — sheltering income. Rental losses are passive: they offset passive income freely, and up to $25,000/yr can offset ordinary (W-2) income if you actively participate and your MAGI is under $100k (phasing out to $0 by $150k); unused losses carry forward. On sale, claimed depreciation is recaptured at up to 25%, and gains may owe capital-gains tax (a 1031 exchange can defer both). Figures are a year-1 estimate at your 24.0% rate — not tax advice; consult a CPA.
Schools (NCES district)
- District
- Paris School District
- NCES district ID
- 0511130
- Math proficiency
- 41% ▼ -9.00%
- Reading proficiency
- 37% ▼ -6.00%
- Median HH income
- $34,950
- Composite
- 32.25/100
- National rank
- #5763
- State rank
- #83 of 238 in AR
Livability — Paris
- Score
- 69/100
- State rank
- #68
- US rank
- #8544
Category grades
Schools grade is shown separately in the Schools card above.
Census & demographics
- Census place
- Paris, AR
- Population (ZIP)
- 6,462
Population outlook (Logan County) Hauer SSP2
- Today (2025)
- 21,046 people
- By 2030
- 20,537 · -2.4%
- By 2040
- 19,443 · -7.6%
- By 2050
- 18,220 · -13.4%
- By 2075
- 16,164 · -23.2%
- By 2100
- 14,858 · -29.4%
Race, ethnicity, and origin ACS 2023
- Neighborhood character
- Predominantly White (87%)
- Race & ethnicity
- White 87% Two or more races 8% Asian 3% Hispanic / Latino 2%
- Common ancestry
- Italian 1% Serbian 1% Lithuanian 1%
- Foreign-born
- 2% · China, Vietnam
- Languages at home
- 95% English-only · Spanish 3% Other Asian/Pacific 1% Chinese 1%
Political lean MEDSL · Logan
- 2024 margin
- Solid R (+62.2) · D 17.8% · R 80.0% · Other 2.1%
- 2008→2024 swing
- -23.5pp toward R · 2008: -38.8pp · 2024: -62.2pp
- All cycles
- 2024: R+62.2 2020: R+59.5 2016: R+51.4 2012: R+41.9 2008: R+38.8
Not yet ingested
- Civics
- —
Market trends
- HPI YoY
- ▼ -15.40%
- Current HPI
- 170.513
- Rent YoY
- —
- Metro
- —
- State GDP YoY
- ▲ 3.80%
- F500 in state
- 10
Industry mix (Fortune 500 HQ in AR)
| Industry | F500 HQs | Revenue |
|---|---|---|
| Retail | 1 | $681B |
|
||
| Food / Agriculture | 1 | $53B |
|
||
| Retail / Energy | 1 | $22B |
|
||
| Transportation / Logistics | 1 | $12B |
|
||
| Energy | 1 | $4B |
|
||
Price history
+437.0% since first listed18 events — show timeline
- 2026-05-19 Listed $145,000 WRVBOR
- 2025-12-12 Pending — WRVBOR
- 2025-12-02 Listed $139,000 WRVBOR
- 2025-04-10 Listed $139,900 WRVBOR
- 2024-02-01 Sold (Public Records) $130,000 Public Records
- 2024-02-01 Sold (MLS) $130,000 WRVBOR
- 2023-12-12 Pending — WRVBOR
- 2023-12-01 Listed $139,000 WRVBOR
- 2022-05-27 Sold (Public Records) $105,000 Public Records
- 2022-05-27 Sold (MLS) $105,000 NWARMLS
- 2021-09-16 Listed $102,900 NWARMLS
- 2018-08-09 Sold (Public Records) $67,000 Public Records
- 2018-08-09 Sold (MLS) $67,580 WRVBOR
- 2018-08-01 Listed $67,580 WRVBOR
- 2013-07-26 Sold (Public Records) $38,000 Public Records
- 2010-05-24 Sold (Public Records) $55,000 Public Records
- 2007-12-14 Sold (Public Records) $31,000 Public Records
- 2002-10-21 Sold (Public Records) $27,000 Public Records
Property tax history
+5.8%/yrLatest (2025): $330 · +240.2% YoY. Source: county tax records.
Cash-flow waterfall
monthlySold comps — $/sqft
last 12 mo · ≤1 miLoading sold comps…