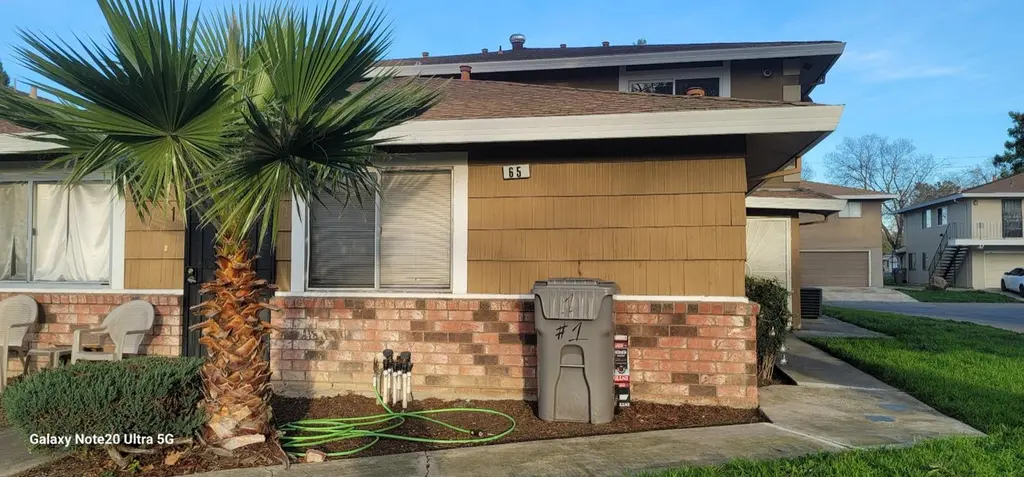
65 La Fresa Ct #2 · Sacramento, CA
Flood risk 1/10 · Minimal
- FEMA flood zone
- X (shaded)
- Chance of flooding over 30 yrs
- 0.0%
- Est. flood insurance / yr
- $507 – $1,088
Fire risk 3/10 · Minor
- Est. fire insurance / yr
- $659 – $1,223
Heat risk 7/10 · Major
- Hot days now (above 102°F)
- 7 days/yr
- Hot days in 30 yrs
- 15 days/yr
Wind risk 1/10 · Minimal
- Chance of severe wind over 30 yrs
- —
Air-quality risk 10/10 · Severe
- Unhealthy air days now
- 25 days/yr
- Unhealthy air days in 30 yrs
- 26 days/yr
Risk factors via First Street. Map © Google.
Why this score? — see what drove the D+ grade
The composite is a weighted blend of 9 inputs, each scored 0–100. Each bar is that input's sub-score; the figure is the points it added to the 100-point composite (weight × sub-score).
- Cash flow +15.5/30.0
- ARV discount +10.1/15.0
- 1% rule +6.9/10.0
- DSCR +4.8/10.0
- Livability +3.6/5.0
- Schools +3.5/10.0
- Rent growth +2.5/5.0
- Condition / age +2.5/5.0
- Appreciation +0.0/10.0
$155,000
🖨 Deal sheet 📄 Offer letter ✓ Due diligence
Listing remarks
Great property for both as primary residence or as investment property. 2 bedrooms, 1-bath. Priced competitively for quick sale. Easy access to major freeways and shopping centers. Only about 15 minutes from downtown Sacramento. Property is listed in as is condition.
Key facts
- $326 HOA
- Garage
- Community pool
Tags
Neighborhood map
What this means for you Summary
Snapshot
- This is a 2-bed/1.0-bath condo listed at $155k.
Deal economics
- At list price, monthly cash flow is $64 ($766/yr) — positive.
- The deal already cash-flows at list — no discount required.
- Meets the 1% rule at list price ($2k rent vs $155k).
- Recommended offer: $153k (1.5% below list) — sets the bar for market timing.
- Cap rate 6.8% vs local median 3.0% in Sacramento — top-decile yield for the area; either an underpriced asset or a hidden risk that comps aren't pricing in. Stress-test before assuming the spread holds.
Location & tenants
- Location reads 71/100 on livability (#218 in CA) — a middle-class / working-renter tenant base. Strengths: amenities A+, commute A+, housing A; Watch: schools D+, crime F, cost of living F.
- Sacramento City Unified (urban): math 32% / reading 43% proficiency, ranked #804 of 1,400 in CA (top 57%) — families likely to look elsewhere, expect single-tenant / working-renter base with shorter leases; 63% free/reduced lunch — lower-income household profile, screen leases tightly.
- Market conditions: Rents flat; 181 active listings in the ZIP; 34 comparable units currently listed for rent nearby; rentals at typical pace (median 22d on market — plan ~3-4 weeks tenant-placement turnaround); 6,825 units permitted in Sacramento County in 2024 (1,752 in 5+ unit buildings).
- This rent runs 33% of the median local income ($67k/yr) — at the standard rent-burdened threshold; future hikes will face affordability resistance.
Forward outlook
- Local home prices are declining (-3.0%/yr); year-one equity from $1k of loan paydown is wiped out by about $5k of value loss. Plan a longer hold.
- Sacramento County population projected at +17% by 2050 — long-run rental-demand tailwind backs the buy-and-hold thesis.
Negotiation context
- It's been on market 27 days — a 2% lower offer ($153k) is reasonable based on typical stale-listing flexibility.
- Current owner paid $118k; 31% above their basis — modest negotiation headroom, anchor on the comps not their cost.
Risks & watch-outs
- Climate carrying-cost: extreme-heat days projected 7→15/yr by 2055 (HVAC capex compounding) — expect insurance premiums to compound above CPI over the hold.
Questions for the listing agent
- Built in 1970 — when were the roof, HVAC, electrical panel, plumbing, and water heater last replaced?
- What does the HOA fee cover, when was the last increase, and are there any pending special assessments or reserve-fund shortfalls?
- Any open or pending special assessments — roof, HVAC, plumbing, elevator, façade? What's the per-unit balance and payoff schedule, and is the seller paying it off at close or rolling it to the buyer?
- Is there a deadline driving the sale (1031 exchange, divorce, estate, relocation)? That informs how much negotiation room exists.
- Schools are D-rated, which usually means shorter tenancies and higher turnover. Who's the typical renter profile here, and what's been the actual vacancy rate?
- Crime grade is F in this area — have there been break-ins, vandalism, or insurance claims at this property in the last 3 years? What carrier currently insures it and at what premium?
- The area grade is low — what's the realistic commute time and amenity access for the typical tenant pool here? Any planned neighborhood developments (good or bad) we should know about?
- What's the average days-on-market for RENTAL listings here right now (not sales)? A rising rental-DOM trend means longer vacancies and softer asking-rent achievability than the comps imply.
- What's the recent tenant-quality profile in this submarket — average credit score on applications, eviction rate, late-payment / NSF rate, and stable-employment percentage? A property-management company in the area should have these aggregated.
- How much new apartment / multifamily construction is in the pipeline within 1–3 miles? Heavy new supply (>2% of stock underway) typically softens rents 12–24 months out; light construction supports rent growth.
Investment metrics
- 1% rule
- 1.19% ✓
- Cap rate
- 6.79%
- Cash-on-cash
- 1.76%
- DSCR
- 1.08
- GRM
- 7.0
CMA / ARV
- ARV (median comp)
- $164,651
- List price
- $155,000
- Delta
- -5.86%
- Verdict
- FAIR
- Comps
- 20 within 1.0 mi
Projected returns pro-forma
-3.0% appreciation · 0.02% rent growth · sell at horizon
- IRR
- -17.8%
- Equity multiple
- 0.40×
- Total profit
- $-26,210
- Equity at exit
- $23,111
- IRR
- -19.7%
- Equity multiple
- 0.14×
- Total profit
- $-37,482
- Equity at exit
- $13,402
Cash invested: $43,400 (down + closing). Projections, not guarantees.
Landlord ↔ Tenant lean methodology
- Overall (STATE)
- 18 Strongly Tenant-Friendly
- State California
- 18 Strongly Tenant-Friendly · D+13
- County
- — inherits STATE
- City
- — inherits STATE
ZIP-level market 95823
- Rents YoY
- 0.0%
- Active inventory
- 181
- Price-to-rent
- 7.0×
Monthly cashflow live
- Estimated rent
- $1,849 high interval (Pro) →
- Mortgage (P&I)
- −$813
- Tax est. 1.5%
- −$194 /mo · $2,325/yr
- Insurance
- −$65
- HOA
- −$326
- Vacancy / Maint / Mgmt
- −$388
- Net cashflow
- $64
Break-even live
UW: 25.0% down · 7.5% · 30yr · 1.5% tax · 5.0% vac · 8.0% maint · 8.0% mgmt
Financing live
Cash to close
- Down payment
- $38,750
- Closing costs
- $4,650
- Reserves months
- —
- Total cash needed
- —
Loan-product check · same deal, 3 products live
Conventional
25% down · 7.5% · 30yr
- Down + closing
- —
- Monthly P&I
- —
- Monthly cashflow
- —
- DSCR
- —
- Eligible?
- —
Personal DTI + credit; lowest rate.
DSCR
20% down · 8.5% · 30yr
- Down + closing
- —
- Monthly P&I
- —
- Monthly cashflow
- —
- DSCR
- —
- Eligible?
- —
No personal income docs; deal must DSCR.
Hard money
10% down · 12.0% · 12mo
- Down + closing
- —
- Monthly P&I
- —
- Monthly cashflow
- —
- DSCR
- —
- Eligible?
- —
Short-term bridge; refi at stabilization.
Rent comps 34 comps
| Address | Beds | Baths | Sqft | Rent | $/sqft | DOM | Units | Dist |
|---|---|---|---|---|---|---|---|---|
| 7408 Franklin Blvd #2 Sacramento, CA | 2.0 | 1.0 | 840 | $1,300 | $1.55 | 21d | 1 | 0.01mi |
| 74 La Fresa Ct #3 Sacramento, CA | 2.0 | 1.0 | 840 | $1,950 | $2.32 | 43d | 1 | 0.06mi |
| 4407 Bouts Pkwy Sacramento, CA | 3.0 | 1.0 | 1024 | $1,950 | $1.90 | 43d | 1 | 0.08mi |
| 4400 Shining Star Dr Sacramento, CA | 1.0–4.0 | 1.0–2.0 | 1225 | $2,254 | $1.84 | 43d | 1 | 0.14mi |
| 7236 East Pkwy Sacramento, CA | 2.0 | 1.0–1.5 | 776 | $1,645 | $2.12 | 3d | 1 | 0.49mi |
| 7238 East Pkwy Apt B5 Sacramento, CA | 2.0 | 1.5 | 1020 | $1,645 | $1.61 | 7d | 1 | 0.49mi |
| 7605 Franklin Blvd Sacramento, CA | 2.0 | 1.0 | 824 | $1,645 | $2.00 | 2d | 1 | 0.55mi |
| 7051 Bowling Dr Sacramento, CA | 1.0–2.0 | 1.0–1.5 | 716 | $1,445 | $2.02 | 2d | 5 | 0.69mi |
| 7726 Laurie Way Sacramento, CA | 3.0 | 1.0 | 1069 | $2,075 | $1.94 | 7d | 1 | 1.01mi |
| 7474 La Mancha Way Sacramento, CA | 1.0 | 1.0 | 676 | $1,550 | $2.29 | 7d | 2 | 1.07mi |
| 4197 Cuny Ave Unit 3 Sacramento, CA | 2.0 | 1.0 | 1051 | $2,000 | $1.90 | 17d | 1 | 1.10mi |
| 7400 Loma Verde Way Unit 1 Sacramento, CA | 2.0 | 1.0 | 860 | $2,100 | $2.44 | 3d | 1 | 1.14mi |
| 2777 Meadowview Rd Unit 2781 Sacramento, CA | 2.0 | 2.0 | 800 | $1,295 | $1.62 | 21d | 1 | 1.19mi |
| 7252 Florin Mall Dr Unit 7252 Sacramento, CA | 2.0 | 2.0 | 900 | $1,725 | $1.92 | 43d | 1 | 1.21mi |
| 3912 49th Ave Unit 15 Sacramento, CA | 1.0 | 1.0 | 700 | $1,495 | $2.14 | 23d | 1 | 1.21mi |
| 3912 49th Ave Unit 16 Sacramento, CA | 1.0 | 1.0 | 700 | $1,700 | $2.43 | 43d | 1 | 1.21mi |
| 3912 49th Ave Unit 17 Sacramento, CA | 1.0 | 1.0 | 700 | $1,600 | $2.29 | 43d | 1 | 1.22mi |
| 3912 49th Ave Apt 10 Sacramento, CA | 2.0 | 1.0 | 811 | $1,895 | $2.34 | 43d | 1 | 1.22mi |
| 3912 49th Ave Unit 9 Sacramento, CA | 2.0 | 1.0 | 811 | $1,795 | $2.21 | 43d | 1 | 1.22mi |
| 7283 Florin Mall Dr #14 Sacramento, CA | 2.0 | 2.0 | 902 | $1,675 | $1.86 | 43d | 1 | 1.24mi |
| 3903 49th Ave Sacramento, CA | 1.0 | 1.0 | 585 | $1,445 | $2.47 | 7d | 1 | 1.26mi |
| 7905 Farnell Way Unit 7905 Sacramento, CA | 1.0 | 1.0 | 559 | $1,800 | $3.22 | 23d | 1 | 1.27mi |
| 5152 Mack Rd Sacramento, CA | 2.0 | 2.0 | 801 | $1,731 | $2.16 | 17d | 1 | 1.36mi |
| 5152 Mack Rd Sacramento, CA | 1.0 | 1.0 | 597 | $1,525 | $2.55 | 23d | 1 | 1.36mi |
| 5152 Mack Rd Sacramento, CA | 2.0 | 2.0 | 801 | $1,891 | $2.36 | 20d | 1 | 1.36mi |
| 5152 Mack Rd Sacramento, CA | 1.0 | 1.0 | 597 | $1,603 | $2.69 | 4d | 1 | 1.36mi |
| 6855 Carnation Ave Unit 6855 Sacramento, CA | 2.0 | 2.0 | 1100 | $2,025 | $1.84 | 3d | 1 | 1.36mi |
| 6611 50th St Sacramento, CA | 2.0 | 1.0 | 873 | $1,950 | $2.23 | 7d | 1 | 1.38mi |
| 6500 47th St Sacramento, CA | 1.0–2.0 | 1.0–2.0 | 715 | $1,650 | $2.31 | 43d | 7 | 1.39mi |
| 4911 50th Ave Unit 11 Sacramento, CA | 2.0 | 2.0 | 875 | $1,660 | $1.90 | 23d | 1 | 1.41mi |
| 5545 Sky Pkwy Sacramento, CA | 1.0–2.0 | 1.0 | 716 | $1,630 | $2.28 | 17d | 7 | 1.43mi |
| 26 Nedra Ct Sacramento, CA | 2.0 | 1.0 | 980 | $1,650 | $1.68 | 43d | 1 | 1.45mi |
| 26 Nedra Ct Unit A1 Sacramento, CA | 2.0 | 1.0 | 980 | $1,650 | $1.68 | 20d | 1 | 1.45mi |
| 7638 24th St Sacramento, CA | 2.0 | 1.0 | 976 | $1,900 | $1.95 | 43d | 1 | 1.48mi |
HOA detail condo
- Monthly dues
- $326 · $3,912/yr
- Assessments
- None detected in remarks — confirm with the listing agent.
Listing history 8 events
-
2026-06-18days on market $155,000 Active 27 DOM
-
2026-06-17days on market $155,000 Active 26 DOM
-
2026-06-16days on market $155,000 Active 25 DOM
-
2026-06-15days on market $155,000 Active 24 DOM
-
2026-06-13days on market $155,000 Active 22 DOM
-
2026-06-13days on market $155,000 Active 21 DOM
-
2026-06-10status $155,000 Active 18 DOM
-
2005-03-30soldstatus $118,500
ⓘ Source: listings_history table (triggers on properties + properties_extension) + one-shot
backfill from property_details.listing_events for pre-trigger history.
Climate risk First Street
- Flood 1/10 Low FEMA zone X (shaded) · 0% chance over 30 yrs
- Wildfire 3/10 Moderate
- Heat 7/10 Severe 7 d/yr ≥102°F today · 15 d/yr by 30 yrs out
- Wind 1/10 Low
- Air quality 10/10 Extreme 25 unhealthy d/yr today · 26 by 30 yrs out
Nearby sold comps map
Loading sold comps map…
Walkable amenities ~0.75 mi
Loading nearby amenities…
Taxation est. · year 1
- Rental income
- $22,192
- − Mortgage interest
- −$8,682
- − Property taxes
- −$2,325
- − Insurance
- −$775
- − Repairs & maintenance
- −$1,775
- − Management
- −$1,775
- − HOA
- −$3,912
- − Depreciation
- −$4,509
- Taxable loss
- −$1,562
- Est. tax savings @ 24.0%
- +$375
- After-tax cash flow
- $1,140/yr
For passive investors: Depreciation is non-cash, so a rental often shows a tax loss while cash-flowing — sheltering income. Rental losses are passive: they offset passive income freely, and up to $25,000/yr can offset ordinary (W-2) income if you actively participate and your MAGI is under $100k (phasing out to $0 by $150k); unused losses carry forward. On sale, claimed depreciation is recaptured at up to 25%, and gains may owe capital-gains tax (a 1031 exchange can defer both). Figures are a year-1 estimate at your 24.0% rate — not tax advice; consult a CPA.
Schools (NCES district)
- District
- Sacramento City Unified
- NCES district ID
- 0633840
- Math proficiency
- 32% ▬ 0.00%
- Reading proficiency
- 43% ▲ 3.00%
- Median HH income
- $49,280
- Composite
- 34.86/100
- National rank
- #10000
- State rank
- #804 of 1400 in CA
Livability — Sacramento
- Score
- 71/100
- State rank
- #218
- US rank
- #6957
Category grades
Schools grade is shown separately in the Schools card above.
Census & demographics
- Census place
- Sacramento, CA
- County
- Sacramento County · 1,539,646 people
- City population
- 761,410
- Metro
- Sacramento-Roseville-Folsom, CA
- Population (ZIP)
- 83,607
- Household income
- $66,895
- Rent vs Own
- Severe rent burden
- 4034.0
Population outlook (Sacramento County) Hauer SSP2
- Today (2025)
- 1,660,763 people
- By 2030
- 1,732,990 · +4.3%
- By 2040
- 1,855,755 · +11.7%
- By 2050
- 1,941,335 · +16.9%
- By 2075
- 2,046,162 · +23.2%
- By 2100
- 1,961,444 · +18.1%
Race, ethnicity, and origin ACS 2023
- Neighborhood character
- Highly diverse neighborhood (Simpson 0.77)
- Race & ethnicity
- Hispanic / Latino 35% Asian 25% Black 17% Two or more races 16% White 11% Pacific Islander 4% Native American 1%
- Hispanic origin (detail)
- Mexican 29% Puerto Rican 1%
- Common ancestry
- Lithuanian 1% Italian 1% Scotch-Irish 1%
- Foreign-born
- 30% · Canada, Vietnam, China
- Languages at home
- 47% English-only · Spanish 25% Other Asian/Pacific 9% Other Indo-European 8%
Political lean MEDSL · Sacramento
- 2024 margin
- D (+19.7) · D 58.1% · R 38.4% · Other 3.5%
- 2008→2024 swing
- +0.7pp no change · 2008: 19.0pp · 2024: 19.7pp
- All cycles
- 2024: D+19.7 2020: D+25.3 2016: D+23.7 2012: D+16.3 2008: D+19.0
Not yet ingested
- Civics
- —
Market trends
- HPI YoY
- ▼ -331.02%
- Current HPI
- 377.4278
- Rent YoY
- ▬ 0.02%
- Metro
- Sacramento-Roseville-Folsom, CA
- State GDP YoY
- ▲ 3.21%
- F500 in state
- 116
Industry mix (Fortune 500 HQ in CA)
| Industry | F500 HQs | Revenue |
|---|---|---|
| Technology | 27 | $1,492B |
|
||
| Financial Services | 3 | $174B |
|
||
| Retail | 3 | $44B |
|
||
| Insurance | 3 | $26B |
|
||
| Media / Entertainment | 2 | $115B |
|
||
| Pharmaceuticals / Biotech | 2 | $62B |
|
||
Price history
1 event — show timeline
- 2005-03-30 Sold (Public Records) $118,500 Public Records
Property tax history
+11.8%/yrLatest (2025): $9,296 · +25.1% YoY. Source: county tax records.
Cash-flow waterfall
monthlySold comps — $/sqft
last 12 mo · ≤1 miLoading sold comps…