 🏷️ Likely Rental
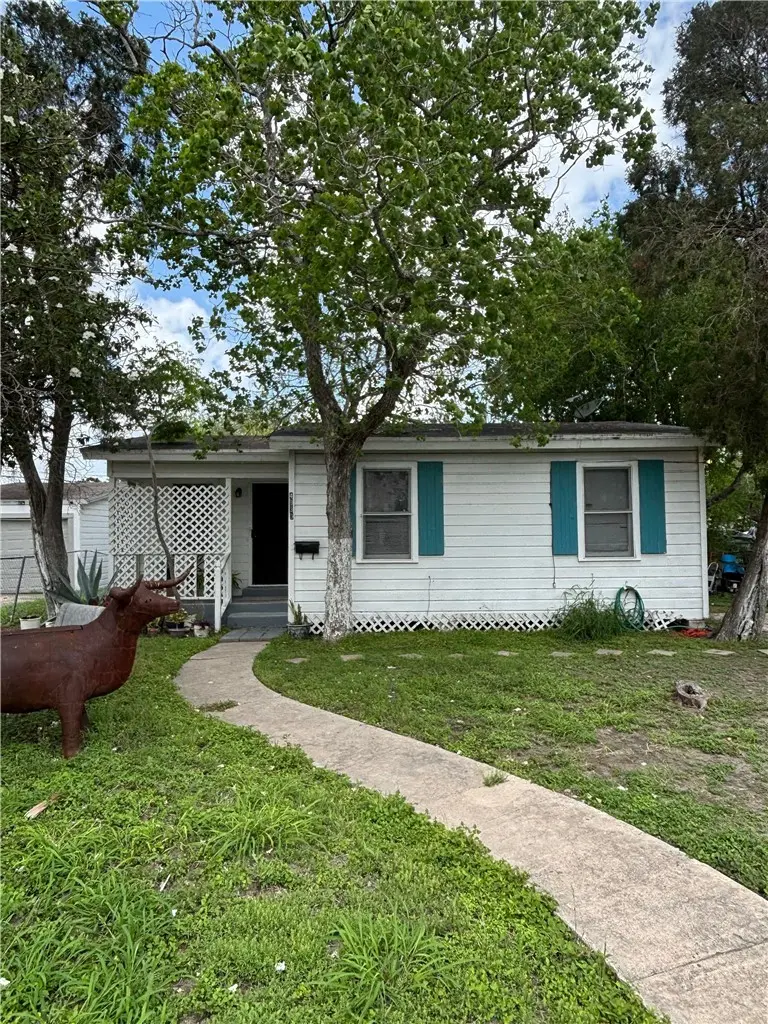
4933 Concord · Corpus Christi, TX
Flood risk 2/10 · Minimal
- FEMA flood zone
- X (unshaded)
- Chance of flooding over 30 yrs
- 0.03%
- Est. flood insurance / yr
- $507 – $1,088
Fire risk 1/10 · Minimal
- Est. fire insurance / yr
- $1,222 – $2,270
Heat risk 10/10 · Severe
- Hot days now (above 107°F)
- 7 days/yr
- Hot days in 30 yrs
- 25 days/yr
Wind risk 9/10 · Severe
- Chance of severe wind over 30 yrs
- 99.0%
Air-quality risk 1/10 · Minimal
- Unhealthy air days now
- 0 days/yr
- Unhealthy air days in 30 yrs
- 0 days/yr
Risk factors via First Street. Map © Google.
Why this score? — see what drove the C+ grade
The composite is a weighted blend of 9 inputs, each scored 0–100. Each bar is that input's sub-score; the figure is the points it added to the 100-point composite (weight × sub-score).
- Cash flow +20.2/30.0
- ARV discount +15.0/15.0
- DSCR +6.4/10.0
- 1% rule +6.2/10.0
- Livability +3.9/5.0
- Rent growth +3.1/5.0
- Schools +2.8/10.0
- Condition / age +2.5/5.0
- Appreciation +0.0/10.0
$110,000
🖨 Deal sheet 📄 Offer letter ✓ Due diligence
Listing remarks MLS
2 bed, 1 bath home offering 800 sqft of potential at 4933 Concord. Includes additional storage space for added convenience. This property is ready for your vision and updates—perfect for investors or buyers looking to renovate and add value. Seller is willing to package this property with another listing at 2834 Willard. PROPERTY IS OCCUPIED WITH TENANT - NO AGREEMENT IN PLACE
Key facts
- 7,645 sq ft lot
- Built 1952
- Listed 63 days
Tags
Neighborhood map
What this means for you Summary
Snapshot
- This is a 2-bed/1.0-bath single-family listed at $110k.
Deal economics
- At list price, monthly cash flow is $138 ($2k/yr) — positive.
- The deal already cash-flows at list — no discount required.
- Meets the 1% rule at list price ($1k rent vs $110k).
- Recommended offer: $103k (6.0% below list) — sets the bar for market timing.
- Cap rate 7.8% vs local median 3.6% in Corpus Christi — top-decile yield for the area; either an underpriced asset or a hidden risk that comps aren't pricing in. Stress-test before assuming the spread holds.
Location & tenants
- Location reads 78/100 on livability (#66 in TX, #2,404 nationally) — a middle-class / working-renter tenant base. Strengths: commute A+, cost of living A+, housing A+; Watch: crime F.
- Corpus Christi ISD (urban): math 31% / reading 35% proficiency, ranked #562 of 826 in TX (top 68%) — families likely to look elsewhere, expect single-tenant / working-renter base with shorter leases; 63% free/reduced lunch — lower-income household profile, screen leases tightly.
- Market conditions: Rents rising (+2.3%/yr); 417 active listings in the ZIP; 34 comparable units currently listed for rent nearby; rentals lingering (median 44d on market — plan ~5-8 weeks vacancy on turnover, expect pricing pressure); 50% of comp listings sitting > 30 days — soft ceiling on asking rent; 1,397 units permitted in Nueces County in 2024 (47 in 5+ unit buildings).
Forward outlook
- Local home prices are declining (-3.0%/yr); year-one equity from $761 of loan paydown is wiped out by about $3k of value loss. Plan a longer hold.
- Nueces County population projected at +36% by 2050 — long-run rental-demand tailwind backs the buy-and-hold thesis.
Negotiation context
- It's been on market 63 days — a 6% lower offer ($103k) is reasonable based on typical stale-listing flexibility.
Risks & watch-outs
- Watch-outs: built in 1952 — expect roof / HVAC / electrical / plumbing capex.
- Climate carrying-cost: severe wind risk, 99% chance of damaging wind over 30y; extreme-heat days projected 7→25/yr by 2055 (HVAC capex compounding) — expect insurance premiums to compound above CPI over the hold.
Questions for the listing agent
- It's been on market 63 days. Have you received any prior offers? Is the seller open to a 6% concession, seller financing, or rate buy-down credit?
- Built in 1952 — when were the roof, HVAC, electrical panel, plumbing, and water heater last replaced?
- Why hasn't it sold? Are there any deal-killer items the seller is aware of (foundation, flood, title, zoning, code violations)?
- Is there a deadline driving the sale (1031 exchange, divorce, estate, relocation)? That informs how much negotiation room exists.
- Crime grade is F in this area — have there been break-ins, vandalism, or insurance claims at this property in the last 3 years? What carrier currently insures it and at what premium?
- What's the average days-on-market for RENTAL listings here right now (not sales)? A rising rental-DOM trend means longer vacancies and softer asking-rent achievability than the comps imply.
- What's the recent tenant-quality profile in this submarket — average credit score on applications, eviction rate, late-payment / NSF rate, and stable-employment percentage? A property-management company in the area should have these aggregated.
- How much new for-sale + rental construction is in the pipeline within 1–3 miles? Heavy new supply typically softens prices + rents 12–24 months out; constrained supply supports both.
Investment metrics
- 1% rule
- 1.12% ✓
- Cap rate
- 7.80%
- Cash-on-cash
- 5.38%
- DSCR
- 1.24
- GRM
- 7.5
CMA / ARV
- ARV (median comp)
- $138,506
- List price
- $110,000
- Delta
- -20.58%
- Verdict
- UNDERPRICED
- Comps
- 20 within 1.0 mi
Show comp detail 12 sales within ~0.75 mi
| Address | Dist | Beds/Ba | Sqft | Sold | Price | $/sf | Match |
|---|---|---|---|---|---|---|---|
| 3813 Delphine St | 0.14mi | 2/1.0 | 816 (+2%) | 8mo | $139,000 | $170 | 83 |
| 5002 Carroll Ln | 0.16mi | 3/1.0 (+1) | 775 (-3%) | 8mo | $149,500 | $193 | 76 |
| 4933 Monitor St | 0.06mi | 3/1.0 (+1) | 830 (+4%) | 15mo | $105,000 | $127 | 73 |
| 4914 Monitor St | 0.10mi | 2/2.5 | 864 (+8%) | 11mo | $178,500 | $207 | 66 |
| 3605 Chestnut St | 0.63mi | 2/1.0 | 775 (-3%) | 1mo | $129,990 | $168 | 65 |
| 4849 Carroll Ln | 0.22mi | 2/1.0 | 883 (+10%) | 13mo | $156,000 | $177 | 61 |
| 4329 Fir St | 0.74mi | 2/1.0 | 780 (-2%) | 3mo | $157,000 | $201 | 59 |
| 3913 Chestnut St | 0.66mi | 2/1.0 | 817 (+2%) | 8mo | $130,000 | $159 | 59 |
| 4625 Cosner Dr | 0.65mi | 2/1.0 | 752 (-6%) | 4mo | $174,900 | $233 | 56 |
| 4409 Cherry St | 0.71mi | 2/1.0 | 828 (+4%) | 7mo | $177,000 | $214 | 55 |
| 3917 Chestnut St | 0.66mi | 2/1.0 | 853 (+7%) | 16mo | $172,500 | $202 | 45 |
| 4406 Willow St | 0.72mi | 2/1.0 | 764 (-4%) | 19mo | $115,000 | $151 | 43 |
Match score weights: distance 35% · size 25% · config 20% · recency 20%. Top-matched comps best support the ARV.
Projected returns pro-forma
-3.0% appreciation · 2.32% rent growth · sell at horizon
- IRR
- -8.7%
- Equity multiple
- 0.68×
- Total profit
- $-9,801
- Equity at exit
- $16,401
- IRR
- -0.2%
- Equity multiple
- 0.99×
- Total profit
- $-333
- Equity at exit
- $9,511
Cash invested: $30,800 (down + closing). Projections, not guarantees.
Landlord ↔ Tenant lean methodology
- Overall (STATE)
- 87 Strongly Landlord-Friendly
- State Texas
- 87 Strongly Landlord-Friendly · R+5
- County
- — inherits STATE
- City
- — inherits STATE
ZIP-level market 78415
- Rents YoY
- 2.3%
- Active inventory
- 417
- Price-to-rent
- 7.5×
Monthly cashflow live
- Estimated rent
- $1,230 high interval (Pro) →
- Mortgage (P&I)
- −$577
- Tax from tax record
- −$211 /mo · $2,534/yr
- Insurance
- −$46
- HOA
- −$0
- Vacancy / Maint / Mgmt
- −$258
- Net cashflow
- $138
Break-even live
UW: 25.0% down · 7.5% · 30yr · 1.5% tax · 5.0% vac · 8.0% maint · 8.0% mgmt
Financing live
Cash to close
- Down payment
- $27,500
- Closing costs
- $3,300
- Reserves months
- —
- Total cash needed
- —
Loan-product check · same deal, 3 products live
Conventional
25% down · 7.5% · 30yr
- Down + closing
- —
- Monthly P&I
- —
- Monthly cashflow
- —
- DSCR
- —
- Eligible?
- —
Personal DTI + credit; lowest rate.
DSCR
20% down · 8.5% · 30yr
- Down + closing
- —
- Monthly P&I
- —
- Monthly cashflow
- —
- DSCR
- —
- Eligible?
- —
No personal income docs; deal must DSCR.
Hard money
10% down · 12.0% · 12mo
- Down + closing
- —
- Monthly P&I
- —
- Monthly cashflow
- —
- DSCR
- —
- Eligible?
- —
Short-term bridge; refi at stabilization.
Rent comps 34 comps
| Address | Beds | Baths | Sqft | Rent | $/sqft | DOM | Units | Dist |
|---|---|---|---|---|---|---|---|---|
| 4961 Monitor St Corpus Christi, TX | 2.0 | 1.0 | 725 | $1,150 | $1.59 | 21d | 1 | 0.10mi |
| 4942 Anthony St Corpus Christi, TX | 3.0 | 1.0 | 1014 | $1,595 | $1.57 | 13d | 1 | 0.10mi |
| 4822 Mokry Dr Corpus Christi, TX | 2.0 | 1.0 | 903 | $1,200 | $1.33 | 21d | 1 | 0.26mi |
| 3738 Marion St Corpus Christi, TX | 3.0 | 1.0 | 1100 | $1,295 | $1.18 | 43d | 1 | 0.31mi |
| 4002 McArdle Rd Corpus Christi, TX | 3.0 | 1.0 | 1018 | $1,095 | $1.08 | 13d | 1 | 0.36mi |
| 3936 Brushwood Ln Corpus Christi, TX | 2.0 | 1.0 | 900 | $925 | $1.03 | 43d | 1 | 0.41mi |
| 5220 Weber Rd Unit G-101 Corpus Christi, TX | 2.0 | 1.5 | 840 | $1,200 | $1.43 | 21d | 1 | 0.51mi |
| 5220 Weber Rd Corpus Christi, TX | 2.0 | 1.0 | 840 | $1,200 | $1.43 | 21d | 1 | 0.51mi |
| 4322 Fir St Corpus Christi, TX | 2.0 | 1.0 | 758 | $1,195 | $1.58 | 43d | 1 | 0.76mi |
| 5623 Carroll Ln Corpus Christi, TX | 2.0 | 1.0 | 750 | $825 | $1.10 | 43d | 1 | 0.82mi |
| 5623 Carroll Ln Corpus Christi, TX | 1.0 | 1.0 | 650 | $725 | $1.12 | 13d | 1 | 0.82mi |
| 4625 Kostoryz Rd Unit 108 Corpus Christi, TX | 2.0 | 1.0 | 720 | $975 | $1.35 | 43d | 1 | 0.86mi |
| 4625 Kostoryz Rd Unit 121 Corpus Christi, TX | 1.0 | 1.0 | 540 | $875 | $1.62 | 43d | 1 | 0.86mi |
| 3620 La Paz Dr Corpus Christi, TX | 2.0 | 1.0 | 875 | $1,195 | $1.37 | 13d | 1 | 0.86mi |
| 3715 La Paz Dr Corpus Christi, TX | 2.0 | 1.0 | 906 | $1,295 | $1.43 | 13d | 1 | 0.88mi |
| 3619 La Paz Dr Corpus Christi, TX | 2.0 | 1.0 | 903 | $1,195 | $1.32 | 21d | 1 | 0.89mi |
| 4022 Montego Dr Corpus Christi, TX | 2.0 | 1.0 | 1070 | $850 | $0.79 | 43d | 1 | 0.89mi |
| 3942 Holly Rd Corpus Christi, TX | 1.0–2.0 | 1.0–2.0 | 870 | $1,112 | $1.28 | 13d | 11 | 0.91mi |
| 4014 Holly Rd Unit 02 Corpus Christi, TX | 2.0 | 1.0 | 1070 | $895 | $0.84 | 43d | 1 | 0.95mi |
| 4213 Lowman St Corpus Christi, TX | 2.0 | 1.0 | 810 | $1,195 | $1.48 | 21d | 1 | 0.96mi |
| 4018 Holly Rd Unit 08 Corpus Christi, TX | 2.0 | 1.0 | 1070 | $895 | $0.84 | 43d | 1 | 0.96mi |
| 4805 Lavaca Dr Unit 1 Corpus Christi, TX | 2.0 | 1.0 | 1030 | $1,300 | $1.26 | 21d | 1 | 0.97mi |
| 4322 Kostoryz Rd Corpus Christi, TX | 2.0 | 1.5 | 1100 | $1,259 | $1.14 | 43d | 1 | 1.01mi |
| 4502 Corona Dr Corpus Christi, TX | 1.0–2.0 | 1.0–2.0 | 855 | $1,000 | $1.17 | 13d | 1 | 1.09mi |
| 4040 Schanen Blvd Corpus Christi, TX | 1.0–2.0 | 1.0–2.0 | 772 | $774 | $1.00 | 43d | 15 | 1.10mi |
| 3803 Caravelle Pkwy Corpus Christi, TX | 2.0 | 1.0–2.0 | 816 | $1,040 | $1.27 | 13d | 57 | 1.18mi |
| 3535 Cottonwood St Unit H5 Corpus Christi, TX | 1.0 | 1.0 | 593 | $790 | $1.33 | 43d | 1 | 1.24mi |
| 3535 Cottonwood St Apt H2 Corpus Christi, TX | 2.0 | 1.0 | 731 | $870 | $1.19 | 43d | 1 | 1.24mi |
| 3535 Cottonwood St Apt E6 Corpus Christi, TX | 1.0 | 1.0 | 593 | $750 | $1.26 | 43d | 1 | 1.24mi |
| 4613 Gollihar Rd Unit 3 Corpus Christi, TX | 1.0 | 1.0 | 743 | $925 | $1.24 | 43d | 1 | 1.27mi |
| 2709 Milo St Corpus Christi, TX | 3.0 | 2.0 | 1122 | $1,700 | $1.52 | 13d | 1 | 1.33mi |
| 1001 Carmel Pkwy Corpus Christi, TX | 1.0 | 1.0 | 854 | $999 | $1.17 | 43d | 1 | 1.42mi |
| 802 Barry St Corpus Christi, TX | 2.0 | 1.5 | 1102 | $1,529 | $1.39 | 43d | 1 | 1.45mi |
| 2534 Johanna St Unit 7 Corpus Christi, TX | 1.0 | 1.0 | 600 | $645 | $1.07 | 21d | 1 | 1.47mi |
Listing history 16 events
-
2026-06-18days on market $110,000 Active 63 DOM
-
2026-06-17days on market $110,000 Active 62 DOM
-
2026-06-16days on market $110,000 Active 61 DOM
-
2026-06-15days on market $110,000 Active 60 DOM
-
2026-06-14days on market $110,000 Active 58 DOM
-
2026-06-10days on market $110,000 Active 55 DOM
-
2026-06-09days on market $110,000 Active 54 DOM
-
2026-06-08days on market $110,000 Active 53 DOM
-
2026-06-07days on market $110,000 Active 52 DOM
-
2026-06-05days on market $110,000 Active 49 DOM
-
2026-06-03days on market $110,000 Active 48 DOM
-
2026-06-02days on market $110,000 Active 47 DOM
-
2026-06-01days on market $110,000 Active 46 DOM
-
2026-05-31days on market $110,000 Active 45 DOM
-
2026-05-30days on market $110,000 Active 44 DOM
-
2026-04-16$110,000 Active 385-char remark
Show marketing remark (385 chars)
2 bed, 1 bath home offering 800 sqft of potential at 4933 Concord. Includes additional storage space for added convenience. This property is ready for your vision and updates—perfect for investors or buyers looking to renovate and add value. Seller is willing to package this property with another listing at 2834 Willard. PROPERTY IS OCCUPIED WITH TENANT - NO AGREEMENT IN PLACE
ⓘ Source: listings_history table (triggers on properties + properties_extension) + one-shot
backfill from property_details.listing_events for pre-trigger history.
Tax reassessment forecast TX · Resets to sale price
- Current annual tax
- $2,534 · $211/mo
- Projected year-2 tax
- $2,534 · $211/mo
- Expected delta
- $0/yr ($0/mo · 0.0%)
ⓘ Screening estimate from a state-policy table — verify with the county assessor before closing.
Climate risk First Street
- Flood 2/10 Low FEMA zone X (unshaded) · 3% chance over 30 yrs
- Wildfire 1/10 Low
- Heat 10/10 Extreme 7 d/yr ≥107°F today · 25 d/yr by 30 yrs out
- Wind 9/10 Extreme 99% chance of damaging wind over 30 yrs
- Air quality 1/10 Low 0 unhealthy d/yr today · 0 by 30 yrs out
Nearby sold comps map
Loading sold comps map…
Walkable amenities ~0.75 mi
Loading nearby amenities…
Taxation est. · year 1
- Rental income
- $14,764
- − Mortgage interest
- −$6,162
- − Property taxes
- −$2,534
- − Insurance
- −$550
- − Repairs & maintenance
- −$1,181
- − Management
- −$1,181
- − Depreciation
- −$3,200
- Taxable loss
- −$44
- Est. tax savings @ 24.0%
- +$11
- After-tax cash flow
- $1,668/yr
For passive investors: Depreciation is non-cash, so a rental often shows a tax loss while cash-flowing — sheltering income. Rental losses are passive: they offset passive income freely, and up to $25,000/yr can offset ordinary (W-2) income if you actively participate and your MAGI is under $100k (phasing out to $0 by $150k); unused losses carry forward. On sale, claimed depreciation is recaptured at up to 25%, and gains may owe capital-gains tax (a 1031 exchange can defer both). Figures are a year-1 estimate at your 24.0% rate — not tax advice; consult a CPA.
Schools (NCES district)
- District
- Corpus Christi ISD
- NCES district ID
- 4815270
- Math proficiency
- 31% ▼ -18.00%
- Reading proficiency
- 35% ▼ -7.00%
- Median HH income
- $45,672
- Composite
- 28.27/100
- National rank
- #6793
- State rank
- #562 of 826 in TX
Livability — Corpus Christi
- Score
- 78/100
- State rank
- #66
- US rank
- #2404
Category grades
Schools grade is shown separately in the Schools card above.
Census & demographics
- Census place
- Corpus Christi, TX
- County
- Nueces County · 296,836 people
- City population
- 296,836
- Metro
- Corpus Christi, TX
- Population (ZIP)
- 43,080
- Household income
- $54,990
- Rent vs Own
- Severe rent burden
- 1730.0
Population outlook (Nueces County) Hauer SSP2
- Today (2025)
- 418,037 people
- By 2030
- 447,123 · +7.0%
- By 2040
- 505,911 · +21.0%
- By 2050
- 567,522 · +35.8%
- By 2075
- 729,686 · +74.6%
- By 2100
- 847,087 · +102.6%
Race, ethnicity, and origin ACS 2023
- Neighborhood character
- Predominantly Hispanic (83%)
- Race & ethnicity
- Hispanic / Latino 83% Two or more races 41% White 12% Black 3%
- Hispanic origin (detail)
- Mexican 75%
- Foreign-born
- 9% · Canada
- Languages at home
- 59% English-only · Spanish 40%
Political lean MEDSL · Nueces
- 2024 margin
- R (+11.5) · D 43.8% · R 55.3%
- 2008→2024 swing
- -7.1pp toward R · 2008: -4.4pp · 2024: -11.5pp
- All cycles
- 2024: R+11.5 2020: R+2.9 2016: R+1.5 2012: R+3.2 2008: R+4.4
Not yet ingested
- Civics
- —
Market trends
- HPI YoY
- ▼ -173.20%
- Current HPI
- 158.011
- Rent YoY
- ▲ 2.32%
- Metro
- Corpus Christi, TX
- State GDP YoY
- ▲ 3.95%
- F500 in state
- 110
Industry mix (Fortune 500 HQ in TX)
| Industry | F500 HQs | Revenue |
|---|---|---|
| Energy | 16 | $1,198B |
|
||
| Technology | 5 | $198B |
|
||
| Engineering / Construction | 4 | $72B |
|
||
| Energy Services | 3 | $60B |
|
||
| Utilities | 3 | $41B |
|
||
| Healthcare | 2 | $330B |
|
||
Price history
1 event — show timeline
- 2026-04-16 Listed $110,000 CBMLS
Property tax history
+5.3%/yrLatest (2025): $2,534 · +1.4% YoY. Source: county tax records.
Cash-flow waterfall
monthlySold comps — $/sqft
last 12 mo · ≤1 miLoading sold comps…