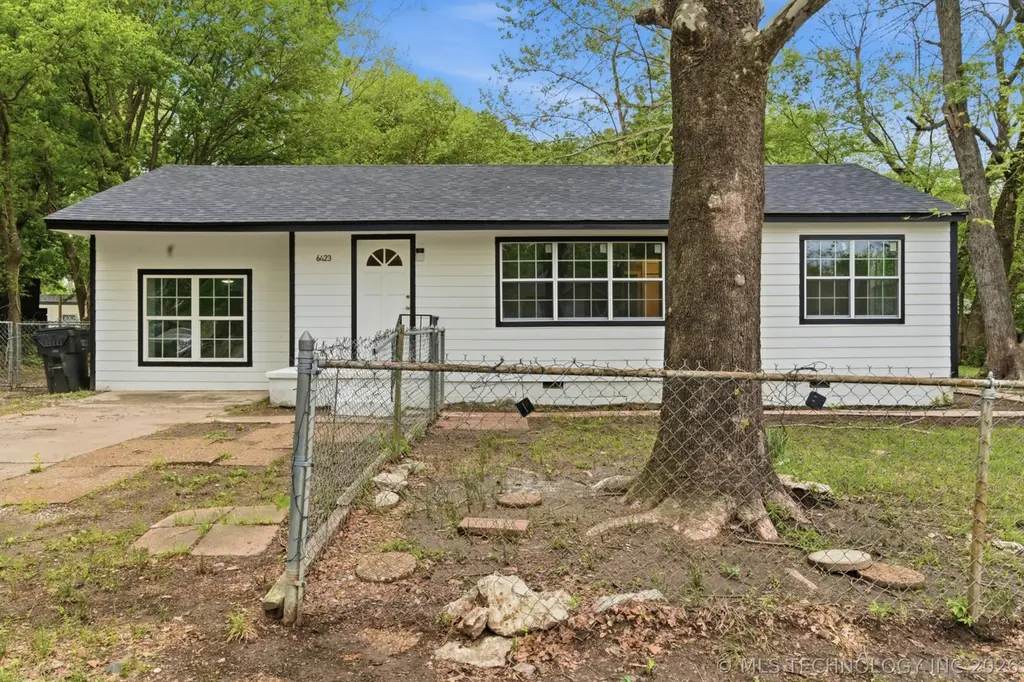
6423 N Wheeling Ave · Turley, OK
Flood risk 1/10 · Minimal
- FEMA flood zone
- X (unshaded)
- Chance of flooding over 30 yrs
- 0.0%
- Est. flood insurance / yr
- $507 – $1,088
Fire risk 5/10 · Moderate
- Est. fire insurance / yr
- $2,463 – $4,575
Heat risk 6/10 · Moderate
- Hot days now (above 110°F)
- 7 days/yr
- Hot days in 30 yrs
- 18 days/yr
Wind risk 3/10 · Minor
- Chance of severe wind over 30 yrs
- 4.0%
Air-quality risk 2/10 · Minimal
- Unhealthy air days now
- 2 days/yr
- Unhealthy air days in 30 yrs
- 2 days/yr
Risk factors via First Street. Map © Google.
Why this score? — see what drove the C+ grade
The composite is a weighted blend of 9 inputs, each scored 0–100. Each bar is that input's sub-score; the figure is the points it added to the 100-point composite (weight × sub-score).
- Cash flow +23.2/30.0
- ARV discount +14.3/15.0
- DSCR +7.5/10.0
- 1% rule +4.8/10.0
- Appreciation +3.7/10.0
- Livability +3.4/5.0
- Rent growth +2.5/5.0
- Condition / age +2.5/5.0
- Schools +0.8/10.0
$120,000
🖨 Deal sheet (PDF) 📄 Offer letter ✓ Due diligence
Listing remarks MLS
NEAT & CLEAN, GARAGE CONVERTED TO SUNKEN DEN FOR 2 LIV. AREAS, STORM DOOR & STORM WINDOWS, FML. DIN. W/ PARQUET FLOOR & PANTRY, 10X12 DUTCH BARN FOR SALE. $300 ALLOW. FOR NEW DW. PLAYHOUSE DOES NOT STAY.
Key facts
- Garage conversion
- New siding
- Remodeled bathroom
Tags
Property features AI
Exterior
- Parking: Gravel driveway parking
- Security: Smoke detectors installed; No safety shelter
- Utilities: Electricity available; High-speed internet available; Public water; Public sewer
- Home design: Single-story home; Faces east; Crawlspace foundation
- Construction: Built using HardiPlank, stucco, and wood frame; Asphalt/fiberglass roof
- Exterior features: Gravel driveway; Mature trees; Chain link fencing
Interior
- Kitchen: Oven; Range; Stove; Refrigerator
- Bedrooms: Master bedroom (First floor); Additional bedroom (First floor)
- Flooring: Hardwood; Tile
- Bathrooms: One full bathroom (First floor); Master bath (First floor)
- Heating & cooling: Central heating (Gas); Central air conditioning
- Interior features: High-speed internet available; Laminate countertops; Wired for data; Electric range connection; Programmable thermostat; Vinyl windows
- Laundry & utility: Washer hookup
Neighborhood map
What this means for you Summary
Snapshot
- This is a 2-bed/1.0-bath single-family listed at $120k.
Deal economics
- At list price, monthly cash flow is $217 ($3k/yr) — positive.
- The deal already cash-flows at list — no discount required.
- To meet the 1% rule (rent ≥ 1% of price), the offer needs to be $117k (2.2% below list).
- Recommended offer: $113k (6.0% below list) — sets the bar for market timing.
Location & tenants
- Location reads 67/100 on livability (#98 in OK) — a middle-class / working-renter tenant base. Strengths: commute A+, cost of living A+, housing A+; Watch: schools F, amenities F, employment F.
- Tulsa (urban): math 7% / reading 12% proficiency, ranked #250 of 270 in OK (top 93%) — low school quality limits family demand, transient renter base, plan for 1-2y turnover; 76% free/reduced lunch — lower-income household profile, screen leases tightly.
- Market conditions: 4 active listings in the ZIP; 5 comparable units currently listed for rent nearby; rentals leasing fast (median 3d on market — plan ~1-2 weeks tenant-placement turnaround); 2,818 units permitted in Tulsa County in 2024 (518 in 5+ unit buildings).
Forward outlook
- Local home prices are declining (-2.7%/yr); year-one equity from $830 of loan paydown is wiped out by about $3k of value loss. Plan a longer hold.
- Tulsa County population projected at +30% by 2050 — long-run rental-demand tailwind backs the buy-and-hold thesis.
Negotiation context
- It's been on market 64 days — a 6% lower offer ($113k) is reasonable based on typical stale-listing flexibility.
- 2 sale attempts since 28y ago; this cycle's ask has dropped $10k (8%) from the opening price — seller is motivated, your offer sets the floor, not the list.
- Current owner paid $36k; list at $120k implies a 233% gain — meaningful room to come down on a strong offer.
Risks & watch-outs
- Watch-outs: built in 1950 — expect roof / HVAC / electrical / plumbing capex.
- Climate carrying-cost: moderate wildfire risk; extreme-heat days projected 7→18/yr by 2055 (HVAC capex compounding) — expect insurance premiums to compound above CPI over the hold.
Questions for the listing agent
- It's been on market 64 days. Have you received any prior offers? Is the seller open to a 6% concession, seller financing, or rate buy-down credit?
- Built in 1950 — when were the roof, HVAC, electrical panel, plumbing, and water heater last replaced?
- Why hasn't it sold? Are there any deal-killer items the seller is aware of (foundation, flood, title, zoning, code violations)?
- Is there a deadline driving the sale (1031 exchange, divorce, estate, relocation)? That informs how much negotiation room exists.
- Schools are F-rated, which usually means shorter tenancies and higher turnover. Who's the typical renter profile here, and what's been the actual vacancy rate?
- What's the average days-on-market for RENTAL listings here right now (not sales)? A rising rental-DOM trend means longer vacancies and softer asking-rent achievability than the comps imply.
- What's the recent tenant-quality profile in this submarket — average credit score on applications, eviction rate, late-payment / NSF rate, and stable-employment percentage? A property-management company in the area should have these aggregated.
- How much new for-sale + rental construction is in the pipeline within 1–3 miles? Heavy new supply typically softens prices + rents 12–24 months out; constrained supply supports both.
Investment metrics
- 1% rule
- 0.98% ✗
- Cap rate
- 8.46%
- Cash-on-cash
- 7.76%
- DSCR
- 1.35
- GRM
- 8.5
CMA / ARV
- ARV (on-the-fly)
- $141,476
- Comps found
- 6
Show comp detail 6 sales within ~0.75 mi
| Address | Dist | Beds/Ba | Sqft | Sold | Price | $/sf | Match |
|---|---|---|---|---|---|---|---|
| 6448 N Wheeling Ave | 0.06mi | 2/2.0 | 1,301 (+4%) | 8mo | $115,000 | $88 | 80 |
| 1918 E 61st Ct | 0.22mi | 3/1.5 (+1) | 1,216 (-3%) | 3mo | $55,000 | $45 | 75 |
| 6102 N Wheeling Ave | 0.27mi | 3/1.5 (+1) | 1,233 (-2%) | 4mo | $140,000 | $114 | 74 |
| 2014 E 61st Pl | 0.29mi | 3/1.5 (+1) | 1,197 (-4%) | 12mo | $162,500 | $136 | 62 |
| 6512 N Rockford Ave | 0.48mi | 3/2.0 (+1) | 1,236 (-1%) | 16mo | $140,000 | $113 | 53 |
| 5644 N Lewis Ave | 0.73mi | 3/1.0 (+1) | 1,224 (-2%) | 18mo | $75,000 | $61 | 42 |
Match score weights: distance 35% · size 25% · config 20% · recency 20%. Top-matched comps best support the ARV.
Projected returns pro-forma
-2.7% appreciation · 3.0% rent growth · sell at horizon
- IRR
- -3.2%
- Equity multiple
- 0.88×
- Total profit
- $-4,151
- Equity at exit
- $19,506
- IRR
- 5.9%
- Equity multiple
- 1.45×
- Total profit
- $15,277
- Equity at exit
- $13,168
Cash invested: $33,600 (down + closing). Projections, not guarantees.
Landlord ↔ Tenant lean methodology
- Overall (STATE)
- 83 Strongly Landlord-Friendly
- State Oklahoma
- 83 Strongly Landlord-Friendly · R+20
- County
- — inherits STATE
- City
- — inherits STATE
ZIP-level market 74130
- Home prices YoY
- -1.2%
- Active inventory
- 4
- Price-to-rent
- 8.5×
Monthly cashflow live
- Estimated rent
- $1,174 high interval (Pro) →
- Mortgage (P&I)
- −$629
- Tax from tax record
- −$31 /mo · $370/yr
- Insurance
- −$50
- HOA
- −$0
- Vacancy / Maint / Mgmt
- −$247
- Net cashflow
- $217
Break-even live
Sensitivity live
| Price | -10% $285 | -5% $251 | +0% $217 | +5% $183 | +10% $149 |
|---|---|---|---|---|---|
| Rent | -10% $124 | -5% $171 | +0% $217 | +5% $264 | +10% $310 |
| Rate | -1.0pp $278 | -0.5pp $248 | base $217 | +0.5pp $186 | +1.0pp $154 |
UW: 25.0% down · 7.5% · 30yr · 1.5% tax · 5.0% vac · 8.0% maint · 8.0% mgmt
Financing live
Cash to close
- Down payment
- $30,000
- Closing costs
- $3,600
- Reserves months
- —
- Total cash needed
- —
Loan-product check · same deal, 3 products live
Conventional
25% down · 7.5% · 30yr
- Down + closing
- —
- Monthly P&I
- —
- Monthly cashflow
- —
- DSCR
- —
- Eligible?
- —
Personal DTI + credit; lowest rate.
DSCR
20% down · 8.5% · 30yr
- Down + closing
- —
- Monthly P&I
- —
- Monthly cashflow
- —
- DSCR
- —
- Eligible?
- —
No personal income docs; deal must DSCR.
Hard money
10% down · 12.0% · 12mo
- Down + closing
- —
- Monthly P&I
- —
- Monthly cashflow
- —
- DSCR
- —
- Eligible?
- —
Short-term bridge; refi at stabilization.
Rent comps 5 comps
| Address | Beds | Baths | Sqft | Rent | $/sqft | DOM | Units | Dist |
|---|---|---|---|---|---|---|---|---|
| 1553 E 53rd St N Tulsa, OK | 3.0 | 1.0 | 1100 | $1,250 | $1.14 | 2d | 1 | 1.15mi |
| 1530 E 52nd St N Tulsa, OK | 3.0 | 2.0 | 1042 | $1,500 | $1.44 | 2d | 1 | 1.24mi |
| 5731 N Garrison Pl Tulsa, OK | 3.0 | 1.0 | 912 | $925 | $1.01 | 2d | 1 | 1.33mi |
| 5510 N Johnstown Ave Tulsa, OK | 3.0 | 1.0 | 972 | $995 | $1.02 | 2d | 1 | 1.34mi |
| 5618 N Garrison Pl Tulsa, OK | 3.0 | 1.0 | 904 | $1,100 | $1.22 | 22d | 1 | 1.42mi |
Listing history 20 events
-
2026-06-18days on market $120,000 Active 64 DOM
-
2026-06-17days on market $120,000 Active 63 DOM
-
2026-06-16days on market $120,000 Active 62 DOM
-
2026-06-15days on market $120,000 Active 61 DOM
-
2026-06-13days on market $120,000 Active 59 DOM
-
2026-06-10days on market $120,000 Active 56 DOM
-
2026-06-09days on market $120,000 Active 55 DOM
-
2026-06-08days on market $120,000 Active 54 DOM
-
2026-06-07days on market $120,000 Active 53 DOM
-
2026-06-05days on market $120,000 Active 50 DOM
-
2026-06-03days on market $120,000 Active 49 DOM
-
2026-06-02days on market $120,000 Active 48 DOM
-
2026-06-01days on market $120,000 Active 47 DOM
-
2026-05-31days on market $120,000 Active 46 DOM
-
2026-05-22price $120,000
-
2026-04-13$130,000 Active
-
1998-06-02soldstatus $36,000
-
1998-05-29soldstatus $36,000 221-char remark
Show marketing remark (221 chars)
NEAT & CLEAN, GARAGE CONVERTED TO SUNKEN DEN FOR 2 LIV. AREAS, STORM DOOR & STORM WINDOWS, FML. DIN. W/ PARQUET FLOOR & PANTRY, 10X12 DUTCH BARN FOR SALE. $300 ALLOW. FOR NEW DW. PLAYHOUSE DOES NOT STAY.
-
1998-04-08historical 221-char remark
Show marketing remark (221 chars)
NEAT & CLEAN, GARAGE CONVERTED TO SUNKEN DEN FOR 2 LIV. AREAS, STORM DOOR & STORM WINDOWS, FML. DIN. W/ PARQUET FLOOR & PANTRY, 10X12 DUTCH BARN FOR SALE. $300 ALLOW. FOR NEW DW. PLAYHOUSE DOES NOT STAY.
-
1998-02-09$32,000 221-char remark
Show marketing remark (221 chars)
NEAT & CLEAN, GARAGE CONVERTED TO SUNKEN DEN FOR 2 LIV. AREAS, STORM DOOR & STORM WINDOWS, FML. DIN. W/ PARQUET FLOOR & PANTRY, 10X12 DUTCH BARN FOR SALE. $300 ALLOW. FOR NEW DW. PLAYHOUSE DOES NOT STAY.
ⓘ Source: listings_history table (triggers on properties + properties_extension) + one-shot
backfill from property_details.listing_events for pre-trigger history.
Tax reassessment forecast OK · Resets to sale price
- Current annual tax
- $370 · $31/mo
- Projected year-2 tax
- $1,080 · $90/mo
- Expected delta
- +$710/yr (+$59/mo · 191.9%)
ⓘ Screening estimate from a state-policy table — verify with the county assessor before closing.
Climate risk First Street
- Flood 1/10 Low FEMA zone X (unshaded) · 0% chance over 30 yrs
- Wildfire 5/10 Major
- Heat 6/10 Major 7 d/yr ≥110°F today · 18 d/yr by 30 yrs out
- Wind 3/10 Moderate 4% chance of damaging wind over 30 yrs
- Air quality 2/10 Low 2 unhealthy d/yr today · 2 by 30 yrs out
Nearby sold comps map
Loading sold comps map…
Walkable amenities ~0.75 mi
Loading nearby amenities…
Taxation est. · year 1
- Rental income
- $14,086
- − Mortgage interest
- −$6,722
- − Property taxes
- −$370
- − Insurance
- −$600
- − Repairs & maintenance
- −$1,127
- − Management
- −$1,127
- − Depreciation
- −$3,491
- Taxable income
- $649
- Est. tax owed @ 24.0%
- −$156
- After-tax cash flow
- $2,450/yr
For passive investors: Depreciation is non-cash, so a rental often shows a tax loss while cash-flowing — sheltering income. Rental losses are passive: they offset passive income freely, and up to $25,000/yr can offset ordinary (W-2) income if you actively participate and your MAGI is under $100k (phasing out to $0 by $150k); unused losses carry forward. On sale, claimed depreciation is recaptured at up to 25%, and gains may owe capital-gains tax (a 1031 exchange can defer both). Figures are a year-1 estimate at your 24.0% rate — not tax advice; consult a CPA.
Schools (NCES district)
- District
- Tulsa
- NCES district ID
- 4030240
- Math proficiency
- 7% ▼ -9.00%
- Reading proficiency
- 12% ▼ -7.00%
- Median HH income
- $37,895
- Composite
- 8.04/100
- National rank
- #9919
- State rank
- #250 of 270 in OK
Livability — Turley
- Score
- 67/100
- State rank
- #98
- US rank
- #11030
Category grades
Schools grade is shown separately in the Schools card above.
Census & demographics
- Census place
- Turley, OK
- City population
- 2,217
- Population (ZIP)
- 2,217
Population outlook (Tulsa County) Hauer SSP2
- Today (2025)
- 723,846 people
- By 2030
- 766,033 · +5.8%
- By 2040
- 851,386 · +17.6%
- By 2050
- 938,389 · +29.6%
- By 2075
- 1,166,011 · +61.1%
- By 2100
- 1,350,277 · +86.5%
Race, ethnicity, and origin ACS 2023
- Neighborhood character
- Highly diverse neighborhood (Simpson 0.80)
- Race & ethnicity
- Hispanic / Latino 27% White 26% Black 25% Two or more races 19% Native American 8% Asian 2%
- Hispanic origin (detail)
- Mexican 21% Puerto Rican 1%
- Common ancestry
- Iranian 1% Portuguese 1% Lithuanian 1%
- Foreign-born
- 11% · Canada, China
- Languages at home
- 72% English-only · Spanish 26% Other Asian/Pacific 2% Arabic 0%
Political lean MEDSL · Tulsa
- 2024 margin
- R (+15.2) · D 41.3% · R 56.5% · Other 2.2%
- 2008→2024 swing
- +9.2pp toward D · 2008: -24.5pp · 2024: -15.2pp
- All cycles
- 2024: R+15.2 2020: R+15.6 2016: R+22.9 2012: R+27.4 2008: R+24.5
Not yet ingested
- Civics
- —
Market trends
- HPI YoY
- ▼ -2.70%
- Current HPI
- 226.7769
- Rent YoY
- —
- Metro
- —
- State GDP YoY
- ▲ 1.55%
- F500 in state
- 6
Industry mix (Fortune 500 HQ in OK)
| Industry | F500 HQs | Revenue |
|---|---|---|
| Energy | 3 | $48B |
|
||
Price history
+275.0% since first listed6 events — show timeline
- 2026-05-22 Price Changed $120,000 MLS Technology, Inc.
- 2026-04-13 Listed $130,000 MLS Technology, Inc.
- 1998-06-02 Sold (Public Records) $36,000 Public Records
- 1998-05-29 Sold (MLS) $36,000 MLS Technology, Inc.
- 1998-04-08 Listing Removed — MLS Technology, Inc.
- 1998-02-09 Listed $32,000 MLS Technology, Inc.
Property tax history
+3.8%/yrLatest (2025): $370 · +0.3% YoY. Source: county tax records.
Cash-flow waterfall
monthlySold comps — $/sqft
last 12 mo · ≤1 miLoading sold comps…