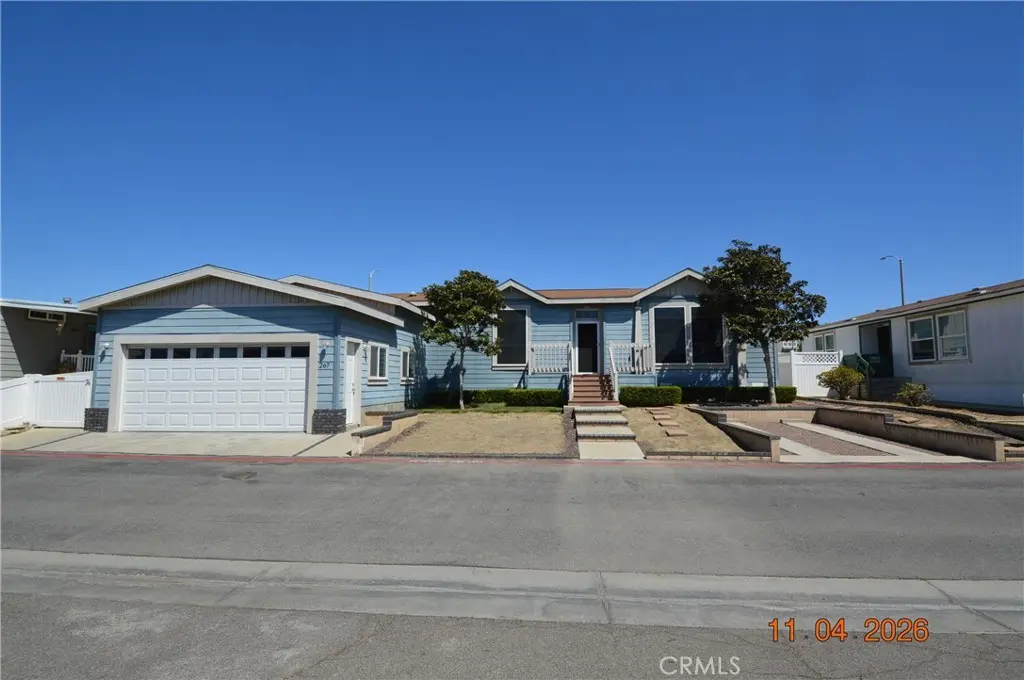
20701 Beach Blvd #267 · Huntington Beach, CA
Flood risk No data
- FEMA flood zone
- —
- Chance of flooding over 30 yrs
- —
- Est. flood insurance / yr
- —
Fire risk No data
- Est. fire insurance / yr
- —
Heat risk No data
- Hot days now (above threshold)
- —
- Hot days in 30 yrs
- —
Wind risk No data
- Chance of severe wind over 30 yrs
- —
Air-quality risk No data
- Unhealthy air days now
- —
- Unhealthy air days in 30 yrs
- —
Risk factors via First Street. Map © Google.
Why this score? — see what drove the B grade
The composite is a weighted blend of 9 inputs, each scored 0–100. Each bar is that input's sub-score; the figure is the points it added to the 100-point composite (weight × sub-score).
- Cash flow +30.0/30.0
- 1% rule +10.0/10.0
- DSCR +10.0/10.0
- ARV discount +8.4/15.0
- Schools +6.5/10.0
- Livability +3.4/5.0
- Rent growth +3.2/5.0
- Condition / age +2.5/5.0
- Appreciation +0.0/10.0
$274,999
🖨 Deal sheet 📄 Offer letter ✓ Due diligence
Listing remarks
Live MINUTES from the beach in this beautiful 3 bedroom 2 bath home WITH 2 car attached garage and space to park a third car. Open floor plan with lots of upgrades. Huge Master bedroom has walk-in closet, shower and bathtub. Open floor plan allows for family get togethers in large kitchen attached to family room. Separate laundry room and very nice backyard. Sits in Huntington Shorecliffs that provides so many community amenities, you never have to leave. This is a must see!!!!
Key facts
- Open floor plan
- Walk-in closet
- Large kitchen
Tags
Property features AI
Finance
- Other: Located in the Huntington Shorecliffs park (manager approval required)
- Financial info: Land lease of $2,800 per month (park land lease)
- HOA & community: Part of an association; Association amenities include gym/exercise room, pool, spa, clubhouse, billiard room, barbecue/outdoor cooking area, picnic area, dog park, common RV parking
Exterior
- Parking: Attached garage with direct access; Two garage spaces; One uncovered parking space (three total parking spaces)
- Utilities: Public sewer; District/public water
- Home design: Single-story manufactured/mobile home; Entry level is ground floor; Turnkey condition; Mobile home remains (23 ft by 74 ft)
- Construction: Quake bracing; Pillar/post/pier foundation
- Exterior features: Community pool; Sprinklers in front; Front yard; Back yard; One shed on the property
Interior
- Kitchen: Kitchen open to family room; Kitchen island; Granite counters; Gas cooktop; Gas oven; Microwave; Dishwasher; Garbage disposal; Gas water heater
- Bedrooms: All bedrooms on the main level; Walk-in closet
- Flooring: Laminate flooring
- Bathrooms: Two full bathrooms; Separate tub and walk-in shower; Tile counters
- Heating & cooling: Central furnace
- Interior features: Ceiling fan; Recessed lighting; Open floor plan; Granite counters; Entry located off the living room; One-level home; Community spa
- Laundry & utility: Indoor laundry in its own room; Has laundry hookups
Neighborhood map
What this means for you Summary
Snapshot
- This is a 3-bed/2.0-bath manufactured listed at $275k.
Deal economics
- At list price, monthly cash flow is $2k ($27k/yr) — positive.
- The deal already cash-flows at list — no discount required.
- Meets the 1% rule at list price ($5k rent vs $275k).
- Cap rate 16.3% vs local median 1.6% in Huntington Beach — top-decile yield for the area; either an underpriced asset or a hidden risk that comps aren't pricing in. Stress-test before assuming the spread holds.
Location & tenants
- Location reads 67/100 on livability (#306 in CA) — a middle-class / working-renter tenant base. Strengths: employment A+, commute A-, schools B+; Watch: amenities C-, cost of living F, health & safety F.
- Huntington Beach Union High (suburban): math 65% / reading 82% proficiency, ranked #39 of 517 in CA (top 8%) — strong family-tenant draw, lease renewals of 3-5y typical.
- Market conditions: Rents rising (+2.8%/yr); 135 active listings in the ZIP; 40 comparable units currently listed for rent nearby; rentals leasing fast (median 2d on market — plan ~1-2 weeks tenant-placement turnaround); high-income renter base; 6,974 units permitted in Orange County in 2024 (3,839 in 5+ unit buildings).
- At $4,955/mo this rent would consume 46% of the median local household income ($130k/yr) (locally 2957% of renters already pay >50% of income on rent) — very limited rent-growth headroom before tenants either downsize or default.
Forward outlook
- Local home prices are declining (-3.0%/yr); year-one equity from $2k of loan paydown is wiped out by about $8k of value loss. Plan a longer hold.
- Orange County population projected at +14% by 2050 — modest demand growth; plan on rents tracking national, not racing it.
- At projected returns (-3.0% appreciation + 2.8% rent growth), your $77k cash investment doubles in ~4 years — after that, you're playing with house money.
Negotiation context
- Only 6 days on market — expect competitive offers; lowballing is unlikely to land.
Questions for the listing agent
- Is there a deadline driving the sale (1031 exchange, divorce, estate, relocation)? That informs how much negotiation room exists.
- Schools are B-rated — typically a magnet for longer-tenancy family renters. What's the average tenant stay here, and is there a school-zone premium baked into asking?
- What's the average days-on-market for RENTAL listings here right now (not sales)? A rising rental-DOM trend means longer vacancies and softer asking-rent achievability than the comps imply.
- What's the recent tenant-quality profile in this submarket — average credit score on applications, eviction rate, late-payment / NSF rate, and stable-employment percentage? A property-management company in the area should have these aggregated.
- How much new for-sale + rental construction is in the pipeline within 1–3 miles? Heavy new supply typically softens prices + rents 12–24 months out; constrained supply supports both.
Investment metrics
- 1% rule
- 1.80% ✓
- Cap rate
- 16.27%
- Cash-on-cash
- 35.62%
- DSCR
- 2.58
- GRM
- 4.6
CMA / ARV
- ARV (on-the-fly)
- $280,849
- Comps found
- 12
Show comp detail 12 sales within ~0.75 mi
| Address | Dist | Beds/Ba | Sqft | Sold | Price | $/sf | Match |
|---|---|---|---|---|---|---|---|
| 20701 beach Blvd #168 | 0.12mi | 3/2.0 | 1,620 (-6%) | 1mo | $150,000 | $93 | 84 |
| 80 Huntington #402 | 0.32mi | 3/2.0 | 1,680 (-2%) | 1mo | $265,000 | $158 | 80 |
| 20701 Beach Blvd #55 | 0.10mi | 3/2.0 | 1,566 (-9%) | 2mo | $255,000 | $163 | 79 |
| 20701 Beach Blvd #259 | 0.06mi | 3/2.0 | 1,800 (+4%) | 16mo | $257,500 | $143 | 76 |
| 20701 Beach Blvd #100 | 0.11mi | 3/2.0 | 1,560 (-10%) | 8mo | $280,000 | $179 | 73 |
| 20701 Beach Blvd #106 | 0.09mi | 3/2.0 | 1,560 (-10%) | 10mo | $225,000 | $144 | 72 |
| 20701 Beach Blvd #229 | 0.09mi | 3/2.0 | 1,593 (-8%) | 15mo | $335,000 | $210 | 71 |
| 20701 Beach Blvd #220 | 0.13mi | 3/3.0 | 1,500 (-13%) | 2mo | $275,000 | $183 | 67 |
| 20701 Beach Blvd #79 | 0.21mi | 3/2.5 | 1,800 (+4%) | 16mo | $160,000 | $89 | 67 |
| 20701 Beach Blvd #28 | 0.23mi | 2/2.0 (-1) | 1,605 (-7%) | 14mo | $290,000 | $181 | 61 |
| 80 Huntington St #708 | 0.47mi | 3/2.0 | 1,550 (-10%) | 10mo | $280,000 | $181 | 53 |
| 20701 Beach Blvd #85 | 0.26mi | 3/2.0 | 1,500 (-13%) | 18mo | $200,000 | $133 | 52 |
Match score weights: distance 35% · size 25% · config 20% · recency 20%. Top-matched comps best support the ARV.
Projected returns pro-forma
-3.0% appreciation · 2.78% rent growth · sell at horizon
- IRR
- 31.0%
- Equity multiple
- 2.30×
- Total profit
- $99,826
- Equity at exit
- $41,003
- IRR
- 38.1%
- Equity multiple
- 4.50×
- Total profit
- $269,531
- Equity at exit
- $23,777
Cash invested: $77,000 (down + closing). Projections, not guarantees.
Landlord ↔ Tenant lean methodology
- Overall (STATE)
- 18 Strongly Tenant-Friendly
- State California
- 18 Strongly Tenant-Friendly · D+13
- County
- — inherits STATE
- City
- — inherits STATE
ZIP-level market 92648
- Rents YoY
- 2.8%
- Active inventory
- 135
- Price-to-rent
- 4.6×
Monthly cashflow live
- Estimated rent
- $4,955 high interval (Pro) →
- Mortgage (P&I)
- −$1,442
- Tax from tax record
- −$72 /mo · $860/yr
- Insurance
- −$115
- HOA
- −$0
- Vacancy / Maint / Mgmt
- −$1,040
- Net cashflow
- $2,286
Break-even live
UW: 25.0% down · 7.5% · 30yr · 1.5% tax · 5.0% vac · 8.0% maint · 8.0% mgmt
Financing live
Cash to close
- Down payment
- $68,750
- Closing costs
- $8,250
- Reserves months
- —
- Total cash needed
- —
Loan-product check · same deal, 3 products live
Conventional
25% down · 7.5% · 30yr
- Down + closing
- —
- Monthly P&I
- —
- Monthly cashflow
- —
- DSCR
- —
- Eligible?
- —
Personal DTI + credit; lowest rate.
DSCR
20% down · 8.5% · 30yr
- Down + closing
- —
- Monthly P&I
- —
- Monthly cashflow
- —
- DSCR
- —
- Eligible?
- —
No personal income docs; deal must DSCR.
Hard money
10% down · 12.0% · 12mo
- Down + closing
- —
- Monthly P&I
- —
- Monthly cashflow
- —
- DSCR
- —
- Eligible?
- —
Short-term bridge; refi at stabilization.
Rent comps 40 comps
| Address | Beds | Baths | Sqft | Rent | $/sqft | DOM | Units | Dist |
|---|---|---|---|---|---|---|---|---|
| 20966 Seacoast Cir Huntington Beach, CA | 3.0 | 2.5 | 1685 | $4,300 | $2.55 | 7d | 1 | 0.13mi |
| 7946 Waterfall Cir Huntington Beach, CA | 2.0 | 2.5 | 1439 | $4,500 | $3.13 | 1d | 1 | 0.22mi |
| 509 Delaware St Unit A Huntington Beach, CA | 3.0 | 2.0 | 1200 | $3,200 | $2.67 | 1d | 1 | 0.27mi |
| 7795 Neptune Dr Huntington Beach, CA | 2.0–4.0 | 1.5–2.5 | 1155 | $4,654 | $4.03 | 1d | 3 | 0.28mi |
| 7961 Southwind Cir Huntington Beach, CA | 3.0 | 2.5 | 1664 | $6,195 | $3.72 | 1d | 1 | 0.29mi |
| 7832 Seaglen Dr Huntington Beach, CA | 3.0 | 2.5 | 1700 | $8,000 | $4.71 | 1d | 1 | 0.31mi |
| 7866 Southwind Cir Huntington Beach, CA | 3.0 | 2.0 | 1787 | $5,000 | $2.80 | 1d | 1 | 0.32mi |
| 8342 Castilian Dr Huntington Beach, CA | 3.0 | 2.0 | 1885 | $6,000 | $3.18 | 1d | 1 | 0.39mi |
| 80 HUNTINGTON St Huntington Beach, OS | 2.0 | 2.0 | 1276 | $3,825 | $3.00 | 1d | 1 | 0.40mi |
| 7972 Aldea Cir Unit 1 Huntington Beach, CA | 2.0 | 2.5 | 1900 | $5,750 | $3.03 | 22d | 1 | 0.43mi |
| 1008 England St Huntington Beach, CA | 3.0 | 2.0 | 1200 | $4,500 | $3.75 | 1d | 1 | 0.44mi |
| 203 Frankfort Ave Huntington Beach, CA | 3.0 | 2.5 | 2053 | $6,950 | $3.39 | 17d | 1 | 0.45mi |
| 909 California St Huntington Beach, CA | 3.0 | 3.0 | 2072 | $6,000 | $2.90 | 20d | 1 | 0.47mi |
| 21040 Pacific City Cir Huntington Beach, CA | 1.0–3.0 | 1.0–2.5 | 1137 | $8,055 | $7.08 | 1d | 28 | 0.51mi |
| 8121 Foxhall Dr Huntington Beach, CA | 3.0 | 1.5 | 1296 | $4,950 | $3.82 | 1d | 1 | 0.52mi |
| 20301 Bluffside Cir Unit D110 Huntington Beach, CA | 2.0 | 2.0 | 1101 | $5,250 | $4.77 | 1d | 1 | 0.54mi |
| 414 Main St #210 Huntington Beach, CA | 2.0 | 2.5 | 1530 | $6,500 | $4.25 | 22d | 1 | 0.55mi |
| 8216 Foxhall Dr Huntington Beach, CA | 4.0 | 2.5 | 1482 | $5,195 | $3.51 | 2d | 1 | 0.57mi |
| 626 Lake St #54 Huntington Beach, CA | 3.0 | 3.0 | 1400 | $3,895 | $2.78 | 24d | 1 | 0.57mi |
| 781 Seadrift Dr Huntington Beach, CA | 4.0 | 2.5 | 2197 | $6,000 | $2.73 | 2d | 1 | 0.57mi |
| 227 1st St Unit 3 Huntington Beach, CA | 2.0 | 2.0 | 1050 | $7,000 | $6.67 | 18d | 1 | 0.58mi |
| 20321 Tidepool Cir Unit 105 Huntington Beach, CA | 2.0 | 2.0 | 1104 | $3,700 | $3.35 | 1d | 1 | 0.58mi |
| 610 Main St Huntington Beach, CA | 3.0 | 2.5 | 2083 | $6,500 | $3.12 | 1d | 1 | 0.59mi |
| 340 5th St Huntington Beach, CA | 2.0 | 2.5 | 2060 | $5,900 | $2.86 | 1d | 1 | 0.64mi |
| 8565 Trinity Cir Unit 821D Huntington Beach, CA | 2.0 | 2.0 | 1077 | $3,450 | $3.20 | 10d | 1 | 0.64mi |
| 8565 Trinity Cir Unit 821D Huntington Beach, CA | 2.0 | 2.0 | 1077 | $3,450 | $3.20 | 1d | 1 | 0.64mi |
| 8152 Mainsail Dr Unit 104 Huntington Beach, CA | 2.0 | 2.0 | 1149 | $3,600 | $3.13 | 24d | 1 | 0.65mi |
| 1318 Applecross Ln Huntington Beach, CA | 3.0 | 2.5 | 1588 | $4,400 | $2.77 | 12d | 1 | 0.65mi |
| 20191 Cape Coral Ln Unit 3-209 Huntington Beach, CA | 2.0 | 2.0 | 1059 | $3,200 | $3.02 | 3d | 1 | 0.65mi |
| 8211 Mainsail Dr #202 Huntington Beach, CA | 2.0 | 2.0 | 1149 | $3,500 | $3.05 | 24d | 1 | 0.66mi |
| 200 Pacific Coast Hwy Huntington Beach, CA | 2.0 | 2.0–2.5 | 1299 | $4,575 | $3.52 | 15d | 2 | 0.69mi |
| 200 Pacific Coast Hwy Huntington Beach, CA | 1.0–2.0 | 1.0–2.0 | 1064 | $4,900 | $4.61 | 1d | 2 | 0.69mi |
| 415 7th St Huntington Beach, CA | 3.0 | 2.5 | 2042 | $5,433 | $2.66 | 2d | 1 | 0.73mi |
| 1507 Backbay Cir Huntington Beach, CA | 2.0 | 2.0 | 1275 | $5,200 | $4.08 | 1d | 1 | 0.75mi |
| 608 Olive Ave Huntington Beach, CA | 3.0 | 2.0 | 1100 | $4,195 | $3.81 | 15d | 1 | 0.75mi |
| 408 8th St Huntington Beach, CA | 3.0 | 2.0 | 1545 | $5,500 | $3.56 | 1d | 1 | 0.77mi |
| 1315 Alabama St Huntington Beach, CA | 3.0 | 2.0 | 1236 | $7,500 | $6.07 | 1d | 1 | 0.77mi |
| 8777 Tulare Dr Unit 413d Huntington Beach, CA | 3.0 | 2.0 | 1287 | $3,900 | $3.03 | 1d | 1 | 0.78mi |
| 910 Acacia Ave Huntington Beach, CA | 3.0 | 2.0 | 1700 | $6,850 | $4.03 | 1d | 1 | 0.81mi |
| 1702 Florida St Huntington Beach, CA | 2.0–3.0 | 1.0–2.0 | 1022 | $3,000 | $2.93 | 1d | 1 | 0.87mi |
Listing history 12 events
-
2026-06-18days on market $274,999 Active 6 DOM
-
2026-06-17days on market $274,999 Active 5 DOM
-
2026-06-16days on market $274,999 Active 4 DOM
-
2026-06-15days on market $274,999 Active 3 DOM
-
2026-06-13pricedays on market $274,999 Active 1 DOM
-
2026-06-07days on market $299,000 Active 54 DOM
-
2026-06-04days on market $299,000 Active 51 DOM
-
2026-06-03days on market $299,000 Active 50 DOM
-
2026-06-02days on market $299,000 Active 49 DOM
-
2026-06-01days on market $299,000 Active 48 DOM
-
2026-05-31days on market $299,000 Active 47 DOM
-
2026-04-14$299,000 Active
ⓘ Source: listings_history table (triggers on properties + properties_extension) + one-shot
backfill from property_details.listing_events for pre-trigger history.
Tax reassessment forecast CA · Resets to sale price
- Current annual tax
- $860 · $72/mo
- Projected year-2 tax
- $2,090 · $174/mo
- Expected delta
- +$1,230/yr (+$102/mo · 142.9%)
ⓘ Screening estimate from a state-policy table — verify with the county assessor before closing.
Nearby sold comps map
Loading sold comps map…
Walkable amenities ~0.75 mi
Loading nearby amenities…
Taxation est. · year 1
- Rental income
- $59,454
- − Mortgage interest
- −$15,404
- − Property taxes
- −$860
- − Insurance
- −$1,375
- − Repairs & maintenance
- −$4,756
- − Management
- −$4,756
- − Depreciation
- −$8,000
- Taxable income
- $24,302
- Est. tax owed @ 24.0%
- −$5,832
- After-tax cash flow
- $21,595/yr
For passive investors: Depreciation is non-cash, so a rental often shows a tax loss while cash-flowing — sheltering income. Rental losses are passive: they offset passive income freely, and up to $25,000/yr can offset ordinary (W-2) income if you actively participate and your MAGI is under $100k (phasing out to $0 by $150k); unused losses carry forward. On sale, claimed depreciation is recaptured at up to 25%, and gains may owe capital-gains tax (a 1031 exchange can defer both). Figures are a year-1 estimate at your 24.0% rate — not tax advice; consult a CPA.
Schools (NCES district)
- District
- Huntington Beach Union High
- NCES district ID
- 0618060
- Math proficiency
- 65% ▲ 17.00%
- Reading proficiency
- 82% ▲ 8.00%
- Median HH income
- $78,159
- Composite
- 64.9/100
- National rank
- #511
- State rank
- #39 of 517 in CA
Livability — Huntington Beach
- Score
- 67/100
- State rank
- #306
- US rank
- #10298
Category grades
Schools grade is shown separately in the Schools card above.
Census & demographics
- Census place
- Huntington Beach, CA
- County
- Orange County · 3,096,323 people
- City population
- 194,835
- Metro
- Los Angeles-Long Beach-Anaheim, CA
- Population (ZIP)
- 45,827
- Household income
- $130,164
- Rent vs Own
- Severe rent burden
- 2957.0
Population outlook (Orange County) Hauer SSP2
- Today (2025)
- 3,477,456 people
- By 2030
- 3,613,117 · +3.9%
- By 2040
- 3,835,945 · +10.3%
- By 2050
- 3,968,736 · +14.1%
- By 2075
- 4,097,053 · +17.8%
- By 2100
- 3,903,633 · +12.3%
Race, ethnicity, and origin ACS 2023
- Neighborhood character
- Diverse neighborhood (Simpson 0.56)
- Race & ethnicity
- White 63% Hispanic / Latino 16% Two or more races 14% Asian 11%
- Hispanic origin (detail)
- Mexican 11%
- Common ancestry
- Slovak 3% Italian 3% Scotch-Irish 3%
- Foreign-born
- 14% · Canada, Vietnam, China
- Languages at home
- 80% English-only · Spanish 7% Vietnamese 3% Other Indo-European 3%
Political lean MEDSL · Orange
- 2024 margin
- Toss-up / Even · D 49.7% · R 47.1% · Other 3.2%
- 2008→2024 swing
- +5.2pp toward D · 2008: -2.6pp · 2024: 2.6pp
- All cycles
- 2024: D+2.6 2020: D+9.0 2016: D+7.7 2012: R+8.3 2008: R+2.6
Not yet ingested
- Civics
- —
Market trends
- HPI YoY
- ▼ -797.90%
- Current HPI
- 381.1587
- Rent YoY
- ▲ 2.78%
- Metro
- Los Angeles-Long Beach-Anaheim, CA
- State GDP YoY
- ▲ 3.21%
- F500 in state
- 116
Industry mix (Fortune 500 HQ in CA)
| Industry | F500 HQs | Revenue |
|---|---|---|
| Technology | 27 | $1,492B |
|
||
| Financial Services | 3 | $174B |
|
||
| Retail | 3 | $44B |
|
||
| Insurance | 3 | $26B |
|
||
| Media / Entertainment | 2 | $115B |
|
||
| Pharmaceuticals / Biotech | 2 | $62B |
|
||
Price history
1 event — show timeline
- 2026-04-14 Listed $299,000 CRMLS
Property tax history
-3.4%/yrLatest (2025): $860 · -0.3% YoY. Source: county tax records.
Cash-flow waterfall
monthlySold comps — $/sqft
last 12 mo · ≤1 miLoading sold comps…