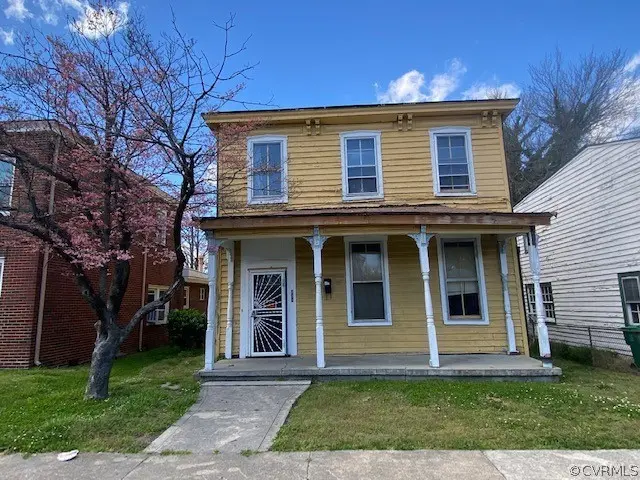
231 New St · Petersburg, VA
Flood risk 1/10 · Minimal
- FEMA flood zone
- X (unshaded)
- Chance of flooding over 30 yrs
- 0.0%
- Est. flood insurance / yr
- $507 – $1,088
Fire risk 1/10 · Minimal
- Est. fire insurance / yr
- $666 – $1,236
Heat risk 8/10 · Major
- Hot days now (above 109°F)
- 7 days/yr
- Hot days in 30 yrs
- 16 days/yr
Wind risk 6/10 · Moderate
- Chance of severe wind over 30 yrs
- 48.0%
Air-quality risk 2/10 · Minimal
- Unhealthy air days now
- 0 days/yr
- Unhealthy air days in 30 yrs
- 1 days/yr
Risk factors via First Street. Map © Google.
Why this score? — see what drove the B- grade
The composite is a weighted blend of 9 inputs, each scored 0–100. Each bar is that input's sub-score; the figure is the points it added to the 100-point composite (weight × sub-score).
- Cash flow +30.0/30.0
- 1% rule +10.0/10.0
- DSCR +10.0/10.0
- ARV discount +7.5/15.0
- Livability +3.1/5.0
- Schools +2.9/10.0
- Rent growth +2.5/5.0
- Condition / age +2.5/5.0
- Appreciation +0.0/10.0
$74,995
🖨 Deal sheet (PDF) 📄 Offer letter ✓ Due diligence
Listing remarks MLS
Good investment opportunity, property has a nice level lot, it could easily be used as a bedroom house and could make a great rental, lots of upside to this property.
Key facts
- 6,098 sq ft lot
- Built 1915
Neighborhood map
What this means for you Summary
Snapshot
- This is a 3-bed/1.0-bath single-family listed at $75k.
Deal economics
- At list price, monthly cash flow is $919 ($11k/yr) — positive.
- The deal already cash-flows at list — no discount required.
- Meets the 1% rule at list price ($2k rent vs $75k).
- Cap rate 21.0% vs local median 4.5% in Petersburg — top-decile yield for the area; either an underpriced asset or a hidden risk that comps aren't pricing in. Stress-test before assuming the spread holds.
Location & tenants
- Location reads 61/100 on livability (#413 in VA) — a middle-class / working-renter tenant base. Strengths: cost of living A+, housing A; Watch: crime F, amenities F, commute F.
- Petersburg City Public School District (suburban): math 26% / reading 44% proficiency, ranked #131 of 131 in VA (top 100%) — families likely to look elsewhere, expect single-tenant / working-renter base with shorter leases; 79% free/reduced lunch — lower-income household profile, screen leases tightly.
- Zoned schools: Cool Spring Elementary (math 17% / reading 32%, grade F, #1,051 of 1,108 statewide, top 96%, 530 students, 102% FRL); Vernon Johns Middle (math 21% / reading 47%, grade F, #330 of 342 statewide, top 96%, 921 students, 99% FRL); Petersburg High (math 43% / reading 62%, grade C-, #293 of 319 statewide, top 92%, 1,080 students, 97% FRL) — zoned schools average 99% FRL vs 79% district-wide (21 pts higher); higher-poverty schools than district average — tighter screening recommended.
- Market conditions: 118 active listings in the ZIP; 11 comparable units currently listed for rent nearby; rentals at typical pace (median 25d on market — plan ~3-4 weeks tenant-placement turnaround); 118 units permitted in Petersburg city in 2024 (84 in 5+ unit buildings).
- This rent runs 36% of the median local income ($61k/yr) — at the standard rent-burdened threshold; future hikes will face affordability resistance.
Forward outlook
- Local home prices are declining (-3.0%/yr); year-one equity from $518 of loan paydown is wiped out by about $2k of value loss. Plan a longer hold.
- Petersburg County population projected at -10% by 2050 — secular population decline; favor cash flow + early exit over multi-decade hold.
- At projected returns (-3.0% appreciation + 3.0% rent growth), your $21k cash investment doubles in ~3 years — after that, you're playing with house money.
Negotiation context
- Only 0 days on market — expect competitive offers; lowballing is unlikely to land.
- 2 sale attempts since 4y ago with the ask held roughly flat each time — persistent listings suggest the price (not the market) is what's stuck; bring a comps-based counter.
- Current owner paid $64k; 17% above their basis — modest negotiation headroom, anchor on the comps not their cost.
Risks & watch-outs
- Watch-outs: built in 1915 — expect roof / HVAC / electrical / plumbing capex.
- Climate carrying-cost: major wind risk, 48% chance of damaging wind over 30y; extreme-heat days projected 7→16/yr by 2055 (HVAC capex compounding) — expect insurance premiums to compound above CPI over the hold.
Questions for the listing agent
- Built in 1915 — when were the roof, HVAC, electrical panel, plumbing, and water heater last replaced?
- Is there a deadline driving the sale (1031 exchange, divorce, estate, relocation)? That informs how much negotiation room exists.
- Schools are D-rated, which usually means shorter tenancies and higher turnover. Who's the typical renter profile here, and what's been the actual vacancy rate?
- Crime grade is F in this area — have there been break-ins, vandalism, or insurance claims at this property in the last 3 years? What carrier currently insures it and at what premium?
- What's the average days-on-market for RENTAL listings here right now (not sales)? A rising rental-DOM trend means longer vacancies and softer asking-rent achievability than the comps imply.
- What's the recent tenant-quality profile in this submarket — average credit score on applications, eviction rate, late-payment / NSF rate, and stable-employment percentage? A property-management company in the area should have these aggregated.
- How much new for-sale + rental construction is in the pipeline within 1–3 miles? Heavy new supply typically softens prices + rents 12–24 months out; constrained supply supports both.
Investment metrics
- 1% rule
- 2.41% ✓
- Cap rate
- 21.00%
- Cash-on-cash
- 52.54%
- DSCR
- 3.34
- GRM
- 3.5
CMA / ARV
- ARV (on-the-fly)
- $301,440
- Comps found
- 12
Show comp detail 12 sales within ~0.75 mi
| Address | Dist | Beds/Ba | Sqft | Sold | Price | $/sf | Match |
|---|---|---|---|---|---|---|---|
| 307 Mistletoe St | 0.09mi | 4/3.5 (+1) | 1,860 (-3%) | 4mo | $285,000 | $153 | 72 |
| 409 Mistletoe St | 0.18mi | 4/3.5 (+1) | 1,960 (+2%) | 4mo | $290,000 | $148 | 70 |
| 731 Harding St | 0.16mi | 4/3.5 (+1) | 2,000 (+4%) | 3mo | $315,000 | $158 | 68 |
| 710 Harding St | 0.12mi | 4/3.5 (+1) | 2,000 (+4%) | 6mo | $314,900 | $157 | 68 |
| 913 Diamond St | 0.28mi | 4/3.0 (+1) | 1,860 (-3%) | 2mo | $309,999 | $167 | 67 |
| 1001 Saint James St | 0.41mi | 4/3.5 (+1) | 1,840 (-4%) | 2mo | $297,000 | $161 | 58 |
| 546 Clinton St | 0.46mi | 4/2.0 (+1) | 1,782 (-7%) | 2mo | $305,000 | $171 | 56 |
| 403 St Matthew St | 0.26mi | 4/3.5 (+1) | 2,116 (+10%) | 6mo | $314,999 | $149 | 51 |
| 688 Pegram St | 0.60mi | 3/1.0 | 1,665 (-13%) | 3mo | $95,000 | $57 | 47 |
| 1103 Halifax St | 0.59mi | 4/3.5 (+1) | 2,000 (+4%) | 4mo | $325,000 | $163 | 47 |
| 1120 Halifax St | 0.63mi | 4/2.0 (+1) | 1,785 (-7%) | 6mo | $265,000 | $148 | 45 |
| 303 Webster St | 0.64mi | 4/2.5 (+1) | 2,104 (+10%) | 6mo | $310,000 | $147 | 38 |
Match score weights: distance 35% · size 25% · config 20% · recency 20%. Top-matched comps best support the ARV.
Projected returns pro-forma
-3.0% appreciation · 3.0% rent growth · sell at horizon
- IRR
- 50.5%
- Equity multiple
- 3.21×
- Total profit
- $46,422
- Equity at exit
- $11,182
- IRR
- 56.0%
- Equity multiple
- 6.52×
- Total profit
- $115,901
- Equity at exit
- $6,484
Cash invested: $20,999 (down + closing). Projections, not guarantees.
Landlord ↔ Tenant lean methodology
- Overall (STATE)
- 55 Moderately Landlord-Leaning
- State Virginia
- 55 Moderately Landlord-Leaning · D+2
- County
- — inherits STATE
- City
- — inherits STATE
ZIP-level market 23805
- Home prices YoY
- -10.6%
- Active inventory
- 118
- Price-to-rent
- 3.5×
Monthly cashflow live
- Estimated rent
- $1,804 high interval (Pro) →
- Mortgage (P&I)
- −$393
- Tax from tax record
- −$81 /mo · $975/yr
- Insurance
- −$31
- HOA
- −$0
- Vacancy / Maint / Mgmt
- −$379
- Net cashflow
- $919
Break-even live
Sensitivity live
| Price | -10% $962 | -5% $941 | +0% $919 | +5% $898 | +10% $877 |
|---|---|---|---|---|---|
| Rent | -10% $777 | -5% $848 | +0% $919 | +5% $991 | +10% $1,062 |
| Rate | -1.0pp $957 | -0.5pp $938 | base $919 | +0.5pp $900 | +1.0pp $880 |
UW: 25.0% down · 7.5% · 30yr · 1.5% tax · 5.0% vac · 8.0% maint · 8.0% mgmt
Financing live
Cash to close
- Down payment
- $18,749
- Closing costs
- $2,250
- Reserves months
- —
- Total cash needed
- —
Loan-product check · same deal, 3 products live
Conventional
25% down · 7.5% · 30yr
- Down + closing
- —
- Monthly P&I
- —
- Monthly cashflow
- —
- DSCR
- —
- Eligible?
- —
Personal DTI + credit; lowest rate.
DSCR
20% down · 8.5% · 30yr
- Down + closing
- —
- Monthly P&I
- —
- Monthly cashflow
- —
- DSCR
- —
- Eligible?
- —
No personal income docs; deal must DSCR.
Hard money
10% down · 12.0% · 12mo
- Down + closing
- —
- Monthly P&I
- —
- Monthly cashflow
- —
- DSCR
- —
- Eligible?
- —
Short-term bridge; refi at stabilization.
Rent comps 11 comps
| Address | Beds | Baths | Sqft | Rent | $/sqft | DOM | Units | Dist |
|---|---|---|---|---|---|---|---|---|
| 838 S Jones St Unit B Petersburg, VA | 2.0 | 1.0 | 1296 | $1,100 | $0.85 | 45d | 1 | 0.42mi |
| 616 S Jefferson St Petersburg, VA | 3.0 | 2.0 | 2400 | $1,957 | $0.82 | 4d | 1 | 0.42mi |
| 331 Glenwood Ct Petersburg, VA | 4.0 | 1.0 | 1242 | $1,800 | $1.45 | 4d | 1 | 0.58mi |
| 115 Pine St Unit 115 Petersburg, VA | 3.0 | 1.5 | 1400 | $1,462 | $1.04 | 45d | 1 | 0.58mi |
| 212 E Wythe St Unit 1 Petersburg, VA | 4.0 | 1.5 | 1400 | $1,295 | $0.93 | 25d | 1 | 0.71mi |
| 212 E Wythe St Unit 1 Petersburg, VA | 4.0 | 1.5 | 1400 | $1,295 | $0.93 | 45d | 1 | 0.71mi |
| 1137 Willcox St Petersburg, VA | 4.0 | 3.0 | 1872 | $2,600 | $1.39 | 45d | 1 | 0.84mi |
| 462 Reservoir Hts Petersburg, VA | 4.0 | 2.0 | 1640 | $1,895 | $1.16 | 25d | 1 | 0.94mi |
| 531 N Azalea Rd Petersburg, VA | 3.0 | 2.0 | 1600 | $1,595 | $1.00 | 25d | 1 | 0.95mi |
| 335 Claremont St Petersburg, VA | 4.0 | 2.0 | 2157 | $2,500 | $1.16 | 13d | 1 | 1.17mi |
| 1806 Powhatan Ave Petersburg, VA | 4.0 | 2.0 | 1878 | $2,495 | $1.33 | 4d | 1 | 1.24mi |
Listing history 6 events
-
2022-05-12soldstatus $64,000
-
2022-05-10soldstatus $64,000 Closed 166-char remark
Show marketing remark (166 chars)
Good investment opportunity, property has a nice level lot, it could easily be used as a bedroom house and could make a great rental, lots of upside to this property.
-
2022-04-26status Pending
Show marketing remark (166 chars)
Good investment opportunity, property has a nice level lot, it could easily be used as a bedroom house and could make a great rental, lots of upside to this property.
-
2022-04-26status Pending 166-char remark
Show marketing remark (166 chars)
Good investment opportunity, property has a nice level lot, it could easily be used as a bedroom house and could make a great rental, lots of upside to this property.
-
2022-04-22$74,995 Active 166-char remark
Show marketing remark (166 chars)
Good investment opportunity, property has a nice level lot, it could easily be used as a bedroom house and could make a great rental, lots of upside to this property.
-
2022-04-18$74,995 Active
ⓘ Source: listings_history table (triggers on properties + properties_extension) + one-shot
backfill from property_details.listing_events for pre-trigger history.
Tax reassessment forecast VA · Resets to sale price
- Current annual tax
- $975 · $81/mo
- Projected year-2 tax
- $975 · $81/mo
- Expected delta
- $0/yr ($0/mo · 0.0%)
ⓘ Screening estimate from a state-policy table — verify with the county assessor before closing.
Climate risk First Street
- Flood 1/10 Low FEMA zone X (unshaded) · 0% chance over 30 yrs
- Wildfire 1/10 Low
- Heat 8/10 Severe 7 d/yr ≥109°F today · 16 d/yr by 30 yrs out
- Wind 6/10 Major 48% chance of damaging wind over 30 yrs
- Air quality 2/10 Low 0 unhealthy d/yr today · 1 by 30 yrs out
Nearby sold comps map
Loading sold comps map…
Walkable amenities ~0.75 mi
Loading nearby amenities…
Taxation est. · year 1
- Rental income
- $21,648
- − Mortgage interest
- −$4,201
- − Property taxes
- −$975
- − Insurance
- −$375
- − Repairs & maintenance
- −$1,732
- − Management
- −$1,732
- − Depreciation
- −$2,182
- Taxable income
- $10,452
- Est. tax owed @ 24.0%
- −$2,508
- After-tax cash flow
- $8,524/yr
For passive investors: Depreciation is non-cash, so a rental often shows a tax loss while cash-flowing — sheltering income. Rental losses are passive: they offset passive income freely, and up to $25,000/yr can offset ordinary (W-2) income if you actively participate and your MAGI is under $100k (phasing out to $0 by $150k); unused losses carry forward. On sale, claimed depreciation is recaptured at up to 25%, and gains may owe capital-gains tax (a 1031 exchange can defer both). Figures are a year-1 estimate at your 24.0% rate — not tax advice; consult a CPA.
Schools (NCES district)
- District
- Petersburg City Public School District
- NCES district ID
- 5102910
- Math proficiency
- 26% ▼ -27.00%
- Reading proficiency
- 44% ▼ -8.00%
- Median HH income
- $34,362
- Composite
- 28.78/100
- National rank
- #6670
- State rank
- #131 of 131 in VA
Livability — Petersburg
- Score
- 61/100
- State rank
- #413
- US rank
- #17309
Category grades
Schools grade is shown separately in the Schools card above.
Census & demographics
- Census place
- Petersburg, VA
- County
- Petersburg City · 21,408 people
- City population
- 63,420
- Metro
- Richmond, VA
- Population (ZIP)
- 21,408
- Household income
- $60,807
- Rent vs Own
- Severe rent burden
- 719.0
Population outlook (Petersburg County) Hauer SSP2
- Today (2025)
- 30,488 people
- By 2030
- 29,771 · -2.4%
- By 2040
- 28,401 · -6.8%
- By 2050
- 27,279 · -10.5%
- By 2075
- 25,877 · -15.1%
- By 2100
- 24,288 · -20.3%
Race, ethnicity, and origin ACS 2023
- Neighborhood character
- Diverse neighborhood (Simpson 0.56)
- Race & ethnicity
- Black 58% White 32% Hispanic / Latino 5% Two or more races 4% Asian 2%
- Common ancestry
- Italian 2% Lithuanian 1% Hungarian 1%
- Foreign-born
- 4% · Canada, Vietnam, South Korea
- Languages at home
- 94% English-only · Spanish 3%
Political lean MEDSL · Petersburg
- 2024 margin
- Solid D (+72.8) · D 85.8% · R 13.0% · Other 1.2%
- 2008→2024 swing
- -5.7pp toward R · 2008: 78.5pp · 2024: 72.8pp
- All cycles
- 2024: D+72.8 2020: D+76.5 2016: D+77.0 2012: D+80.4 2008: D+78.5
Not yet ingested
- Civics
- —
Market trends
- HPI YoY
- ▼ -50.37%
- Current HPI
- 426.599
- Rent YoY
- —
- Metro
- Richmond, VA
- State GDP YoY
- ▲ 2.40%
- F500 in state
- 50
Industry mix (Fortune 500 HQ in VA)
| Industry | F500 HQs | Revenue |
|---|---|---|
| Aerospace / Defense | 4 | $236B |
|
||
| Technology / Defense | 3 | $32B |
|
||
| Financial Services | 2 | $176B |
|
||
| Utilities | 2 | $27B |
|
||
| Insurance | 2 | $25B |
|
||
| Technology | 2 | $15B |
|
||
Price history
-14.7% since first listed6 events — show timeline
- 2022-05-12 Sold (Public Records) $64,000 Public Records
- 2022-05-10 Sold (MLS) $64,000 CVRMLS
- 2022-04-26 Pending — MLSRV
- 2022-04-26 Pending — CVRMLS
- 2022-04-22 Listed $74,995 CVRMLS
- 2022-04-18 Listed $74,995 MLSRV
Property tax history
+5.5%/yrLatest (2025): $975 · +102.1% YoY. Source: county tax records.
Cash-flow waterfall
monthlySold comps — $/sqft
last 12 mo · ≤1 miLoading sold comps…