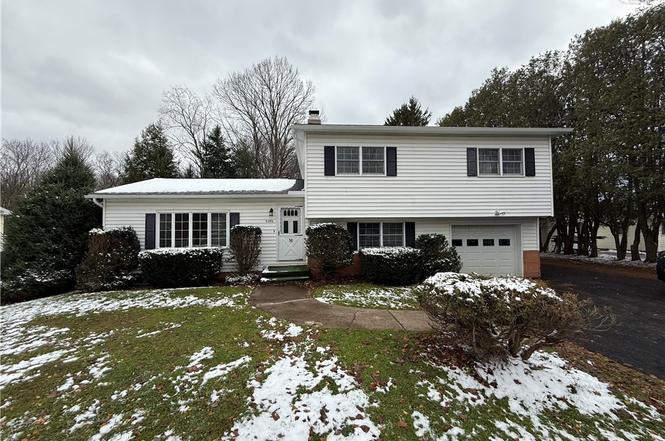
6086 Cavanuaugh Rd E · Marcy, NY
Flood risk 1/10 · Minimal
- FEMA flood zone
- X (unshaded)
- Chance of flooding over 30 yrs
- 0.0%
- Est. flood insurance / yr
- $473 – $860
Fire risk 1/10 · Minimal
- Est. fire insurance / yr
- $691 – $1,283
Heat risk 2/10 · Minimal
- Hot days now (above 95°F)
- 7 days/yr
- Hot days in 30 yrs
- 15 days/yr
Wind risk 2/10 · Minimal
- Chance of severe wind over 30 yrs
- 1.0%
Air-quality risk 2/10 · Minimal
- Unhealthy air days now
- 0 days/yr
- Unhealthy air days in 30 yrs
- 2 days/yr
Risk factors via First Street. Map © Google.
Why this score? — see what drove the D grade
The composite is a weighted blend of 9 inputs, each scored 0–100. Each bar is that input's sub-score; the figure is the points it added to the 100-point composite (weight × sub-score).
- Appreciation +10.0/10.0
- ARV discount +7.5/15.0
- Cash flow +6.7/30.0
- Schools +5.6/10.0
- Rent growth +2.5/5.0
- Livability +2.5/5.0
- Condition / age +2.5/5.0
- 1% rule +2.2/10.0
- DSCR +0.9/10.0
$232,000
🖨 Deal sheet 📄 Offer letter ✓ Due diligence
Listing remarks
Charming Tri-Level Home in the Town of Marcy offering 3 bedrooms and 2.5 baths, perfectly situated in the desirable town of Marcy. Set on an impressive piece of property, this home offers both comfort and convenience, with ample space for enjoying indoor and outdoor living. Recent updates include a new roof, new driveway, some updated windows a new furnace. The home’s versatile layout features spacious living areas and an abundance of natural light throughout. Located just minutes from Whitesboro Schools, restaurants, shopping, and major expressways, this property combines a private setting with easy access to everything you need.
Key facts
- New furnace
- Easy access
- Updated windows
Tags
Neighborhood map
What this means for you Summary
Snapshot
- This is a 3-bed/1.5-bath single-family listed at $232k.
Deal economics
- At list price, monthly cash flow is $-376 ($-5k/yr) — negative.
- To cash-flow at today's rent, offer at most $166k (28.6% below list).
- To meet the 1% rule (rent ≥ 1% of price), the offer needs to be $167k (28.2% below list).
- Recommended offer: $166k (28.6% below list) — sets the bar for cash-flow.
Location & tenants
- Location reads: area grade D — affects rentability + tenant quality, not the cash-flow math above.
- Whitesboro Central School District (suburban): math 68% / reading 61% proficiency, ranked #174 of 590 in NY (top 30%) — acceptable for families but not a draw, mixed tenant base, ~2y average lease.
- Market conditions: 23 active listings in the ZIP; 204 units permitted in Oneida County in 2024 (68 in 5+ unit buildings).
Forward outlook
- In year one you build about $25k of equity ($2k loan paydown + $23k appreciation (10.0% local appreciation)).
- Oneida County population projected at -12% by 2050 — secular population decline; favor cash flow + early exit over multi-decade hold.
- By year 2, paydown + projected appreciation supports a ~$40k cash-out refi (75% LTV) — recoverable capital for the next deal without selling this one.
Negotiation context
- It's been on market 110 days — a 9% lower offer ($211k) is reasonable based on typical stale-listing flexibility.
- 2 sale attempts; this cycle's ask has dropped $68k (23%) from the opening price — seller is motivated, your offer sets the floor, not the list.
Questions for the listing agent
- What do current leases actually rent for vs. the listed asking? Can we see a recent rent roll and the last 12 months of T-12 income?
- It's been on market 110 days. Have you received any prior offers? Is the seller open to a 29% concession, seller financing, or rate buy-down credit?
- Built in 1978 — when were the roof, HVAC, electrical panel, plumbing, and water heater last replaced?
- Why hasn't it sold? Are there any deal-killer items the seller is aware of (foundation, flood, title, zoning, code violations)?
- Is there a deadline driving the sale (1031 exchange, divorce, estate, relocation)? That informs how much negotiation room exists.
- The area grade is low — what's the realistic commute time and amenity access for the typical tenant pool here? Any planned neighborhood developments (good or bad) we should know about?
- What's the average days-on-market for RENTAL listings here right now (not sales)? A rising rental-DOM trend means longer vacancies and softer asking-rent achievability than the comps imply.
- What's the recent tenant-quality profile in this submarket — average credit score on applications, eviction rate, late-payment / NSF rate, and stable-employment percentage? A property-management company in the area should have these aggregated.
- How much new for-sale + rental construction is in the pipeline within 1–3 miles? Heavy new supply typically softens prices + rents 12–24 months out; constrained supply supports both.
Investment metrics
- 1% rule
- 0.72% ✗
- Cap rate
- 4.35%
- Cash-on-cash
- -6.94%
- DSCR
- 0.69
- GRM
- 11.6
CMA / ARV
No comps found within radius.
Projected returns pro-forma
10.0% appreciation · 3.0% rent growth · sell at horizon
- IRR
- 19.4%
- Equity multiple
- 2.58×
- Total profit
- $102,513
- Equity at exit
- $209,004
- IRR
- 17.9%
- Equity multiple
- 5.94×
- Total profit
- $320,851
- Equity at exit
- $450,725
Cash invested: $64,960 (down + closing). Projections, not guarantees.
Landlord ↔ Tenant lean methodology
- Overall (STATE)
- 15 Strongly Tenant-Friendly
- State New York
- 15 Strongly Tenant-Friendly · D+10
- County
- — inherits STATE
- City
- — inherits STATE
ZIP-level market 13403
- Home prices YoY
- 21.3%
- Active inventory
- 23
- Price-to-rent
- 11.6×
Monthly cashflow live
- Estimated rent
- $1,666 medium interval (Pro) →
- Mortgage (P&I)
- −$1,217
- Tax from tax record
- −$378 /mo · $4,541/yr
- Insurance
- −$97
- HOA
- −$0
- Vacancy / Maint / Mgmt
- −$350
- Net cashflow
- $-376
Break-even live
UW: 25.0% down · 7.5% · 30yr · 1.5% tax · 5.0% vac · 8.0% maint · 8.0% mgmt
Financing live
Cash to close
- Down payment
- $58,000
- Closing costs
- $6,960
- Reserves months
- —
- Total cash needed
- —
Loan-product check · same deal, 3 products live
Conventional
25% down · 7.5% · 30yr
- Down + closing
- —
- Monthly P&I
- —
- Monthly cashflow
- —
- DSCR
- —
- Eligible?
- —
Personal DTI + credit; lowest rate.
DSCR
20% down · 8.5% · 30yr
- Down + closing
- —
- Monthly P&I
- —
- Monthly cashflow
- —
- DSCR
- —
- Eligible?
- —
No personal income docs; deal must DSCR.
Hard money
10% down · 12.0% · 12mo
- Down + closing
- —
- Monthly P&I
- —
- Monthly cashflow
- —
- DSCR
- —
- Eligible?
- —
Short-term bridge; refi at stabilization.
Listing history 6 events
-
2026-03-10status Pending
-
2026-02-24price $232,000
-
2026-02-24status Active
-
2025-12-11historical Active Under Contract
-
2025-11-29price $264,900
-
2025-11-14$299,900 Active
ⓘ Source: listings_history table (triggers on properties + properties_extension) + one-shot
backfill from property_details.listing_events for pre-trigger history.
Tax reassessment forecast NY · Partial reset (capped growth)
- Current annual tax
- $4,541 · $378/mo
- Projected year-2 tax
- $4,541 · $378/mo
- Expected delta
- $0/yr ($0/mo · 0.0%)
ⓘ Screening estimate from a state-policy table — verify with the county assessor before closing.
Climate risk First Street
- Flood 1/10 Low FEMA zone X (unshaded) · 0% chance over 30 yrs
- Wildfire 1/10 Low
- Heat 2/10 Low 7 d/yr ≥95°F today · 15 d/yr by 30 yrs out
- Wind 2/10 Low 100% chance of damaging wind over 30 yrs
- Air quality 2/10 Low 0 unhealthy d/yr today · 2 by 30 yrs out
Nearby sold comps map
Loading sold comps map…
Walkable amenities ~0.75 mi
Loading nearby amenities…
Taxation est. · year 1
- Rental income
- $19,992
- − Mortgage interest
- −$12,996
- − Property taxes
- −$4,541
- − Insurance
- −$1,160
- − Repairs & maintenance
- −$1,599
- − Management
- −$1,599
- − Depreciation
- −$6,749
- Taxable loss
- −$8,652
- Est. tax savings @ 24.0%
- +$2,077
- After-tax cash flow
- $-2,430/yr
For passive investors: Depreciation is non-cash, so a rental often shows a tax loss while cash-flowing — sheltering income. Rental losses are passive: they offset passive income freely, and up to $25,000/yr can offset ordinary (W-2) income if you actively participate and your MAGI is under $100k (phasing out to $0 by $150k); unused losses carry forward. On sale, claimed depreciation is recaptured at up to 25%, and gains may owe capital-gains tax (a 1031 exchange can defer both). Figures are a year-1 estimate at your 24.0% rate — not tax advice; consult a CPA.
Schools (NCES district)
- District
- Whitesboro Central School District
- NCES district ID
- 3631320
- Math proficiency
- 68% ▼ -7.00%
- Reading proficiency
- 61% ▼ -2.00%
- Median HH income
- $59,732
- Composite
- 55.77/100
- National rank
- #1217
- State rank
- #174 of 590 in NY
Livability — Marcy
No livability data for this city. (Only ~50 U.S. cities are tracked.)
Census & demographics
- Population (ZIP)
- 7,133
Population outlook (Oneida County) Hauer SSP2
- Today (2025)
- 225,223 people
- By 2030
- 220,384 · -2.1%
- By 2040
- 209,071 · -7.2%
- By 2050
- 197,920 · -12.1%
- By 2075
- 175,541 · -22.1%
- By 2100
- 148,491 · -34.1%
Race, ethnicity, and origin ACS 2023
- Neighborhood character
- Predominantly White (80%)
- Race & ethnicity
- White 80% Black 11% Hispanic / Latino 7% Two or more races 2% Asian 1%
- Hispanic origin (detail)
- Puerto Rican 1%
- Common ancestry
- Romanian 24% Lithuanian 3% Slovak 1%
- Foreign-born
- 5% · Canada
- Languages at home
- 90% English-only · Spanish 4% Russian/Polish/Slavic 4% Other Asian/Pacific 1%
Political lean MEDSL · Oneida
- 2024 margin
- Strong R (+21.3) · D 39.4% · R 60.6%
- 2008→2024 swing
- -15.2pp toward R · 2008: -6.1pp · 2024: -21.3pp
- All cycles
- 2024: R+21.3 2020: R+15.5 2016: R+21.1 2012: R+5.3 2008: R+6.1
Not yet ingested
- Civics
- —
Market trends
- HPI YoY
- ▲ 54.39%
- Current HPI
- 309.4119
- Rent YoY
- —
- Metro
- —
- State GDP YoY
- ▲ 2.60%
- F500 in state
- 92
Industry mix (Fortune 500 HQ in NY)
| Industry | F500 HQs | Revenue |
|---|---|---|
| Financial Services | 10 | $950B |
|
||
| Consumer Goods | 9 | $162B |
|
||
| Insurance | 4 | $225B |
|
||
| Telecommunications | 2 | $144B |
|
||
| Pharmaceuticals | 2 | $112B |
|
||
| Media / Entertainment | 2 | $69B |
|
||
Price history
-22.6% since first listed6 events — show timeline
- 2026-03-10 Pending — CNYIS
- 2026-02-24 Price Changed $232,000 CNYIS
- 2026-02-24 Relisted — CNYIS
- 2025-12-11 Contingent — CNYIS
- 2025-11-29 Price Changed $264,900 CNYIS
- 2025-11-14 Listed $299,900 CNYIS
Property tax history
+4.1%/yrLatest (2025): $4,541 · +4.0% YoY. Source: county tax records.
Cash-flow waterfall
monthlySold comps — $/sqft
last 12 mo · ≤1 miLoading sold comps…