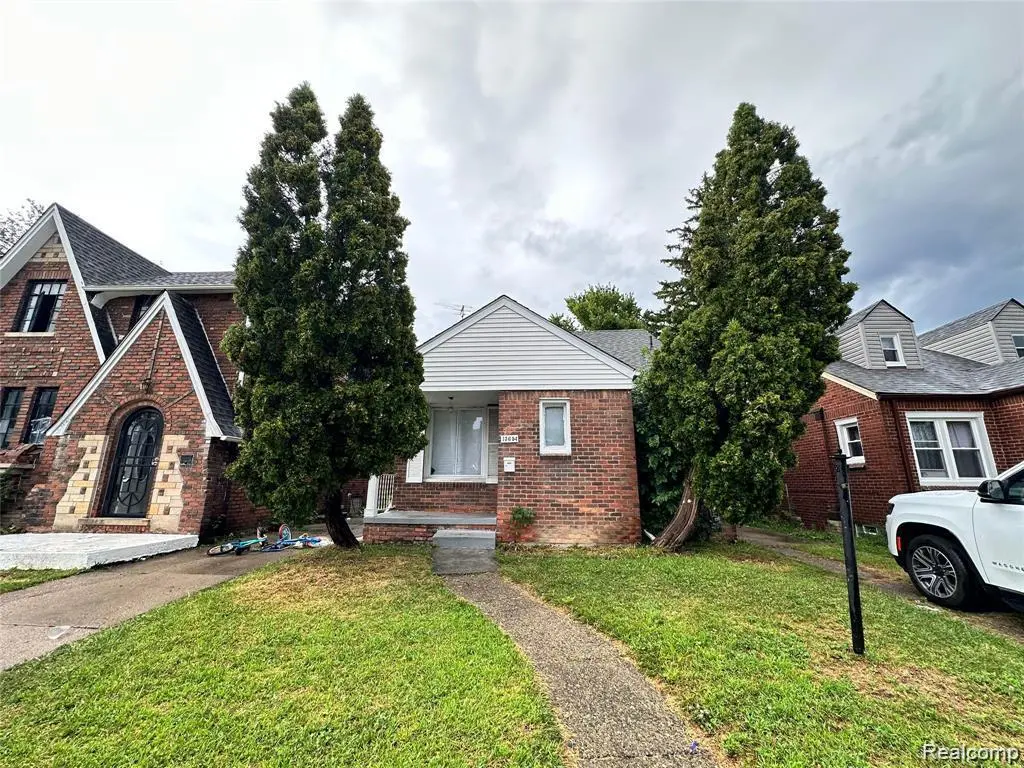
13654 Mecca St · Detroit, MI
Flood risk 1/10 · Minimal
- FEMA flood zone
- X (unshaded)
- Chance of flooding over 30 yrs
- 0.0%
- Est. flood insurance / yr
- $473 – $860
Fire risk 1/10 · Minimal
- Est. fire insurance / yr
- $784 – $1,456
Heat risk 3/10 · Minor
- Hot days now (above 97°F)
- 7 days/yr
- Hot days in 30 yrs
- 15 days/yr
Wind risk 2/10 · Minimal
- Chance of severe wind over 30 yrs
- —
Air-quality risk 3/10 · Minor
- Unhealthy air days now
- 2 days/yr
- Unhealthy air days in 30 yrs
- 5 days/yr
Risk factors via First Street. Map © Google.
Why this score? — see what drove the B- grade
The composite is a weighted blend of 9 inputs, each scored 0–100. Each bar is that input's sub-score; the figure is the points it added to the 100-point composite (weight × sub-score).
- Cash flow +30.0/30.0
- 1% rule +10.0/10.0
- DSCR +10.0/10.0
- ARV discount +7.5/15.0
- Rent growth +3.9/5.0
- Livability +3.7/5.0
- Condition / age +2.5/5.0
- Schools +1.3/10.0
- Appreciation +0.0/10.0
$79,000
🖨 Deal sheet 📄 Offer letter ✓ Due diligence
Listing remarks MLS
Attention investors, don't miss this excellent investment opportunity!! This solid Detroit brick bungalow is ideal for investors to expand their portfolio. Tenant is paying $1,150 a month, MTM lease. Conveniently located with easy access from I-96 and M-39 freeways. Schedule your showing today!!! PLEASE DO NOT DISTURB TENANTS. B. A. T. V. A. I. All measurements are estimated.
Key facts
- 3,485 sq ft lot
- 2 garage spots
- Built 1955
Tags
Neighborhood map
What this means for you Summary
Snapshot
- This is a 3-bed/1.0-bath single-family listed at $79k.
Deal economics
- At list price, monthly cash flow is $530 ($6k/yr) — positive.
- The deal already cash-flows at list — no discount required.
- Meets the 1% rule at list price ($1k rent vs $79k).
- Recommended offer: $70k (12.0% below list) — sets the bar for market timing.
- Cap rate 14.3% vs local median 10.2% in Detroit — top-decile yield for the area; either an underpriced asset or a hidden risk that comps aren't pricing in. Stress-test before assuming the spread holds.
Location & tenants
- Location reads 73/100 on livability (#218 in MI) — a middle-class / working-renter tenant base. Strengths: amenities A+, commute A+, cost of living A+; Watch: schools F, crime F, employment F.
- Detroit Public Schools Community District (urban): math 10% / reading 24% proficiency, ranked #499 of 540 in MI (top 92%) — low school quality limits family demand, transient renter base, plan for 1-2y turnover; 90% free/reduced lunch — lower-income household profile, screen leases tightly.
- Market conditions: Rents rising fast (+5.6%/yr); 385 active listings in the ZIP; 40 comparable units currently listed for rent nearby; rentals lingering (median 44d on market — plan ~5-8 weeks vacancy on turnover, expect pricing pressure); 50% of comp listings sitting > 30 days — soft ceiling on asking rent; lower-income renter base — watch delinquency; 2,639 units permitted in Wayne County in 2024 (1,216 in 5+ unit buildings).
- This rent runs 43% of the median local income ($37k/yr) — at the standard rent-burdened threshold; future hikes will face affordability resistance.
Forward outlook
- Local home prices are declining (-3.0%/yr); year-one equity from $546 of loan paydown is wiped out by about $2k of value loss. Plan a longer hold.
- Wayne County population projected at -17% by 2050 — secular population decline; favor cash flow + early exit over multi-decade hold.
- At projected returns (-3.0% appreciation + 5.6% rent growth), your $22k cash investment doubles in ~4 years — after that, you're playing with house money.
Negotiation context
- It's been on market 136 days — a 12% lower offer ($70k) is reasonable based on typical stale-listing flexibility.
- 6 sale attempts since 14y ago with the ask held roughly flat each time — persistent listings suggest the price (not the market) is what's stuck; bring a comps-based counter.
- Current owner paid $48k; list at $79k implies a 63% gain — meaningful room to come down on a strong offer.
Risks & watch-outs
- Watch-outs: built in 1955 — expect roof / HVAC / electrical / plumbing capex.
Questions for the listing agent
- It's been on market 136 days. Have you received any prior offers? Is the seller open to a 12% concession, seller financing, or rate buy-down credit?
- Built in 1955 — when were the roof, HVAC, electrical panel, plumbing, and water heater last replaced?
- Why hasn't it sold? Are there any deal-killer items the seller is aware of (foundation, flood, title, zoning, code violations)?
- Is there a deadline driving the sale (1031 exchange, divorce, estate, relocation)? That informs how much negotiation room exists.
- Schools are F-rated, which usually means shorter tenancies and higher turnover. Who's the typical renter profile here, and what's been the actual vacancy rate?
- Crime grade is F in this area — have there been break-ins, vandalism, or insurance claims at this property in the last 3 years? What carrier currently insures it and at what premium?
- What's the average days-on-market for RENTAL listings here right now (not sales)? A rising rental-DOM trend means longer vacancies and softer asking-rent achievability than the comps imply.
- What's the recent tenant-quality profile in this submarket — average credit score on applications, eviction rate, late-payment / NSF rate, and stable-employment percentage? A property-management company in the area should have these aggregated.
- How much new for-sale + rental construction is in the pipeline within 1–3 miles? Heavy new supply typically softens prices + rents 12–24 months out; constrained supply supports both.
Investment metrics
- 1% rule
- 1.66% ✓
- Cap rate
- 14.34%
- Cash-on-cash
- 28.76%
- DSCR
- 2.28
- GRM
- 5.0
CMA / ARV
- ARV (median comp)
- $51,748
- List price
- $79,000
- Delta
- 52.66%
- Verdict
- OVERPRICED
- Comps
- 20 within 1.0 mi
Show comp detail 12 sales within ~0.75 mi
| Address | Dist | Beds/Ba | Sqft | Sold | Price | $/sf | Match |
|---|---|---|---|---|---|---|---|
| 9982 Littlefield St | 0.37mi | 3/1.0 | 1,152 (0%) | 8mo | $47,000 | $41 | 76 |
| 13737 Wadsworth St | 0.11mi | 3/1.0 | 1,060 (-8%) | 9mo | $45,000 | $42 | 74 |
| 11431 Marlowe St | 0.52mi | 3/1.0 | 1,172 (+2%) | 6mo | $48,000 | $41 | 68 |
| 11366 Terry St | 0.62mi | 3/1.0 | 1,209 (+5%) | 7mo | $89,000 | $74 | 57 |
| 12096 Meyers Rd | 0.62mi | 3/1.0 | 1,248 (+8%) | 0mo | $30,000 | $24 | 57 |
| 12026 Manor Arc | 0.65mi | 3/1.0 | 1,200 (+4%) | 8mo | $65,000 | $54 | 56 |
| 12096 Lauder St | 0.56mi | 3/1.0 | 1,044 (-9%) | 8mo | $55,000 | $53 | 51 |
| 11406 Strathmoor St | 0.38mi | 4/2.5 (+1) | 1,294 (+12%) | 1mo | $76,000 | $59 | 50 |
| 12667 Sorrento St | 0.62mi | 3/1.0 | 1,309 (+14%) | 0mo | $65,000 | $50 | 48 |
| 11437 Manor St | 0.62mi | 3/1.0 | 1,006 (-13%) | 5mo | $53,900 | $54 | 46 |
| 12047 Coyle St | 0.74mi | 3/1.0 | 1,052 (-9%) | 9mo | $60,000 | $57 | 44 |
| 9576 Hubbell St | 0.65mi | 3/2.0 | 1,270 (+10%) | 6mo | $134,900 | $106 | 44 |
Match score weights: distance 35% · size 25% · config 20% · recency 20%. Top-matched comps best support the ARV.
Projected returns pro-forma
-3.0% appreciation · 5.59% rent growth · sell at horizon
- IRR
- 25.9%
- Equity multiple
- 2.11×
- Total profit
- $24,457
- Equity at exit
- $11,779
- IRR
- 35.0%
- Equity multiple
- 4.61×
- Total profit
- $79,904
- Equity at exit
- $6,830
Cash invested: $22,120 (down + closing). Projections, not guarantees.
Landlord ↔ Tenant lean methodology
- Overall (STATE)
- 62 Landlord-Friendly
- State Michigan
- 62 Landlord-Friendly · EVEN
- County
- — inherits STATE
- City
- — inherits STATE
ZIP-level market 48227
- Rents YoY
- 5.6%
- Active inventory
- 385
- Price-to-rent
- 5.0×
Monthly cashflow live
- Estimated rent
- $1,310 high interval (Pro) →
- Mortgage (P&I)
- −$414
- Tax from tax record
- −$58 /mo · $694/yr
- Insurance
- −$33
- HOA
- −$0
- Vacancy / Maint / Mgmt
- −$275
- Net cashflow
- $530
Break-even live
UW: 25.0% down · 7.5% · 30yr · 1.5% tax · 5.0% vac · 8.0% maint · 8.0% mgmt
Financing live
Cash to close
- Down payment
- $19,750
- Closing costs
- $2,370
- Reserves months
- —
- Total cash needed
- —
Loan-product check · same deal, 3 products live
Conventional
25% down · 7.5% · 30yr
- Down + closing
- —
- Monthly P&I
- —
- Monthly cashflow
- —
- DSCR
- —
- Eligible?
- —
Personal DTI + credit; lowest rate.
DSCR
20% down · 8.5% · 30yr
- Down + closing
- —
- Monthly P&I
- —
- Monthly cashflow
- —
- DSCR
- —
- Eligible?
- —
No personal income docs; deal must DSCR.
Hard money
10% down · 12.0% · 12mo
- Down + closing
- —
- Monthly P&I
- —
- Monthly cashflow
- —
- DSCR
- —
- Eligible?
- —
Short-term bridge; refi at stabilization.
Rent comps 40 comps
| Address | Beds | Baths | Sqft | Rent | $/sqft | DOM | Units | Dist |
|---|---|---|---|---|---|---|---|---|
| 13717 Keal St Detroit, MI | 2.0 | 1.0 | 799 | $1,000 | $1.25 | 43d | 1 | 0.29mi |
| 12775 Plymouth Rd Unit 16 Detroit, MI | 2.0 | 1.0 | 1009 | $825 | $0.82 | 43d | 1 | 0.52mi |
| 11431 Marlowe St Detroit, MI | 3.0 | 1.0 | 1172 | $1,400 | $1.19 | 16d | 1 | 0.53mi |
| 12039 Lauder St Detroit, MI | 3.0 | 1.5 | 1000 | $1,500 | $1.50 | 24d | 1 | 0.59mi |
| 12014 Terry St Detroit, MI | 2.0 | 1.0 | 1361 | $1,200 | $0.88 | 43d | 1 | 0.61mi |
| 10002 Manor Unit 2 Detroit, MI | 3.0 | 1.0 | 1100 | $1,150 | $1.05 | 43d | 1 | 0.68mi |
| 10002 Manor Unit 1 Detroit, MI | 2.0 | 1.0 | 1000 | $1,050 | $1.05 | 43d | 1 | 0.68mi |
| 9590 Marlowe St Detroit, MI | 2.0 | 1.0 | 877 | $1,430 | $1.63 | 43d | 1 | 0.68mi |
| 9340 Hartwell St Detroit, MI | 3.0 | 1.0 | 1000 | $1,364 | $1.36 | 43d | 1 | 0.69mi |
| 9355 Ward St Detroit, MI | 3.0 | 1.0 | 1200 | $1,327 | $1.11 | 43d | 1 | 0.72mi |
| 10015 Robson St Detroit, MI | 3.0 | 2.0 | 1000 | $1,400 | $1.40 | 17d | 1 | 0.74mi |
| 9558 Meyers Rd Detroit, MI | 3.0 | 1.0 | 950 | $1,150 | $1.21 | 43d | 1 | 0.76mi |
| 12754 Marlowe St Detroit, MI | 3.0 | 2.0 | 1008 | $1,400 | $1.39 | 16d | 1 | 0.77mi |
| 11634 Sussex St Detroit, MI | 3.0 | 1.0 | 1091 | $1,326 | $1.22 | 24d | 1 | 0.77mi |
| 14740 W Chicago Unit B Detroit, MI | 2.0 | 1.0 | 900 | $845 | $0.94 | 43d | 1 | 0.79mi |
| 9501 Lauder St Detroit, MI | 3.0 | 2.0 | 1152 | $1,350 | $1.17 | 43d | 1 | 0.80mi |
| 11397 Whitcomb St Detroit, MI | 3.0 | 1.0 | 1070 | $1,400 | $1.31 | 16d | 1 | 0.86mi |
| 12468 Mendota St Detroit, MI | 2.0 | 1.0 | 1100 | $1,100 | $1.00 | 43d | 1 | 0.88mi |
| 12468 Mendota St Detroit, MI | 2.0 | 1.0 | 1100 | $1,000 | $0.91 | 24d | 1 | 0.88mi |
| 9917 Sussex St Detroit, MI | 2.0 | 1.0 | 800 | $1,375 | $1.72 | 43d | 1 | 0.88mi |
| 11393 Prest St Detroit, MI | 3.0 | 1.0 | 900 | $1,550 | $1.72 | 16d | 1 | 0.92mi |
| 9546 Sussex St Detroit, MI | 3.0 | 1.0 | 1000 | $1,400 | $1.40 | 43d | 1 | 0.93mi |
| 13331 Strathmoor St Detroit, MI | 3.0 | 1.0 | 1084 | $1,100 | $1.01 | 16d | 1 | 0.93mi |
| 10345 Crocuslawn Ave Unit 2 Detroit, MI | 2.0 | 1.0 | 850 | $950 | $1.12 | 43d | 1 | 0.93mi |
| 10359 Violetlawn St Unit 1 Detroit, MI | 2.0 | 1.0 | 1200 | $985 | $0.82 | 43d | 1 | 0.94mi |
| 9386 Coyle St Detroit, MI | 3.0 | 1.0 | 1000 | $1,300 | $1.30 | 1d | 1 | 0.96mi |
| 11345 Greenfield Rd Detroit, MI | 2.0 | 1.0 | 700 | $1,050 | $1.50 | 12d | 1 | 0.99mi |
| 10303 Morley St #1 Detroit, MI | 2.0 | 1.0 | 950 | $950 | $1.00 | 43d | 1 | 1.02mi |
| 12144 Washburn St Detroit, MI | 3.0 | 1.0 | 1200 | $1,200 | $1.00 | 14d | 1 | 1.03mi |
| 9973 Winthrop St Detroit, MI | 3.0 | 1.0 | 960 | $1,400 | $1.46 | 43d | 1 | 1.07mi |
| 13279 Coyle St Detroit, MI | 3.0 | 1.0 | 1444 | $1,373 | $0.95 | 43d | 1 | 1.08mi |
| 12121 Montrose St Detroit, MI | 3.0 | 1.0 | 874 | $1,373 | $1.57 | 21d | 1 | 1.11mi |
| 9936 Montrose St Detroit, MI | 3.0 | 1.0 | 963 | $1,200 | $1.25 | 16d | 1 | 1.12mi |
| 11641 Mansfield St Unit 2 Detroit, MI | 3.0 | 1.0 | 1449 | $1,300 | $0.90 | 43d | 1 | 1.27mi |
| 13965 Mendota St Detroit, MI | 3.0 | 1.0 | 1222 | $1,294 | $1.06 | 17d | 1 | 1.28mi |
| 9353 Kentucky St Detroit, MI | 2.0 | 1.0 | 800 | $999 | $1.25 | 17d | 1 | 1.28mi |
| 14284 Cruse St Detroit, MI | 3.0 | 1.0 | 1121 | $1,150 | $1.03 | 16d | 1 | 1.28mi |
| 9222 Forrer St Detroit, MI | 3.0 | 1.0 | 947 | $1,450 | $1.53 | 16d | 1 | 1.32mi |
| 14104 Coyle St Detroit, MI | 3.0 | 1.0 | 1327 | $1,350 | $1.02 | 4d | 1 | 1.32mi |
| 9589 Mansfield St Detroit, MI | 4.0 | 1.0 | 1250 | $1,500 | $1.20 | 4d | 1 | 1.36mi |
Listing history 26 events
-
2026-06-18days on market $79,000 Active 136 DOM
-
2026-06-17days on market $79,000 Active 135 DOM
-
2026-06-15days on market $79,000 Active 133 DOM
-
2026-06-13days on market $79,000 Active 131 DOM
-
2026-06-13days on market $79,000 Active 130 DOM
-
2026-06-09days on market $79,000 Active 127 DOM
-
2026-06-08days on market $79,000 Active 126 DOM
-
2026-06-07days on market $79,000 Active 125 DOM
-
2026-06-04days on market $79,000 Active 122 DOM
-
2026-06-03days on market $79,000 Active 121 DOM
-
2026-06-01days on market $79,000 Active 119 DOM
-
2026-05-31days on market $79,000 Active 118 DOM
-
2026-03-26price $79,000 378-char remark
Show marketing remark (378 chars)
Attention investors, don't miss this excellent investment opportunity!! This solid Detroit brick bungalow is ideal for investors to expand their portfolio. Tenant is paying $1,150 a month, MTM lease. Conveniently located with easy access from I-96 and M-39 freeways. Schedule your showing today!!! PLEASE DO NOT DISTURB TENANTS. B. A. T. V. A. I. All measurements are estimated.
-
2026-03-25price $79,000 378-char remark
Show marketing remark (378 chars)
Attention investors, don't miss this excellent investment opportunity!! This solid Detroit brick bungalow is ideal for investors to expand their portfolio. Tenant is paying $1,150 a month, MTM lease. Conveniently located with easy access from I-96 and M-39 freeways. Schedule your showing today!!! PLEASE DO NOT DISTURB TENANTS. B. A. T. V. A. I. All measurements are estimated.
-
2026-02-03$80,000 Active 378-char remark
Show marketing remark (378 chars)
Attention investors, don't miss this excellent investment opportunity!! This solid Detroit brick bungalow is ideal for investors to expand their portfolio. Tenant is paying $1,150 a month, MTM lease. Conveniently located with easy access from I-96 and M-39 freeways. Schedule your showing today!!! PLEASE DO NOT DISTURB TENANTS. B. A. T. V. A. I. All measurements are estimated.
-
2026-02-02$80,000 Active 378-char remark
Show marketing remark (378 chars)
Attention investors, don't miss this excellent investment opportunity!! This solid Detroit brick bungalow is ideal for investors to expand their portfolio. Tenant is paying $1,150 a month, MTM lease. Conveniently located with easy access from I-96 and M-39 freeways. Schedule your showing today!!! PLEASE DO NOT DISTURB TENANTS. B. A. T. V. A. I. All measurements are estimated.
-
2026-01-18historical
-
2026-01-18historical
-
2025-07-31$80,000 Active
-
2025-07-31$80,000 Active
-
2017-10-05soldstatus $48,500
-
2012-08-30soldstatus $5,400
-
2012-08-30soldstatus $5,400
-
2012-06-15$5,400
-
2012-06-15$5,400
-
1999-01-27soldstatus $30,000
ⓘ Source: listings_history table (triggers on properties + properties_extension) + one-shot
backfill from property_details.listing_events for pre-trigger history.
Tax reassessment forecast MI · Partial reset (capped growth)
- Current annual tax
- $694 · $58/mo
- Projected year-2 tax
- $955 · $80/mo
- Expected delta
- +$261/yr (+$22/mo · 37.6%)
ⓘ Screening estimate from a state-policy table — verify with the county assessor before closing.
Climate risk First Street
- Flood 1/10 Low FEMA zone X (unshaded) · 0% chance over 30 yrs
- Wildfire 1/10 Low
- Heat 3/10 Moderate 7 d/yr ≥97°F today · 15 d/yr by 30 yrs out
- Wind 2/10 Low
- Air quality 3/10 Moderate 2 unhealthy d/yr today · 5 by 30 yrs out
Nearby sold comps map
Loading sold comps map…
Walkable amenities ~0.75 mi
Loading nearby amenities…
Taxation est. · year 1
- Rental income
- $15,723
- − Mortgage interest
- −$4,425
- − Property taxes
- −$694
- − Insurance
- −$395
- − Repairs & maintenance
- −$1,258
- − Management
- −$1,258
- − Depreciation
- −$2,298
- Taxable income
- $5,395
- Est. tax owed @ 24.0%
- −$1,295
- After-tax cash flow
- $5,066/yr
For passive investors: Depreciation is non-cash, so a rental often shows a tax loss while cash-flowing — sheltering income. Rental losses are passive: they offset passive income freely, and up to $25,000/yr can offset ordinary (W-2) income if you actively participate and your MAGI is under $100k (phasing out to $0 by $150k); unused losses carry forward. On sale, claimed depreciation is recaptured at up to 25%, and gains may owe capital-gains tax (a 1031 exchange can defer both). Figures are a year-1 estimate at your 24.0% rate — not tax advice; consult a CPA.
Schools (NCES district)
- District
- Detroit Public Schools Community District
- NCES district ID
- 2601103
- Math proficiency
- 10% ▼ -2.00%
- Reading proficiency
- 24% ▲ 6.00%
- Median HH income
- $25,815
- Composite
- 13.06/100
- National rank
- #9564
- State rank
- #499 of 540 in MI
Livability — Detroit
- Score
- 73/100
- State rank
- #218
- US rank
- #5427
Category grades
Schools grade is shown separately in the Schools card above.
Census & demographics
- Census place
- Detroit, MI
- County
- Wayne County · 1,562,939 people
- City population
- 572,865
- Metro
- Detroit-Warren-Dearborn, MI
- Population (ZIP)
- 40,302
- Household income
- $36,527
- Rent vs Own
- Severe rent burden
- 2371.0
Population outlook (Wayne County) Hauer SSP2
- Today (2025)
- 1,675,273 people
- By 2030
- 1,620,300 · -3.3%
- By 2040
- 1,502,341 · -10.3%
- By 2050
- 1,384,039 · -17.4%
- By 2075
- 1,124,592 · -32.9%
- By 2100
- 881,193 · -47.4%
Race, ethnicity, and origin ACS 2023
- Neighborhood character
- Predominantly Black (95%)
- Race & ethnicity
- Black 95% Two or more races 3% White 1%
- Foreign-born
- 1%
- Languages at home
- 98% English-only · Spanish 1% French/Haitian/Cajun 1%
Political lean MEDSL · Wayne
- 2024 margin
- Strong D (+29.0) · D 62.7% · R 33.7% · Other 3.6%
- 2008→2024 swing
- -20.5pp toward R · 2008: 49.5pp · 2024: 29.0pp
- All cycles
- 2024: D+29.0 2020: D+38.1 2016: D+37.3 2012: D+46.9 2008: D+49.5
Not yet ingested
- Civics
- —
Market trends
- HPI YoY
- ▼ -125.00%
- Current HPI
- 186.4158
- Rent YoY
- ▲ 5.59%
- Metro
- Detroit-Warren-Dearborn, MI
- State GDP YoY
- ▲ 1.37%
- F500 in state
- 28
Industry mix (Fortune 500 HQ in MI)
| Industry | F500 HQs | Revenue |
|---|---|---|
| Automotive Parts | 3 | $48B |
|
||
| Automotive | 2 | $372B |
|
||
| Chemicals | 1 | $45B |
|
||
| Automotive Retail | 1 | $29B |
|
||
| Healthcare / Medical Devices | 1 | $23B |
|
||
| Automotive Technology | 1 | $20B |
|
||
Price history
+163.3% since first listed14 events — show timeline
- 2026-03-26 Price Changed $79,000 MiRealSource-MiMLS
- 2026-03-25 Price Changed $79,000 REALCOMP
- 2026-02-03 Listed $80,000 REALCOMP
- 2026-02-02 Listed $80,000 MiRealSource-MiMLS
- 2026-01-18 Listing Removed — REALCOMP
- 2026-01-18 Listing Removed — MiRealSource-MiMLS
- 2025-07-31 Listed $80,000 REALCOMP
- 2025-07-31 Listed $80,000 MiRealSource-MiMLS
- 2017-10-05 Sold (Public Records) $48,500 Public Records
- 2012-08-30 Sold (MLS) $5,400 REALCOMP
- 2012-08-30 Sold (MLS) $5,400 MiRealSource-MiMLS
- 2012-06-15 Listed $5,400 REALCOMP
- 2012-06-15 Listed $5,400 MiRealSource-MiMLS
- 1999-01-27 Sold (Public Records) $30,000 Public Records
Property tax history
-2.5%/yrLatest (2025): $694 · +2.0% YoY. Source: county tax records.
Cash-flow waterfall
monthlySold comps — $/sqft
last 12 mo · ≤1 miLoading sold comps…