3415 Oro Dam Blvd E #109 · Oroville, CA
Flood risk 5/10 · Moderate
- FEMA flood zone
- X (unshaded)
- Chance of flooding over 30 yrs
- 0.66%
- Est. flood insurance / yr
- $507 – $1,088
Fire risk 9/10 · Severe
- Est. fire insurance / yr
- $659 – $1,223
Heat risk 7/10 · Major
- Hot days now (above 105°F)
- 7 days/yr
- Hot days in 30 yrs
- 16 days/yr
Wind risk 1/10 · Minimal
- Chance of severe wind over 30 yrs
- —
Air-quality risk 10/10 · Severe
- Unhealthy air days now
- 29 days/yr
- Unhealthy air days in 30 yrs
- 36 days/yr
Risk factors via First Street. Map © Google.
Why this score? — see what drove the B- grade
The composite is a weighted blend of 9 inputs, each scored 0–100. Each bar is that input's sub-score; the figure is the points it added to the 100-point composite (weight × sub-score).
- Cash flow +30.0/30.0
- 1% rule +10.0/10.0
- DSCR +10.0/10.0
- ARV discount +7.5/15.0
- Schools +2.8/10.0
- Rent growth +2.5/5.0
- Livability +2.5/5.0
- Condition / age +2.5/5.0
- Appreciation +0.0/10.0
$45,000
🖨 Deal sheet 📄 Offer letter ✓ Due diligence
Listing remarks
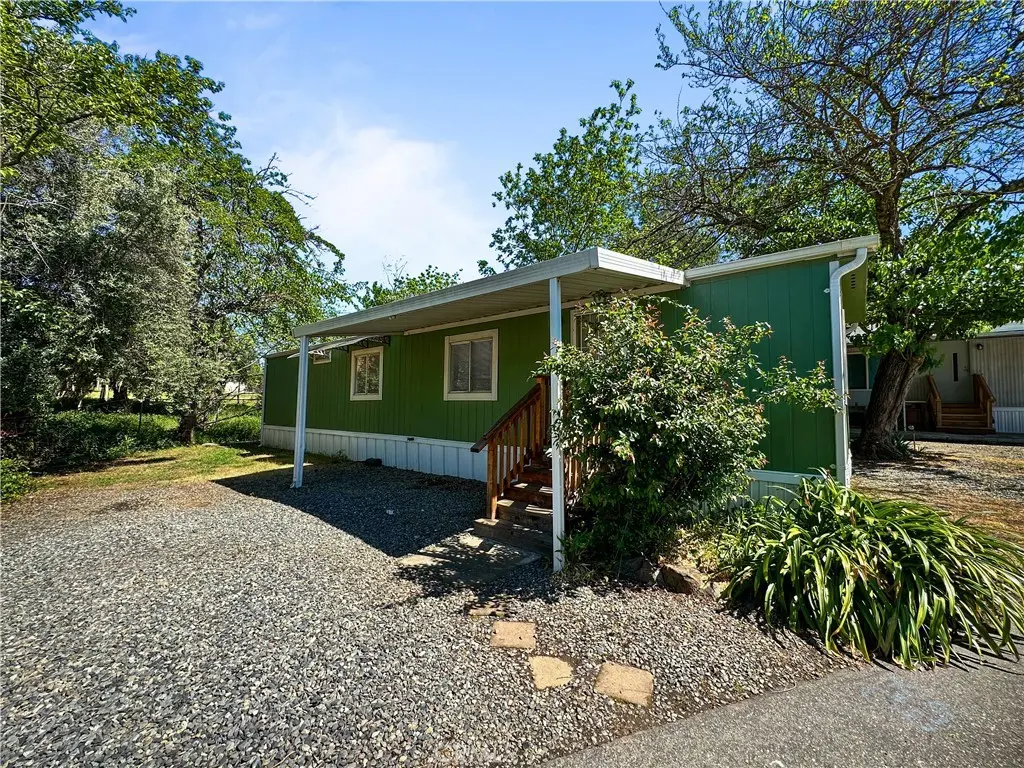
This charming manufactured home offers 2 bedrooms, 1 bathroom, and 728 square feet of comfortable living space. The open floor plan flows between the living, dining, and kitchen areas, making the home feel both functional and spacious. Large windows throughout bring in a ton of natural light, giving the home a surprisingly spacious feel. The cozy interior provides a warm and welcoming environment, perfect for everyday living or relaxing after a long day. Whether you're looking for a low-maintenance primary residence, an investment opportunity, or a downsized lifestyle, this home offers comfort, efficiency, and charm all in one.
Key facts
- Community pool
- Built 1991
- Listed 73 days
Property features AI
Finance
- Other: Community amenities include hiking, fishing, foothills and lake access
- HOA & community: Located in a land-lease park (Pleasant Valley Mobile); Land lease: $525 per month (park fee)
Exterior
- Parking: Carport; Community mobile home park parking (Pleasant Valley Mobile)
- Utilities: Public sewer; District/public water
- Home design: Single-story mobile home (Springbrook model); Mobile home remains on site; Has view
- Construction: Mobile home, approximately 14 ft by 52 ft; Specified as single-story; year built listed as other
- Exterior features: Community pool; Front yard
Interior
- Bathrooms: 1 full bathroom
- Heating & cooling: Central cooling; Central furnace heating
- Interior features: Single-level entry; Entry located on main level
- Laundry & utility: On-site laundry area
Neighborhood map
What this means for you Summary
Snapshot
- This is a 2-bed/1.0-bath manufactured listed at $45k.
Deal economics
- At list price, monthly cash flow is $851 ($10k/yr) — positive.
- The deal already cash-flows at list — no discount required.
- Meets the 1% rule at list price ($1k rent vs $45k).
- Recommended offer: $42k (6.0% below list) — sets the bar for market timing.
- Cap rate 29.0% vs local median 4.6% in Oroville — top-decile yield for the area; either an underpriced asset or a hidden risk that comps aren't pricing in. Stress-test before assuming the spread holds.
Location & tenants
- Location reads 50/100 on livability (#1,136 in CA) — a working-class tenant base; expect higher turnover. Watch: schools D, cost of living D, crime F.
- Oroville Union High (town): math 19% / reading 49% proficiency, ranked #300 of 517 in CA (top 58%) — families likely to look elsewhere, expect single-tenant / working-renter base with shorter leases.
- Market conditions: 372 active listings in the ZIP; 8 comparable units currently listed for rent nearby; rentals leasing fast (median 13d on market — plan ~1-2 weeks tenant-placement turnaround); 946 units permitted in Butte County in 2024 (254 in 5+ unit buildings).
Forward outlook
- Local home prices are declining (-3.0%/yr); year-one equity from $311 of loan paydown is wiped out by about $1k of value loss. Plan a longer hold.
- Butte County population projected at +10% by 2050 — modest demand growth; plan on rents tracking national, not racing it.
- At projected returns (-3.0% appreciation + 3.0% rent growth), your $13k cash investment doubles in ~2 years — after that, you're playing with house money.
Negotiation context
- It's been on market 74 days — a 6% lower offer ($42k) is reasonable based on typical stale-listing flexibility.
Risks & watch-outs
- Climate carrying-cost: moderate flood risk; severe wildfire risk; extreme-heat days projected 7→16/yr by 2055 (HVAC capex compounding) — expect insurance premiums to compound above CPI over the hold.
Questions for the listing agent
- It's been on market 74 days. Have you received any prior offers? Is the seller open to a 6% concession, seller financing, or rate buy-down credit?
- Why hasn't it sold? Are there any deal-killer items the seller is aware of (foundation, flood, title, zoning, code violations)?
- Is there a deadline driving the sale (1031 exchange, divorce, estate, relocation)? That informs how much negotiation room exists.
- Schools are D-rated, which usually means shorter tenancies and higher turnover. Who's the typical renter profile here, and what's been the actual vacancy rate?
- Crime grade is F in this area — have there been break-ins, vandalism, or insurance claims at this property in the last 3 years? What carrier currently insures it and at what premium?
- What's the average days-on-market for RENTAL listings here right now (not sales)? A rising rental-DOM trend means longer vacancies and softer asking-rent achievability than the comps imply.
- What's the recent tenant-quality profile in this submarket — average credit score on applications, eviction rate, late-payment / NSF rate, and stable-employment percentage? A property-management company in the area should have these aggregated.
- How much new for-sale + rental construction is in the pipeline within 1–3 miles? Heavy new supply typically softens prices + rents 12–24 months out; constrained supply supports both.
Investment metrics
- 1% rule
- 3.25% ✓
- Cap rate
- 28.99%
- Cash-on-cash
- 81.05%
- DSCR
- 4.61
- GRM
- 2.6
CMA / ARV
- ARV (on-the-fly)
- $99,008
- Comps found
- 2
Show comp detail 2 sales within ~0.75 mi
| Address | Dist | Beds/Ba | Sqft | Sold | Price | $/sf | Match |
|---|---|---|---|---|---|---|---|
| 3415 Oro Dam Blvd E #217 | 0.04mi | 2/2.0 | 728 (0%) | 9mo | $99,000 | $136 | 86 |
| 3415 Oro Dam Blvd E #102 | 0.03mi | 2/1.0 | 784 (+8%) | 23mo | $50,000 | $64 | 66 |
Match score weights: distance 35% · size 25% · config 20% · recency 20%. Top-matched comps best support the ARV.
Projected returns pro-forma
-3.0% appreciation · 3.0% rent growth · sell at horizon
- IRR
- 81.3%
- Equity multiple
- 4.72×
- Total profit
- $46,931
- Equity at exit
- $6,710
- IRR
- 84.7%
- Equity multiple
- 9.79×
- Total profit
- $110,740
- Equity at exit
- $3,891
Cash invested: $12,600 (down + closing). Projections, not guarantees.
Landlord ↔ Tenant lean methodology
- Overall (STATE)
- 18 Strongly Tenant-Friendly
- State California
- 18 Strongly Tenant-Friendly · D+13
- County
- — inherits STATE
- City
- — inherits STATE
ZIP-level market 95966
- Active inventory
- 372
- Price-to-rent
- 2.6×
Monthly cashflow live
- Estimated rent
- $1,465 high interval (Pro) →
- Mortgage (P&I)
- −$236
- Tax from tax record
- −$51 /mo · $616/yr
- Insurance
- −$19
- HOA
- −$0
- Vacancy / Maint / Mgmt
- −$308
- Net cashflow
- $851
Break-even live
UW: 25.0% down · 7.5% · 30yr · 1.5% tax · 5.0% vac · 8.0% maint · 8.0% mgmt
Financing live
Cash to close
- Down payment
- $11,250
- Closing costs
- $1,350
- Reserves months
- —
- Total cash needed
- —
Loan-product check · same deal, 3 products live
Conventional
25% down · 7.5% · 30yr
- Down + closing
- —
- Monthly P&I
- —
- Monthly cashflow
- —
- DSCR
- —
- Eligible?
- —
Personal DTI + credit; lowest rate.
DSCR
20% down · 8.5% · 30yr
- Down + closing
- —
- Monthly P&I
- —
- Monthly cashflow
- —
- DSCR
- —
- Eligible?
- —
No personal income docs; deal must DSCR.
Hard money
10% down · 12.0% · 12mo
- Down + closing
- —
- Monthly P&I
- —
- Monthly cashflow
- —
- DSCR
- —
- Eligible?
- —
Short-term bridge; refi at stabilization.
Rent comps 8 comps
| Address | Beds | Baths | Sqft | Rent | $/sqft | DOM | Units | Dist |
|---|---|---|---|---|---|---|---|---|
| 2804 Orange Ave Unit 11 Oroville, CA | 1.0 | 1.0 | 526 | $1,095 | $2.08 | 13d | 1 | 0.57mi |
| 1558 Bridge St Oroville, CA | 2.0 | 1.0 | 661 | $1,172 | $1.77 | 13d | 1 | 0.62mi |
| 2741 Gilmore Ln Unit 3 Oroville, CA | 2.0 | 1.0 | 689 | $1,595 | $2.31 | 21d | 1 | 0.65mi |
| 2739 Gilmore Ln Unit 4 Oroville, CA | 2.0 | 1.0 | 720 | $1,595 | $2.22 | 13d | 1 | 0.67mi |
| 2737 Gilmore Ln Unit 1 Oroville, CA | 2.0 | 1.0 | 720 | $1,595 | $2.22 | 13d | 1 | 0.68mi |
| 331 Bonite St Oroville, CA | 2.0 | 1.0 | 672 | $1,450 | $2.16 | 21d | 1 | 1.03mi |
| 1331 Pomona Ave Unit 4 Oroville, CA | 2.0 | 1.0 | 673 | $1,075 | $1.60 | 13d | 1 | 1.45mi |
| 1138 Elma St Apt 4 Oroville, CA | 1.0 | 1.0 | 500 | $975 | $1.95 | 13d | 1 | 1.48mi |
Listing history 17 events
-
2026-06-19days on market $45,000 Active 74 DOM
-
2026-06-18days on market $45,000 Active 73 DOM
-
2026-06-17days on market $45,000 Active 72 DOM
-
2026-06-16days on market $45,000 Active 71 DOM
-
2026-06-15days on market $45,000 Active 70 DOM
-
2026-06-14days on market $45,000 Active 68 DOM
-
2026-06-13days on market $45,000 Active 67 DOM
-
2026-06-10days on market $45,000 Active 65 DOM
-
2026-06-09days on market $45,000 Active 64 DOM
-
2026-06-08days on market $45,000 Active 63 DOM
-
2026-06-07days on market $45,000 Active 62 DOM
-
2026-06-03days on market $45,000 Active 58 DOM
-
2026-06-02days on market $45,000 Active 57 DOM
-
2026-06-01days on market $45,000 Active 56 DOM
-
2026-05-31days on market $45,000 Active 55 DOM
-
2026-05-30days on market $45,000 Active 54 DOM
-
2026-04-06$45,000 Active
ⓘ Source: listings_history table (triggers on properties + properties_extension) + one-shot
backfill from property_details.listing_events for pre-trigger history.
Tax reassessment forecast CA · Resets to sale price
- Current annual tax
- $616 · $51/mo
- Projected year-2 tax
- $616 · $51/mo
- Expected delta
- $0/yr ($0/mo · 0.0%)
ⓘ Screening estimate from a state-policy table — verify with the county assessor before closing.
Climate risk First Street
- Flood 5/10 Major FEMA zone X (unshaded) · 66% chance over 30 yrs
- Wildfire 9/10 Extreme
- Heat 7/10 Severe 7 d/yr ≥105°F today · 16 d/yr by 30 yrs out
- Wind 1/10 Low
- Air quality 10/10 Extreme 29 unhealthy d/yr today · 36 by 30 yrs out
Nearby sold comps map
Loading sold comps map…
Walkable amenities ~0.75 mi
Loading nearby amenities…
Taxation est. · year 1
- Rental income
- $17,577
- − Mortgage interest
- −$2,521
- − Property taxes
- −$616
- − Insurance
- −$225
- − Repairs & maintenance
- −$1,406
- − Management
- −$1,406
- − Depreciation
- −$1,309
- Taxable income
- $10,093
- Est. tax owed @ 24.0%
- −$2,422
- After-tax cash flow
- $7,790/yr
For passive investors: Depreciation is non-cash, so a rental often shows a tax loss while cash-flowing — sheltering income. Rental losses are passive: they offset passive income freely, and up to $25,000/yr can offset ordinary (W-2) income if you actively participate and your MAGI is under $100k (phasing out to $0 by $150k); unused losses carry forward. On sale, claimed depreciation is recaptured at up to 25%, and gains may owe capital-gains tax (a 1031 exchange can defer both). Figures are a year-1 estimate at your 24.0% rate — not tax advice; consult a CPA.
Schools (NCES district)
- District
- Oroville Union High
- NCES district ID
- 0629130
- Math proficiency
- 19% ▼ -2.00%
- Reading proficiency
- 49% ▼ -4.00%
- Median HH income
- $38,085
- Composite
- 28.26/100
- National rank
- #6794
- State rank
- #300 of 517 in CA
Livability — Oroville
- Score
- 50/100
- State rank
- #1136
- US rank
- #25715
Category grades
Schools grade is shown separately in the Schools card above.
Census & demographics
- Census place
- Oroville, CA
- County
- Butte County · 175,030 people
- City population
- 49,684
- Metro
- Chico, CA
- Population (ZIP)
- 28,503
- Household income
- $65,586
- Rent vs Own
- Severe rent burden
- 807.0
Population outlook (Butte County) Hauer SSP2
- Today (2025)
- 237,527 people
- By 2030
- 243,804 · +2.6%
- By 2040
- 253,899 · +6.9%
- By 2050
- 262,561 · +10.5%
- By 2075
- 283,709 · +19.4%
- By 2100
- 282,689 · +19.0%
Race, ethnicity, and origin ACS 2023
- Neighborhood character
- Predominantly White (67%)
- Race & ethnicity
- White 67% Hispanic / Latino 18% Two or more races 14% Asian 6% Native American 2% Black 2%
- Hispanic origin (detail)
- Mexican 16%
- Common ancestry
- Lithuanian 3% Slovak 3% Portuguese 2%
- Foreign-born
- 6% · Canada
- Languages at home
- 88% English-only · Spanish 7% Other Asian/Pacific 3% Russian/Polish/Slavic 1%
Political lean MEDSL · Butte
- 2024 margin
- Toss-up / Even · D 46.8% · R 49.9% · Other 3.3%
- 2008→2024 swing
- -5.5pp toward R · 2008: 2.4pp · 2024: -3.1pp
- All cycles
- 2024: R+3.1 2020: D+1.7 2016: R+4.0 2012: R+3.9 2008: D+2.4
Not yet ingested
- Civics
- —
Market trends
- HPI YoY
- ▼ -284.58%
- Current HPI
- 267.1415
- Rent YoY
- —
- Metro
- Chico, CA
- State GDP YoY
- ▲ 3.21%
- F500 in state
- 116
Industry mix (Fortune 500 HQ in CA)
| Industry | F500 HQs | Revenue |
|---|---|---|
| Technology | 27 | $1,492B |
|
||
| Financial Services | 3 | $174B |
|
||
| Retail | 3 | $44B |
|
||
| Insurance | 3 | $26B |
|
||
| Media / Entertainment | 2 | $115B |
|
||
| Pharmaceuticals / Biotech | 2 | $62B |
|
||
Price history
1 event — show timeline
- 2026-04-06 Listed $45,000 CRMLS
Property tax history
+10.8%/yrLatest (2025): $616 · +1.0% YoY. Source: county tax records.
Cash-flow waterfall
monthlySold comps — $/sqft
last 12 mo · ≤1 miLoading sold comps…