6800 Placida Rd Unit TH13 · Rotonda, FL
Flood risk 10/10 · Severe
- FEMA flood zone
- AE
- Chance of flooding over 30 yrs
- 0.99%
- Est. flood insurance / yr
- $1,737 – $8,500
Fire risk 1/10 · Minimal
- Est. fire insurance / yr
- $947 – $1,759
Heat risk 10/10 · Severe
- Hot days now (above 107°F)
- 6 days/yr
- Hot days in 30 yrs
- 24 days/yr
Wind risk 10/10 · Severe
- Chance of severe wind over 30 yrs
- 99.0%
Air-quality risk 2/10 · Minimal
- Unhealthy air days now
- 1 days/yr
- Unhealthy air days in 30 yrs
- 1 days/yr
Risk factors via First Street. Map © Google.
Why this score? — see what drove the C grade
The composite is a weighted blend of 9 inputs, each scored 0–100. Each bar is that input's sub-score; the figure is the points it added to the 100-point composite (weight × sub-score).
- Cash flow +21.2/30.0
- 1% rule +10.0/10.0
- ARV discount +7.5/15.0
- DSCR +6.8/10.0
- Schools +4.6/10.0
- Livability +3.4/5.0
- Rent growth +2.5/5.0
- Condition / age +2.5/5.0
- Appreciation +0.0/10.0
$179,000
🖨 Deal sheet 📄 Offer letter ✓ Due diligence
Listing remarks
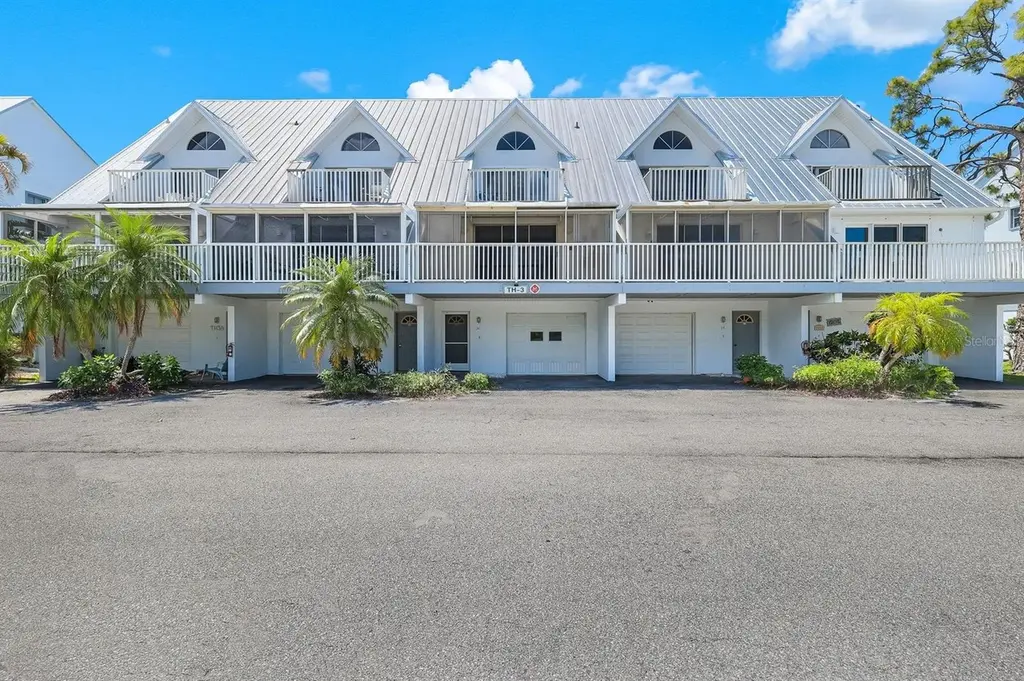
Rare opportunity to own a fully updated, move-in-ready townhouse with an attached garage in the highly desirable Fiddler’s Green community! This spacious 3-bedroom, 2-bath townhome offers the perfect blend of comfort, style, and convenience for full-time living, a seasonal retreat, or an incredible vacation property for the whole family. Beautifully upgraded throughout, this home features brand-new stainless steel appliances, fresh luxury vinyl flooring, a new hot water heater, and a complete PEX plumbing upgrade for added peace of mind. The metal roof is only 2 years old, offering durability and long-term value. The spacious layout includes a private primary suite occupying the top f
Key facts
- Metal roof
- Attached garage
- New hot water heater
Tags
Property features AI
Finance
- Other: Partially furnished; Unit on floor 1; Condo land included; Direction faces north
- Financial info: Total annual association fees reported; Lease restrictions apply
- HOA & community: HOA required; monthly HOA $873 (quarterly association fees listed); Association covers cable TV, pool, insurance, grounds and structure maintenance, management, recreational facilities, escrow reserves; Community features include clubhouse, community mailbox, pool, tennis courts, deed restrictions; buyer approval required; Pets allowed (size limit)
Exterior
- Parking: Attached, oversized garage with opener (1 garage space; approx. 24x14)
- Utilities: Public water; Public sewer; Electricity connected; Cable available; Water connected; Sewer connected
- Home design: Condominium (residential); Townhouse building identifier TH3; Three or more stories
- Construction: Block, concrete and stucco construction; Metal roof; Slab foundation; Built as part of a multi-building condominium
- Exterior features: Balcony; Sliding doors; Paved road access
Interior
- Kitchen: Cooktop; Dishwasher; Microwave; Refrigerator; Freezer
- Bedrooms: 3 bedrooms
- Bathrooms: 2 full bathrooms
- Heating & cooling: Central heating (electric); Central air conditioning
- Interior features: Ceiling fans; Kitchen/family room combo; Living room/dining room combo; Split bedroom floorplan; Walk-in closets; Storage rooms
- Laundry & utility: Inside laundry; Washer; Dryer
Neighborhood map
What this means for you Summary
Snapshot
- This is a 3-bed/2.0-bath condo listed at $179k.
Deal economics
- At list price, monthly cash flow is $-166 ($-2k/yr) — negative.
- To cash-flow at today's rent, offer at most $150k (16.4% below list).
- Meets the 1% rule at list price ($3k rent vs $179k).
- Recommended offer: $150k (16.4% below list) — sets the bar for cash-flow.
- Cap rate 8.0% vs local median 3.1% in Rotonda — top-decile yield for the area; either an underpriced asset or a hidden risk that comps aren't pricing in. Stress-test before assuming the spread holds.
Location & tenants
- Location reads 67/100 on livability (#548 in FL) — a middle-class / working-renter tenant base. Strengths: crime A+, housing A-, cost of living B+; Watch: schools D, amenities F, commute F.
- Charlotte (suburban): math 54% / reading 54% proficiency, ranked #22 of 73 in FL (top 30%) — acceptable for families but not a draw, mixed tenant base, ~2y average lease.
- Market conditions: Rents soft (-0.1%/yr); 734 active listings in the ZIP; 29 comparable units currently listed for rent nearby; rentals at typical pace (median 21d on market — plan ~3-4 weeks tenant-placement turnaround); 4,585 units permitted in Charlotte County in 2024 (703 in 5+ unit buildings).
- At $2,812/mo this rent would consume 59% of the median local household income ($57k/yr) (locally 329% of renters already pay >50% of income on rent) — very limited rent-growth headroom before tenants either downsize or default.
Forward outlook
- Local home prices are declining (-3.0%/yr); year-one equity from $1k of loan paydown is wiped out by about $5k of value loss. Plan a longer hold.
- Charlotte County population projected at +24% by 2050 — long-run rental-demand tailwind backs the buy-and-hold thesis.
Negotiation context
- It's been on market 25 days — a 2% lower offer ($176k) is reasonable based on typical stale-listing flexibility.
- 2 sale attempts since 16y ago; this cycle's ask has dropped $10k (5%) from the opening price — seller is motivated, your offer sets the floor, not the list.
- Current owner paid $75k; list at $179k implies a 139% gain — meaningful room to come down on a strong offer.
Risks & watch-outs
- Watch-outs: flood insurance adds $427/mo; HOA is 31% of rent.
- Climate carrying-cost: in FEMA flood zone AE (mandatory federal flood insurance); severe wind risk, 99% chance of damaging wind over 30y; extreme-heat days projected 6→24/yr by 2055 (HVAC capex compounding) — expect insurance premiums to compound above CPI over the hold.
Questions for the listing agent
- What do current leases actually rent for vs. the listed asking? Can we see a recent rent roll and the last 12 months of T-12 income?
- What's the actual annual flood-insurance premium (NFIP or private), and is the property in a SFHA with mandatory coverage?
- What does the HOA fee cover, when was the last increase, and are there any pending special assessments or reserve-fund shortfalls?
- Any open or pending special assessments — roof, HVAC, plumbing, elevator, façade? What's the per-unit balance and payoff schedule, and is the seller paying it off at close or rolling it to the buyer?
- Is there a deadline driving the sale (1031 exchange, divorce, estate, relocation)? That informs how much negotiation room exists.
- Schools are D-rated, which usually means shorter tenancies and higher turnover. Who's the typical renter profile here, and what's been the actual vacancy rate?
- What's the average days-on-market for RENTAL listings here right now (not sales)? A rising rental-DOM trend means longer vacancies and softer asking-rent achievability than the comps imply.
- What's the recent tenant-quality profile in this submarket — average credit score on applications, eviction rate, late-payment / NSF rate, and stable-employment percentage? A property-management company in the area should have these aggregated.
- How much new apartment / multifamily construction is in the pipeline within 1–3 miles? Heavy new supply (>2% of stock underway) typically softens rents 12–24 months out; light construction supports rent growth.
Investment metrics
- 1% rule
- 1.57% ✓
- Cap rate
- 8.04%
- Cash-on-cash
- 6.23%
- DSCR
- 1.28
- GRM
- 5.3
CMA / ARV
No comps found within radius.
Projected returns pro-forma
-3.0% appreciation · 0.0% rent growth · sell at horizon
- IRR
- -29.7%
- Equity multiple
- 0.06×
- Total profit
- $-47,090
- Equity at exit
- $26,689
- IRR
- -82.2%
- Equity multiple
- -0.66×
- Total profit
- $-83,445
- Equity at exit
- $15,477
Cash invested: $50,120 (down + closing). Projections, not guarantees.
Landlord ↔ Tenant lean methodology
- Overall (STATE)
- 87 Strongly Landlord-Friendly
- State Florida
- 87 Strongly Landlord-Friendly · R+3
- County
- — inherits STATE
- City
- — inherits STATE
ZIP-level market 34224
- Home prices YoY
- -18.9%
- Rents YoY
- -0.1%
- Active inventory
- 734
- Price-to-rent
- 5.3×
Monthly cashflow live
- Estimated rent
- $2,812 high interval (Pro) →
- Mortgage (P&I)
- −$939
- Tax from tax record
- −$75 /mo · $896/yr
- Insurance
- −$75
- Flood insurance flood zone
- −$427 /mo · $5,118/yr
- HOA
- −$873
- Vacancy / Maint / Mgmt
- −$590
- Net cashflow
- $-166
Break-even live
UW: 25.0% down · 7.5% · 30yr · 1.5% tax · 5.0% vac · 8.0% maint · 8.0% mgmt
Financing live
Cash to close
- Down payment
- $44,750
- Closing costs
- $5,370
- Reserves months
- —
- Total cash needed
- —
Loan-product check · same deal, 3 products live
Conventional
25% down · 7.5% · 30yr
- Down + closing
- —
- Monthly P&I
- —
- Monthly cashflow
- —
- DSCR
- —
- Eligible?
- —
Personal DTI + credit; lowest rate.
DSCR
20% down · 8.5% · 30yr
- Down + closing
- —
- Monthly P&I
- —
- Monthly cashflow
- —
- DSCR
- —
- Eligible?
- —
No personal income docs; deal must DSCR.
Hard money
10% down · 12.0% · 12mo
- Down + closing
- —
- Monthly P&I
- —
- Monthly cashflow
- —
- DSCR
- —
- Eligible?
- —
Short-term bridge; refi at stabilization.
Rent comps 29 comps
| Address | Beds | Baths | Sqft | Rent | $/sqft | DOM | Units | Dist |
|---|---|---|---|---|---|---|---|---|
| 6800 Placida Rd #283 Englewood, FL | 2.0 | 2.0 | 1092 | $1,500 | $1.37 | 20d | 1 | 0.04mi |
| 8541 Amberjack Cir #203 Englewood, FL | 3.0 | 2.0 | 2003 | $5,910 | $2.95 | 20d | 1 | 0.27mi |
| 8272 Harborside Cir Englewood, FL | 3.0 | 3.0 | 1590 | $5,200 | $3.27 | 20d | 1 | 0.54mi |
| 8234 Harborside Cir Englewood, FL | 3.0 | 3.0 | 1735 | $4,200 | $2.42 | 20d | 1 | 0.55mi |
| 113 Boundary Blvd #2 Rotonda West, FL | 3.0 | 2.0 | 1323 | $1,625 | $1.23 | 13d | 1 | 0.69mi |
| 113 Boundary Blvd Unit B 1 Rotonda West, FL | 3.0 | 2.0 | 1325 | $1,695 | $1.28 | 20d | 1 | 0.69mi |
| 93 Boundary Blvd #303 Rotonda West, FL | 2.0 | 2.0 | 1228 | $2,800 | $2.28 | 13d | 1 | 0.69mi |
| 8936 Scallop Way Placida, FL | 3.0 | 2.0 | 2158 | $5,200 | $2.41 | 20d | 1 | 0.71mi |
| 130 Boundary Blvd Unit B Rotonda West, FL | 2.0 | 2.0 | 2060 | $2,000 | $0.97 | 20d | 1 | 0.76mi |
| 100 Rotonda Lakes Cir Rotonda West, FL | 1.0–3.0 | 1.0–2.0 | 1024 | $1,232 | $1.20 | 13d | 1 | 0.82mi |
| 8400 Placida Rd Unit G202 Rental Placida, FL | 2.0 | 2.5 | 1688 | $2,500 | $1.48 | 20d | 1 | 0.85mi |
| 10446 Coquina Ct Placida, FL | 3.0 | 2.0 | 1820 | $4,500 | $2.47 | 20d | 1 | 0.90mi |
| 18 Golfview Ct Rotonda West, FL | 3.0 | 2.0 | 1686 | $3,000 | $1.78 | 20d | 1 | 0.97mi |
| 173 Rotonda Cir Rotonda West, FL | 3.0 | 2.0 | 1350 | $3,200 | $2.37 | 20d | 1 | 1.02mi |
| 188 Boundary Blvd Unit B Rotonda West, FL | 2.0 | 2.0 | 2086 | $2,000 | $0.96 | 20d | 1 | 1.03mi |
| 210 Bocilla Dr Boca Grande, FL | 3.0 | 1.5 | 1296 | $9,858 | $7.61 | 20d | 1 | 1.08mi |
| 64 Golfview Rd Rotonda West, FL | 4.0 | 2.0 | 1697 | $1,795 | $1.06 | 13d | 1 | 1.13mi |
| 37 Oakland Hills Pl Rotonda West, FL | 3.0 | 2.0 | 1321 | $4,000 | $3.03 | 20d | 1 | 1.15mi |
| 60 Golfview Rd Rotonda West, FL | 3.0 | 2.0 | 1336 | $5,550 | $4.15 | 20d | 1 | 1.16mi |
| 45 Oakland Hills Ct Rotonda West, FL | 4.0 | 2.0 | 1536 | $2,700 | $1.76 | 20d | 1 | 1.17mi |
| 3923 Cape Haze Dr #302 Rotonda West, FL | 3.0 | 3.0 | 2044 | $3,100 | $1.52 | 20d | 1 | 1.26mi |
| 65 Oakland Hills Pl Rotonda West, FL | 2.0 | 2.0 | 1444 | $4,500 | $3.12 | 20d | 1 | 1.32mi |
| 226 Boundary Blvd Rotonda West, FL | 2.0 | 2.0 | 1200 | $1,495 | $1.25 | 13d | 1 | 1.33mi |
| 2 Windward Ter Placida, FL | 3.0 | 3.0 | 1953 | $2,500 | $1.28 | 20d | 1 | 1.33mi |
| 239 Annapolis Ln Rotonda West, FL | 3.0 | 2.0 | 1747 | $2,000 | $1.14 | 20d | 1 | 1.37mi |
| 9203 Griggs Rd #204 Englewood, FL | 3.0 | 2.5 | 2028 | $3,500 | $1.73 | 20d | 1 | 1.39mi |
| 230 Annapolis Ln Rotonda West, FL | 3.0 | 2.0 | 1768 | $1,800 | $1.02 | 20d | 1 | 1.40mi |
| 50 Barracuda Dr Placida, FL | 3.0 | 2.0 | 2154 | $3,000 | $1.39 | 20d | 1 | 1.41mi |
| 42 Mark Twain Ln Rotonda West, FL | 3.0 | 2.5 | 1677 | $2,800 | $1.67 | 20d | 1 | 1.42mi |
HOA detail condo
- Monthly dues
- $873 · $10,476/yr
- Likely covers
- water
- Assessments
- None detected in remarks — confirm with the listing agent.
Listing history 27 events
-
2026-06-18days on market $179,000 Active 25 DOM
-
2026-06-17days on market $179,000 Active 24 DOM
-
2026-06-16price $179,000 Active 23 DOM
-
2026-06-16days on market $189,000 Active 23 DOM
-
2026-06-15days on market $189,000 Active 22 DOM
-
2026-06-14days on market $189,000 Active 20 DOM
-
2026-06-13days on market $189,000 Active 19 DOM
-
2026-06-10days on market $189,000 Active 17 DOM
-
2026-06-09days on market $189,000 Active 16 DOM
-
2026-06-08days on market $189,000 Active 15 DOM
-
2026-06-07days on market $189,000 Active 14 DOM
-
2026-06-05days on market $189,000 Active 11 DOM
-
2026-06-03days on market $189,000 Active 10 DOM
-
2026-06-02days on market $189,000 Active 9 DOM
-
2026-06-01days on market $189,000 Active 8 DOM
-
2026-05-31days on market $189,000 Active 7 DOM
-
2026-05-30days on market $189,000 Active 6 DOM
-
2026-05-24$189,000 Active
-
2026-04-01soldstatus $75,000
-
2017-06-01soldstatus $159,900
-
2013-04-16soldstatus $115,000
-
2012-04-09historical
-
2010-04-05$145,000
-
2004-03-31soldstatus $165,000
-
2003-01-10soldstatus $120,000
-
1994-06-07soldstatus $90,000
-
1993-09-15soldstatus $75,000
ⓘ Source: listings_history table (triggers on properties + properties_extension) + one-shot
backfill from property_details.listing_events for pre-trigger history.
Tax reassessment forecast FL · Resets to sale price
- Current annual tax
- $896 · $75/mo
- Projected year-2 tax
- $1,486 · $124/mo
- Expected delta
- +$590/yr (+$49/mo · 65.9%)
ⓘ Screening estimate from a state-policy table — verify with the county assessor before closing.
Climate risk First Street
- Flood 10/10 Extreme FEMA zone AE · 99% chance over 30 yrs
- Wildfire 1/10 Low
- Heat 10/10 Extreme 6 d/yr ≥107°F today · 24 d/yr by 30 yrs out
- Wind 10/10 Extreme 99% chance of damaging wind over 30 yrs
- Air quality 2/10 Low 1 unhealthy d/yr today · 1 by 30 yrs out
Nearby sold comps map
Loading sold comps map…
Walkable amenities ~0.75 mi
Loading nearby amenities…
Taxation est. · year 1
- Rental income
- $33,738
- − Mortgage interest
- −$10,027
- − Property taxes
- −$896
- − Insurance
- −$6,014
- − Repairs & maintenance
- −$2,699
- − Management
- −$2,699
- − HOA
- −$10,476
- − Depreciation
- −$5,207
- Taxable loss
- −$4,279
- Est. tax savings @ 24.0%
- +$1,027
- After-tax cash flow
- $-969/yr
For passive investors: Depreciation is non-cash, so a rental often shows a tax loss while cash-flowing — sheltering income. Rental losses are passive: they offset passive income freely, and up to $25,000/yr can offset ordinary (W-2) income if you actively participate and your MAGI is under $100k (phasing out to $0 by $150k); unused losses carry forward. On sale, claimed depreciation is recaptured at up to 25%, and gains may owe capital-gains tax (a 1031 exchange can defer both). Figures are a year-1 estimate at your 24.0% rate — not tax advice; consult a CPA.
Schools (NCES district)
- District
- Charlotte
- NCES district ID
- 1200240
- Math proficiency
- 54% ▼ -6.00%
- Reading proficiency
- 54% ▼ -1.00%
- Median HH income
- $44,864
- Composite
- 45.62/100
- National rank
- #2586
- State rank
- #22 of 73 in FL
Livability — Rotonda
- Score
- 67/100
- State rank
- #548
- US rank
- #10359
Category grades
Schools grade is shown separately in the Schools card above.
Census & demographics
- Census place
- Rotonda, FL
- County
- Charlotte County · 196,994 people
- City population
- 10,490
- Metro
- Punta Gorda, FL
- Population (ZIP)
- 15,536
- Household income
- $57,281
- Rent vs Own
- Severe rent burden
- 329.0
Population outlook (Charlotte County) Hauer SSP2
- Today (2025)
- 198,646 people
- By 2030
- 210,507 · +6.0%
- By 2040
- 230,857 · +16.2%
- By 2050
- 247,148 · +24.4%
- By 2075
- 281,777 · +41.8%
- By 2100
- 293,609 · +47.8%
Race, ethnicity, and origin ACS 2023
- Neighborhood character
- Predominantly White (92%)
- Race & ethnicity
- White 92% Two or more races 5% Hispanic / Latino 3% Asian 1%
- Common ancestry
- Romanian 4% Slovak 4% Lithuanian 4%
- Foreign-born
- 9% · Canada
- Languages at home
- 92% English-only · Other Indo-European 2% Spanish 2% German/W. Germanic 1%
Political lean MEDSL · Charlotte
- 2024 margin
- Solid R (+34.0) · D 32.7% · R 66.7%
- 2008→2024 swing
- -26.7pp toward R · 2008: -7.2pp · 2024: -34.0pp
- All cycles
- 2024: R+34.0 2020: R+26.6 2016: R+27.8 2012: R+14.3 2008: R+7.2
Not yet ingested
- Civics
- —
Market trends
- HPI YoY
- ▼ -75.76%
- Current HPI
- 325.0345
- Rent YoY
- ▼ -0.11%
- Metro
- Punta Gorda, FL
- State GDP YoY
- ▲ 3.28%
- F500 in state
- 36
Industry mix (Fortune 500 HQ in FL)
| Industry | F500 HQs | Revenue |
|---|---|---|
| Industrial Technology | 2 | $29B |
|
||
| Insurance | 2 | $17B |
|
||
| Retail | 1 | $60B |
|
||
| Technology Distribution | 1 | $58B |
|
||
| Homebuilding | 1 | $35B |
|
||
| Technology Manufacturing | 1 | $35B |
|
||
Price history
+152.0% since first listed10 events — show timeline
- 2026-05-24 Listed $189,000 Stellar MLS as Distributed by MLS Grid
- 2026-04-01 Sold (Public Records) $75,000 Public Records
- 2017-06-01 Sold (Public Records) $159,900 Public Records
- 2013-04-16 Sold (Public Records) $115,000 Public Records
- 2012-04-09 Listing Removed — Stellar MLS as Distributed by MLS Grid
- 2010-04-05 Listed $145,000 Stellar MLS as Distributed by MLS Grid
- 2004-03-31 Sold (Public Records) $165,000 Public Records
- 2003-01-10 Sold (Public Records) $120,000 Public Records
- 1994-06-07 Sold (Public Records) $90,000 Public Records
- 1993-09-15 Sold (Public Records) $75,000 Public Records
Property tax history
-6.0%/yrLatest (2025): $896 · -3.2% YoY. Source: county tax records.
Cash-flow waterfall
monthlySold comps — $/sqft
last 12 mo · ≤1 miLoading sold comps…